-
-

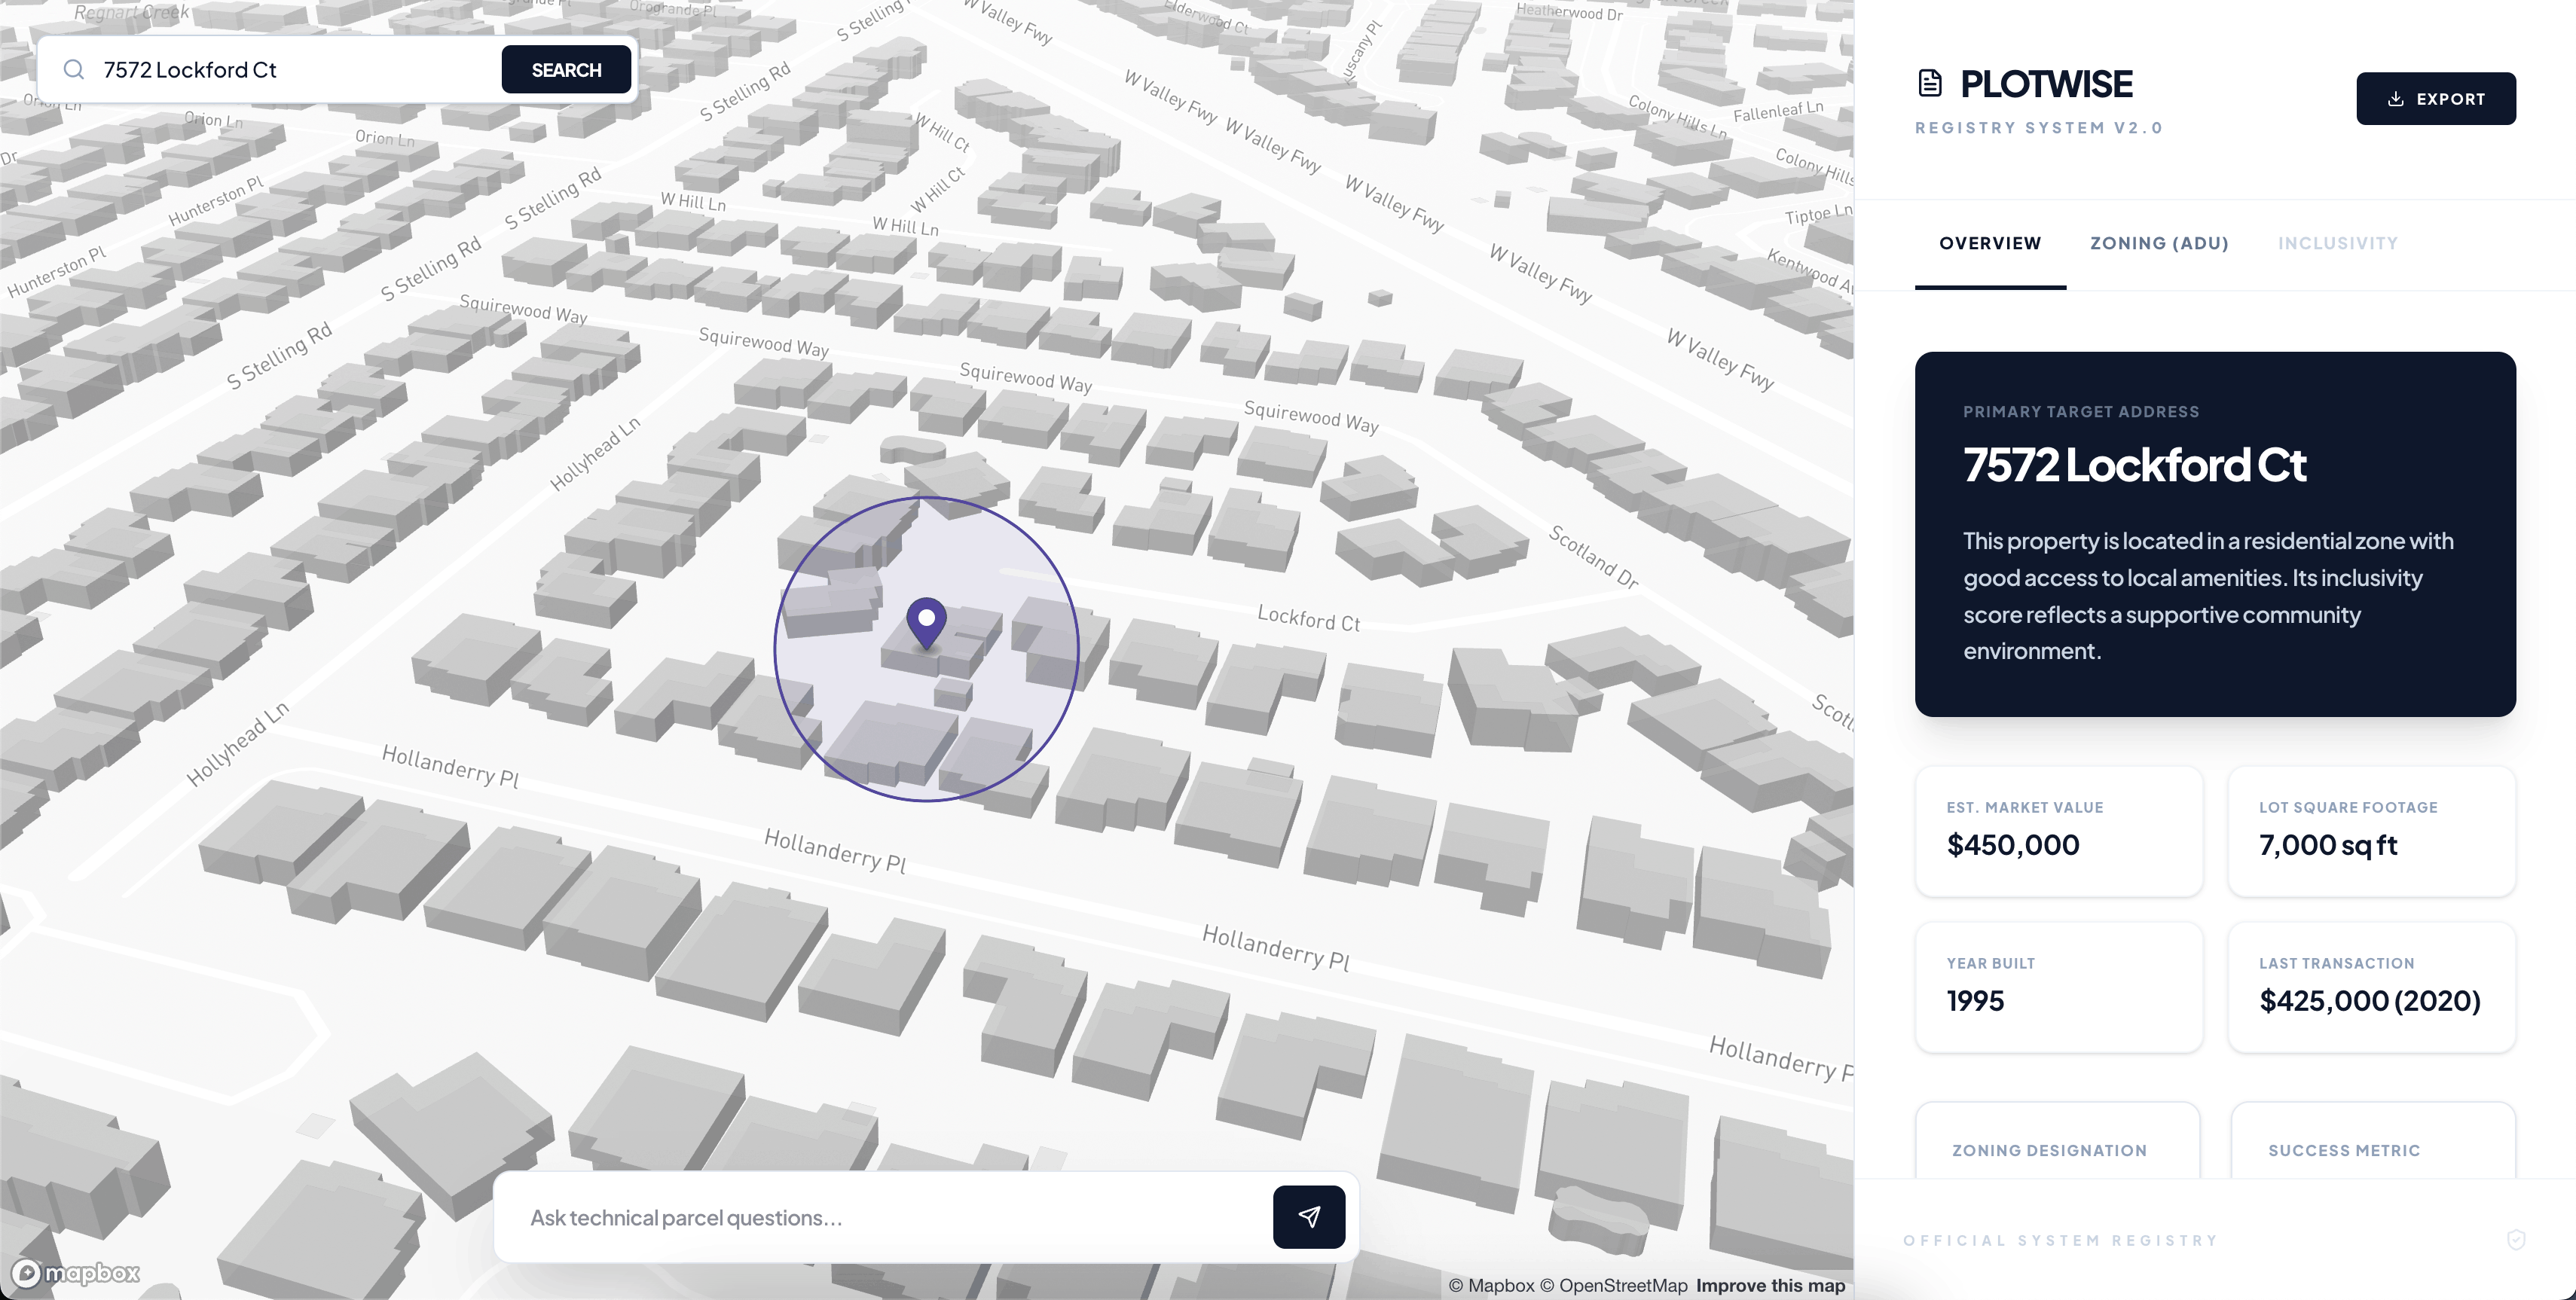
Specific Address Search (Zoom into MapBox)
-
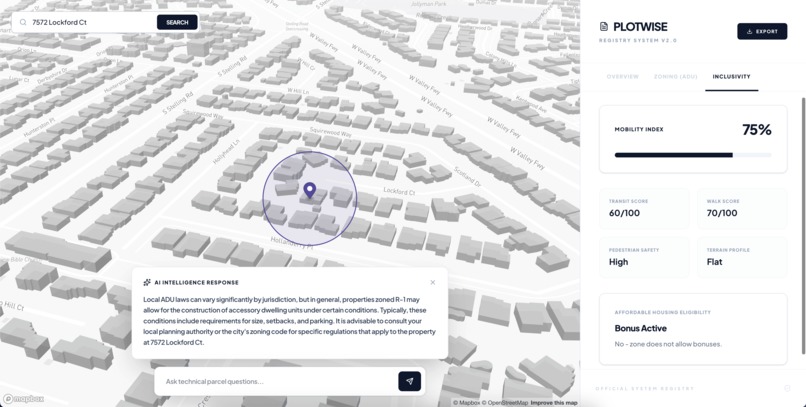
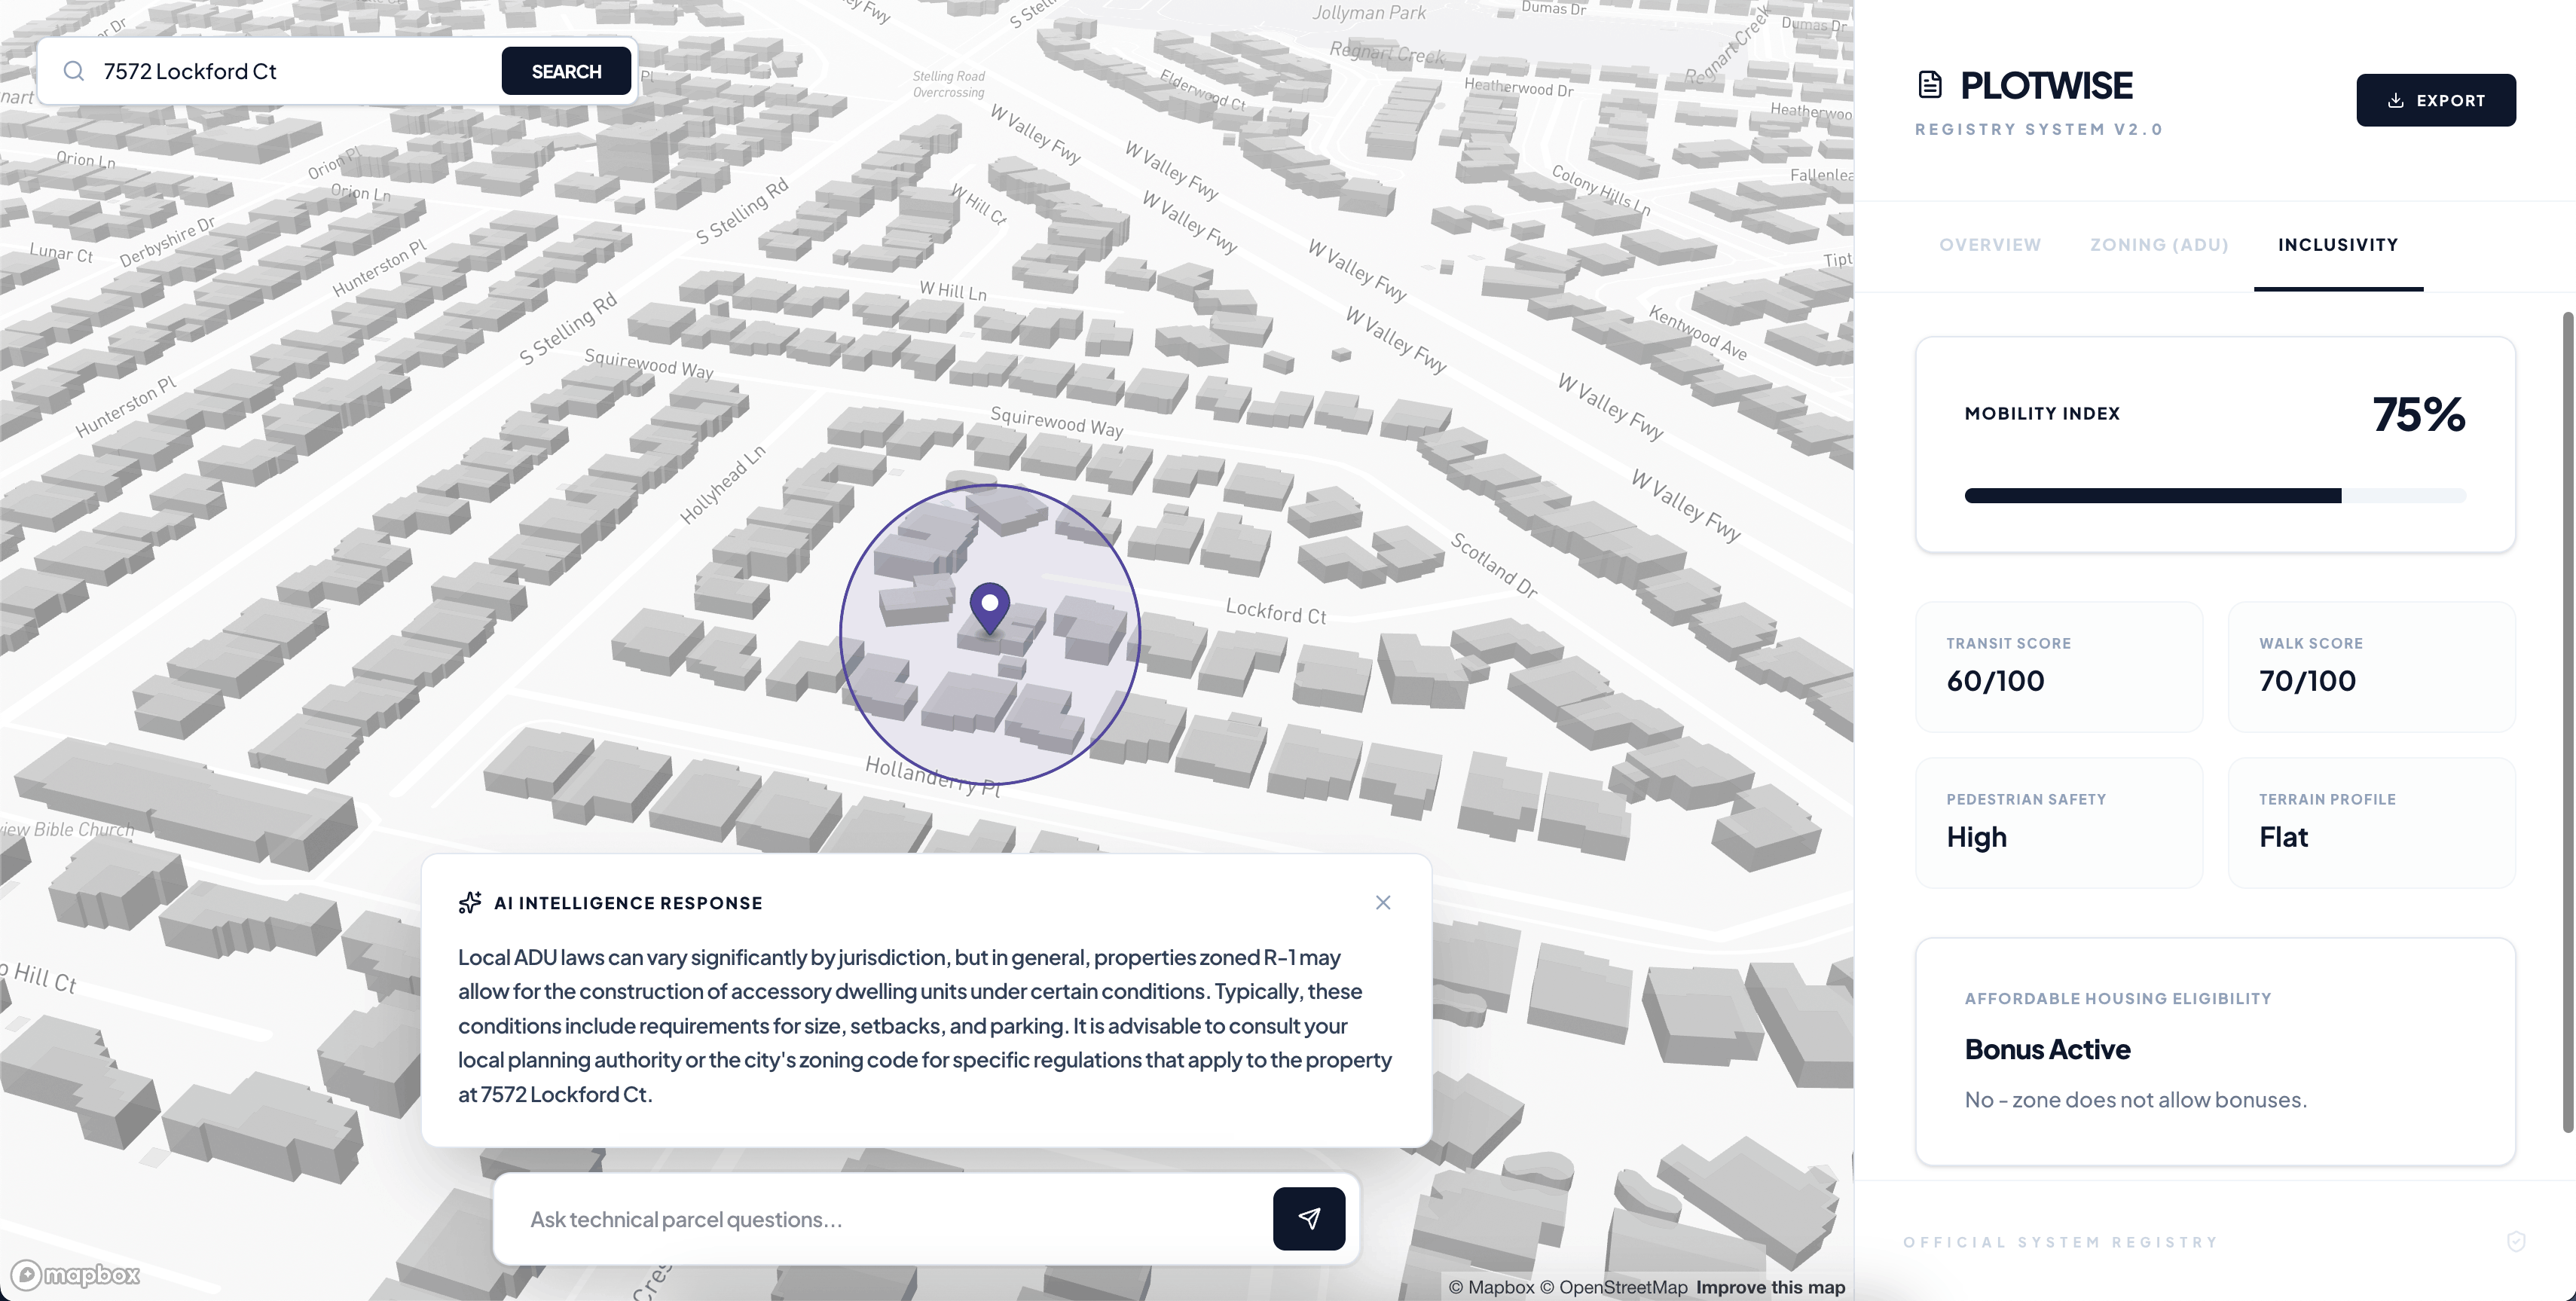
Other featured tabs and AI-assisted q/a tab on the bottom.
Inspiration
The the complexity of local zoning laws and maximizing housing values inspired PlotWise. For most people, understanding what can actually be built on a piece of land requires thousands of dollars in consultant fees and weeks of digging through archaic municipal PDFs. We wanted to build a "Registry System" that democratizes this data, allowing homeowners looking to build an ADU to see the potential of their land.
What it does
PlotWise is a full-stack spatial intelligence engine. Users enter an address, and the system instantly generates many features. It provides a detailed breakdown of max elevation, setbacks and floor area ratios. It also provides estimated market valuations and historical transaction data. In addition, there is a proprietary "Mobility Quotient" tab that is based on walkability and transit access. There is also AI-generated execution protocols for development (e.g., "Apply for ADU Permit") in the overall section that can help homeowners build their ADUs. Finally, there is an 'Ask AI' bar on the bottom for confused users or people looking for guidance, and you can also export all the data as a PDF!
How we built it
For the frontend, we used React and Vite for a lightning-fast UI, styled with a high-contrast "System Registry" aesthetic --> Tailwind CSS. We also integrated Mapbox GL JS for real-time geocoding and interactive parcel visualization. We utilized the OpenAI (GPT-4o-mini) model with structured JSON outputs to parse and simulate complex zoning narratives. Finally, we automated CI/CD pipelines via GitHub, with the frontend living on Vercel and the backend engine on Render.
Challenges we ran into
Our biggest challenge was deploying the project since we have never had experience deploying both frontend and backend (only experience was with Vercel). We had to spend a while figuring things out with Render and how to connect both of them.
Accomplishments that we're proud of
Some accomplishments that we are most proud of are a seamless integration of Mapbox, successful display of information, and a deployable website from both the frontend and backend.
What we learned
Building PlotWise taught us how to bridge the gap between unstructured municipal data and structured React components. We gained a deep understanding of ADU (Accessory Dwelling Unit) feasibility, specifically how local ordinances use variables like setbacks and lot coverage to dictate backyard construction limits. On the technical side, we learned how to implement LLM-driven data parsing to turn conversational zoning narratives into a strict JSON schema that our frontend could reliably render into a "Stats Grid." We also mastered how to deploy a project featuring a FastAPI backend and a Vercel frontend. Finally, we learned the importance of client-side state management when handling complex spatial data, ensuring that as a user toggles between "Zoning" and "Inclusivity" tabs, the underlying Mapbox coordinates and AI analysis remain perfectly in sync.
What's next for PlotWise
We have three goals for the future of PlotWise:
- Connecting to Estated or RentCast for live, government-verified tax and title records.
- Solar Feasibility: Utilizing the Google Solar API to calculate the annual kilowatt/hour potential of every rooftop based on shading and slope.
- Using Mapbox's 3D terrain to show a "Ghost Box" of the maximum buildable volume allowed.
Built With
- api
- fastapi
- html
- jspdf
- lucide
- mapbox
- openai
- python
- react
- redfin
- render
- tailwindcss
- typescript
- vercel
- vite


Log in or sign up for Devpost to join the conversation.