-
-

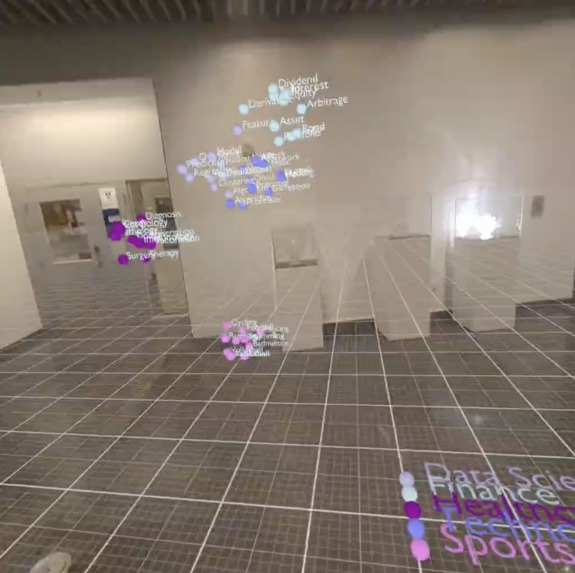
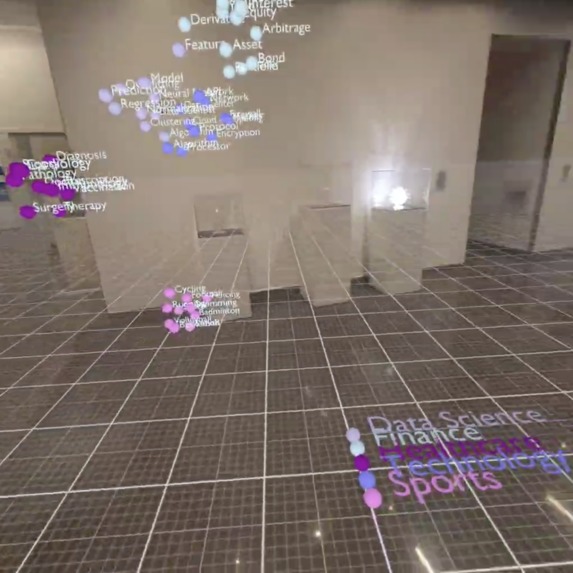
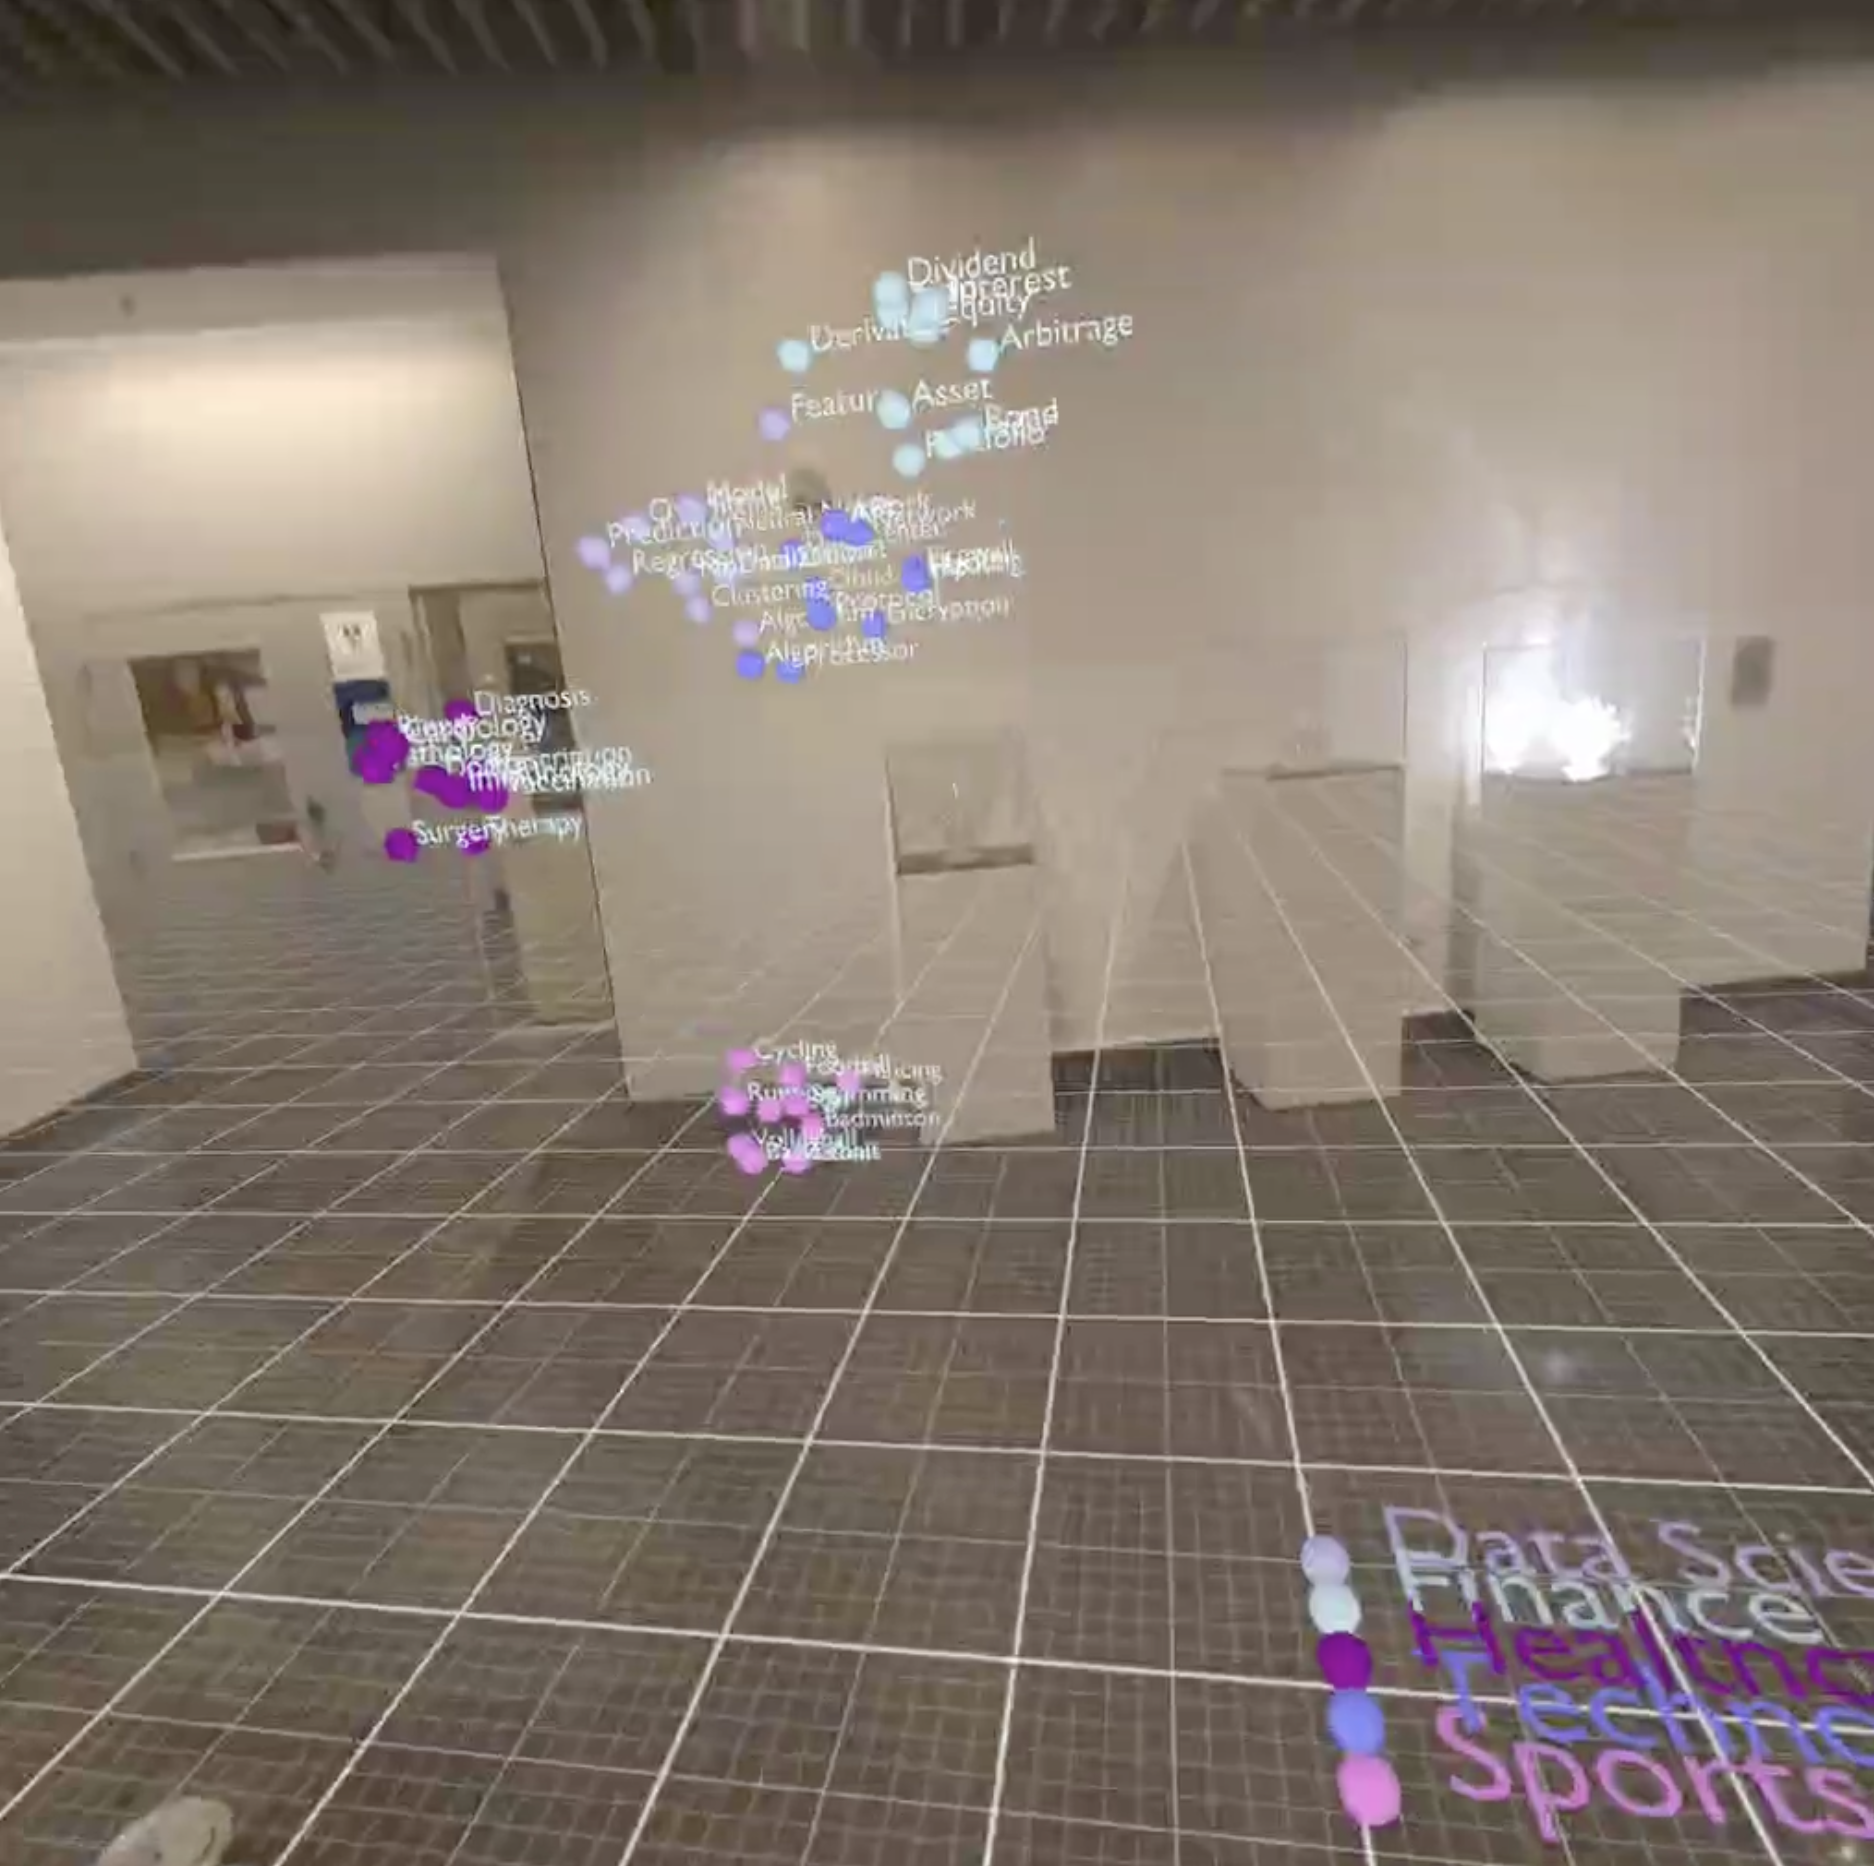
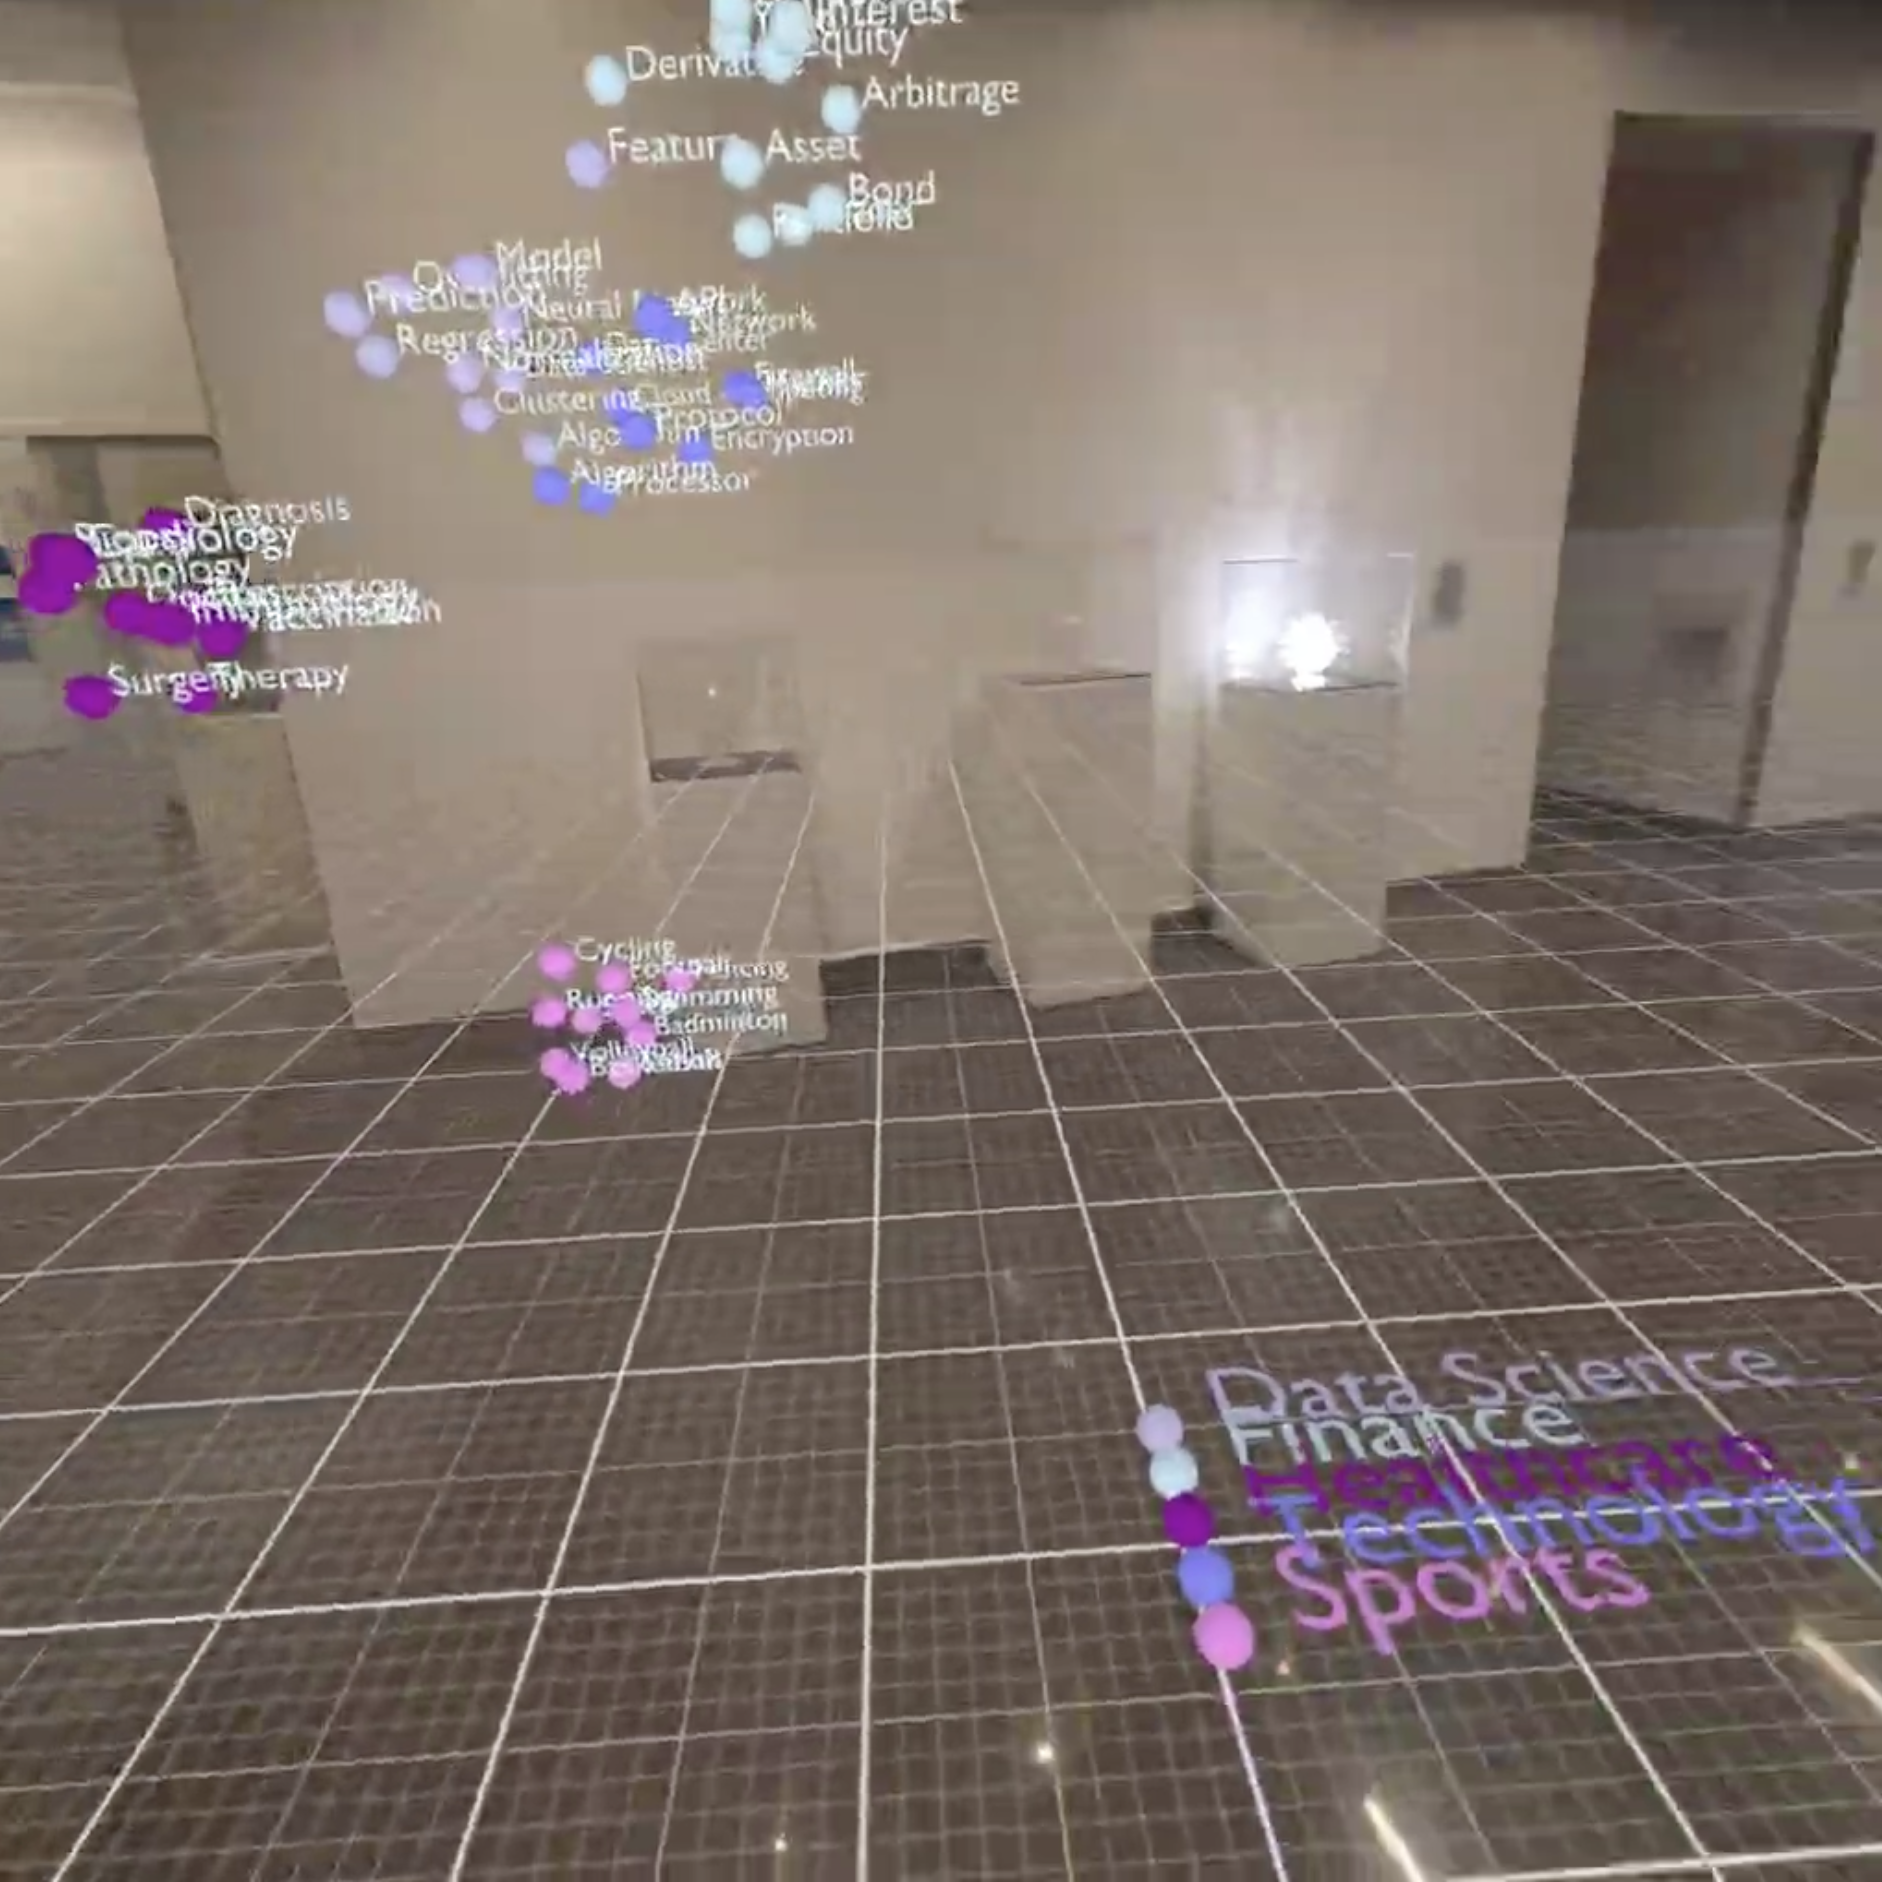
3D plot visualised in XR
-
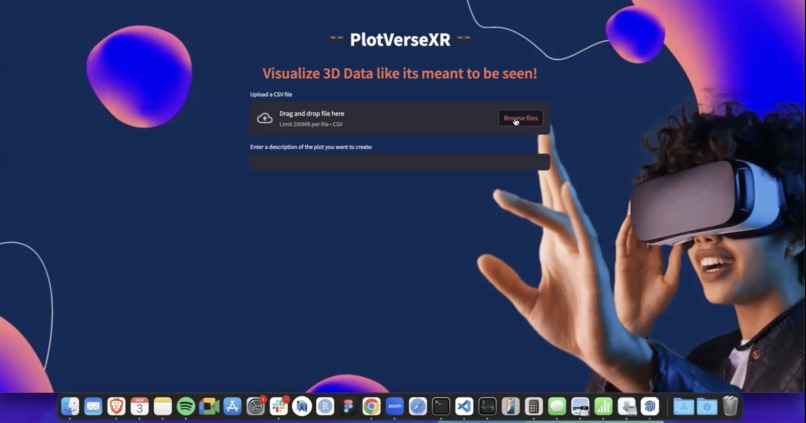
Dashboard intro
-

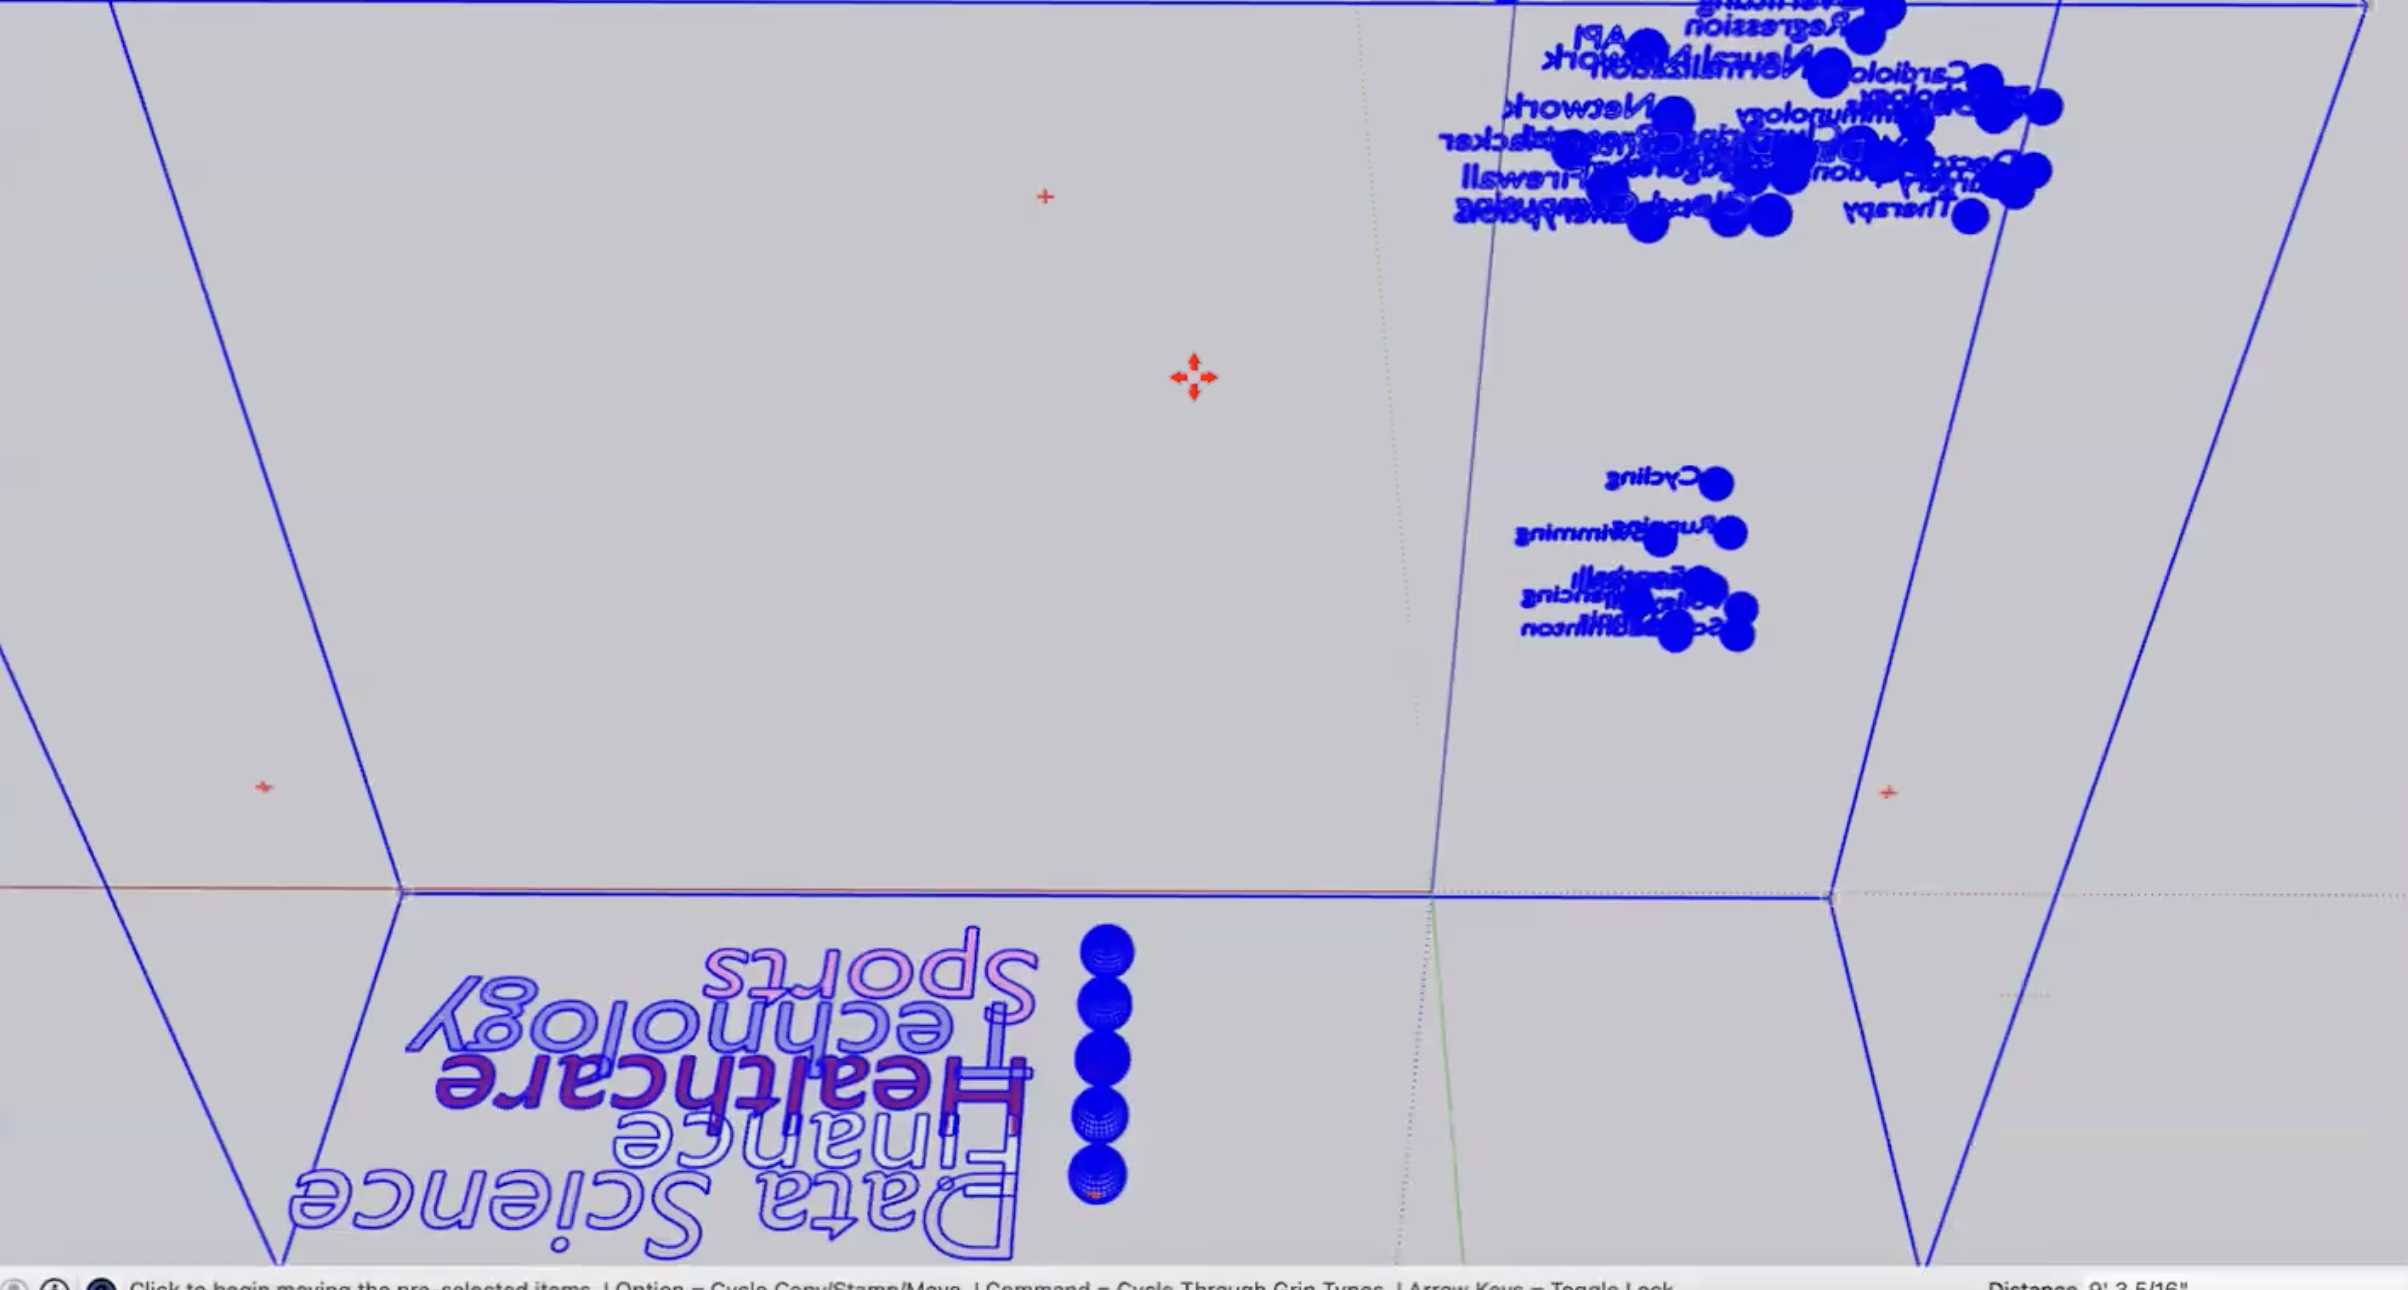
3D plot generation
-

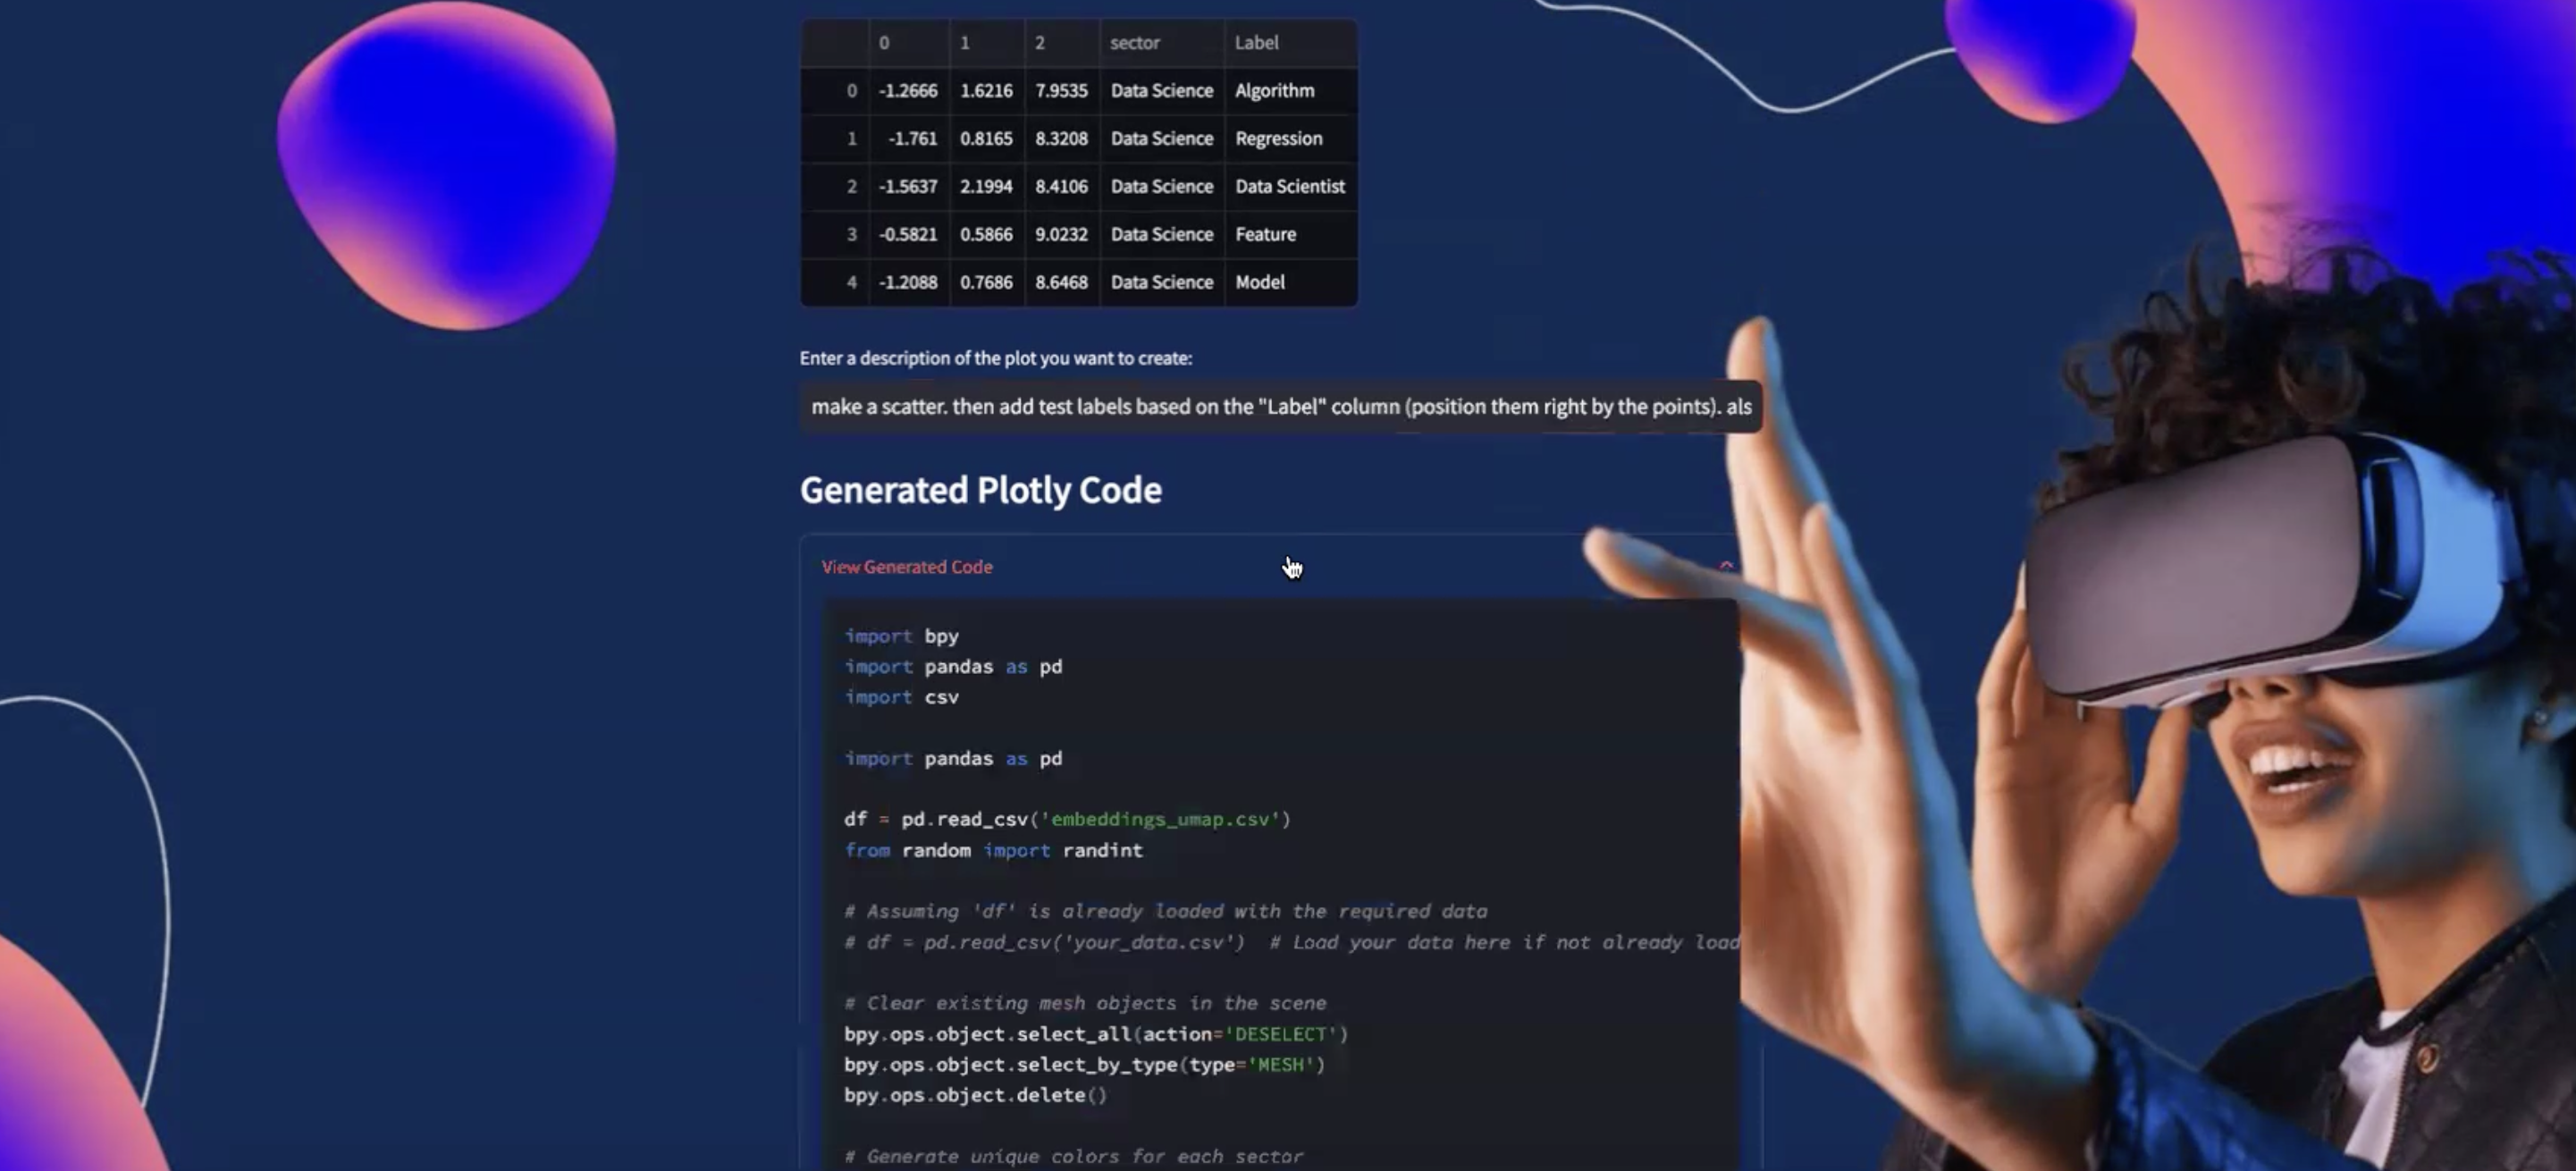
Plot code generation from a single natural language prompt
-
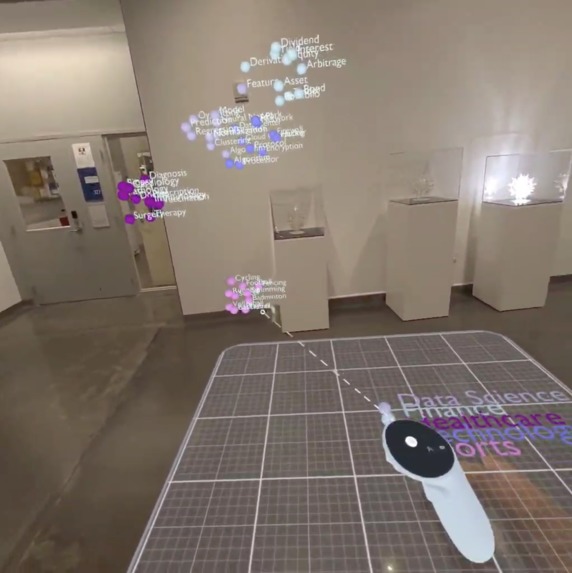
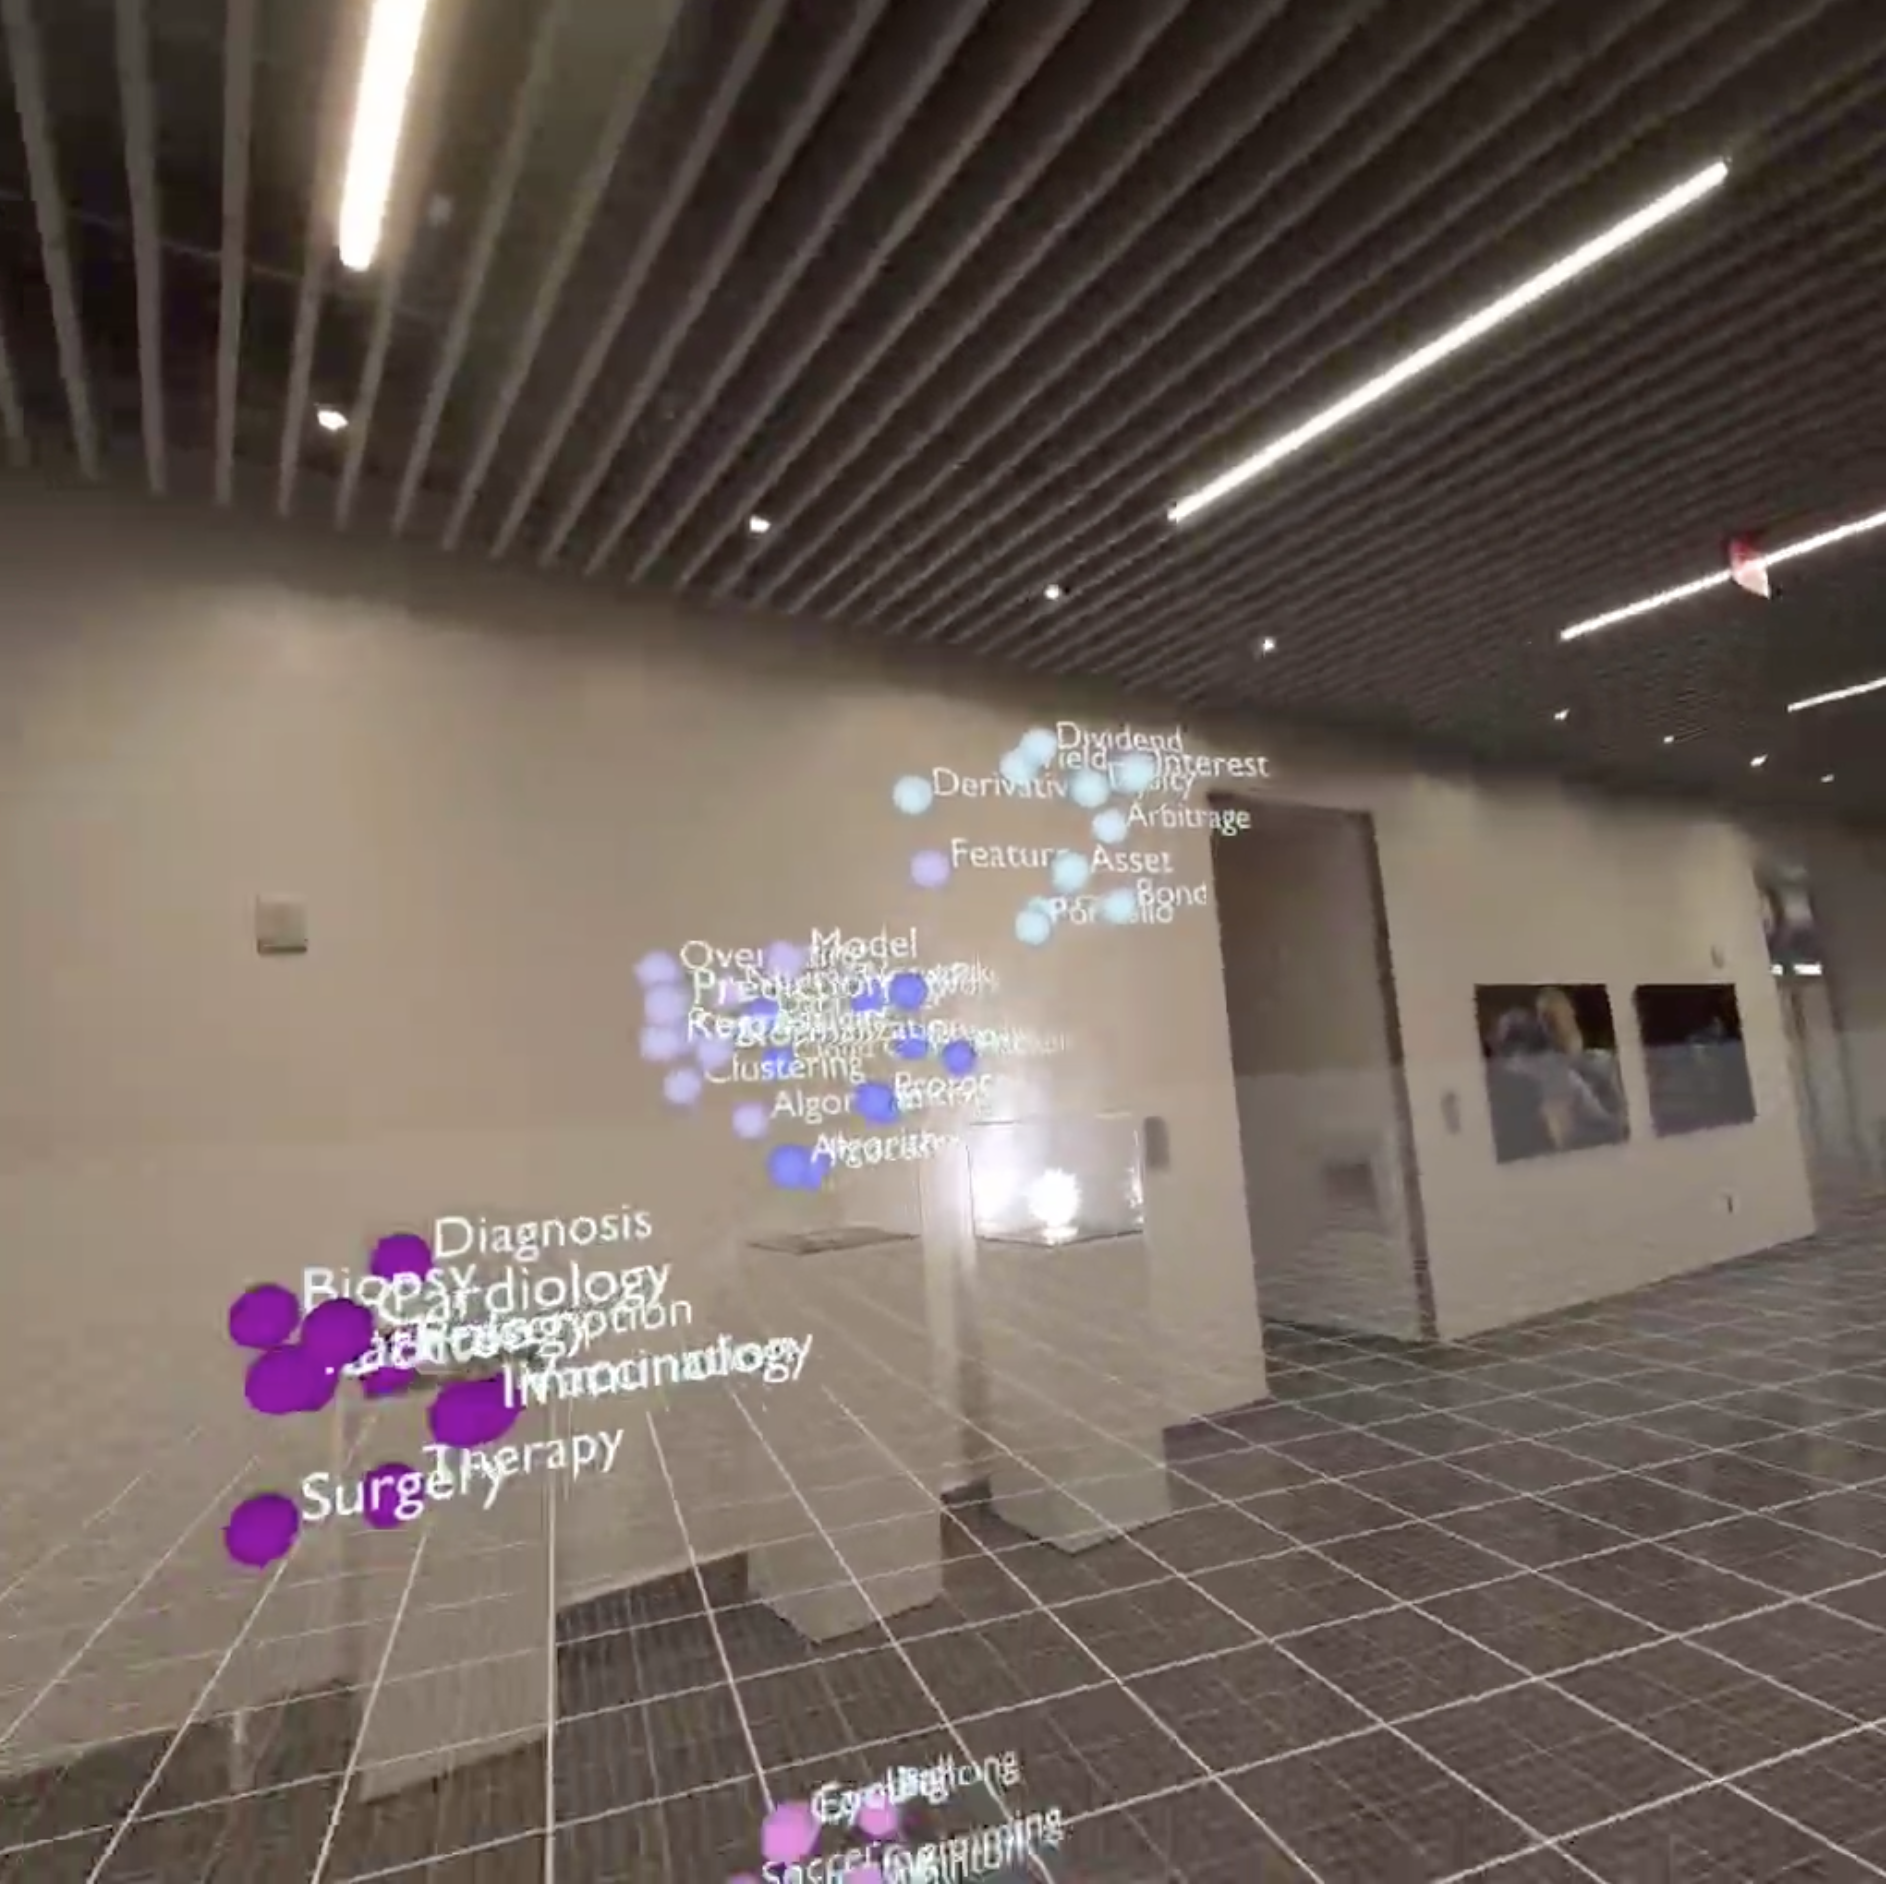
3D plot visualised in XR
-
3D plot visualised in XR
-
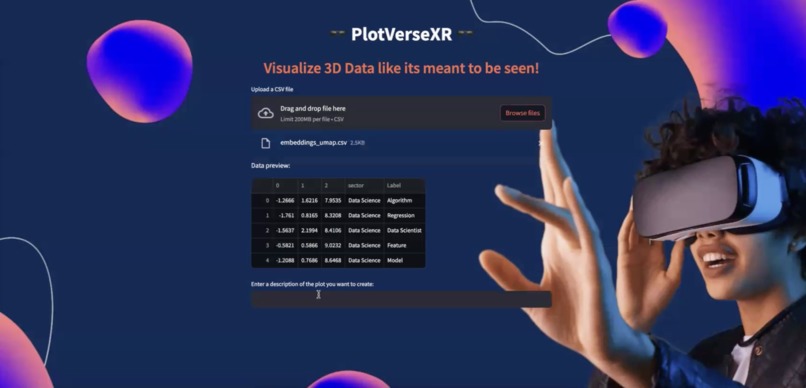
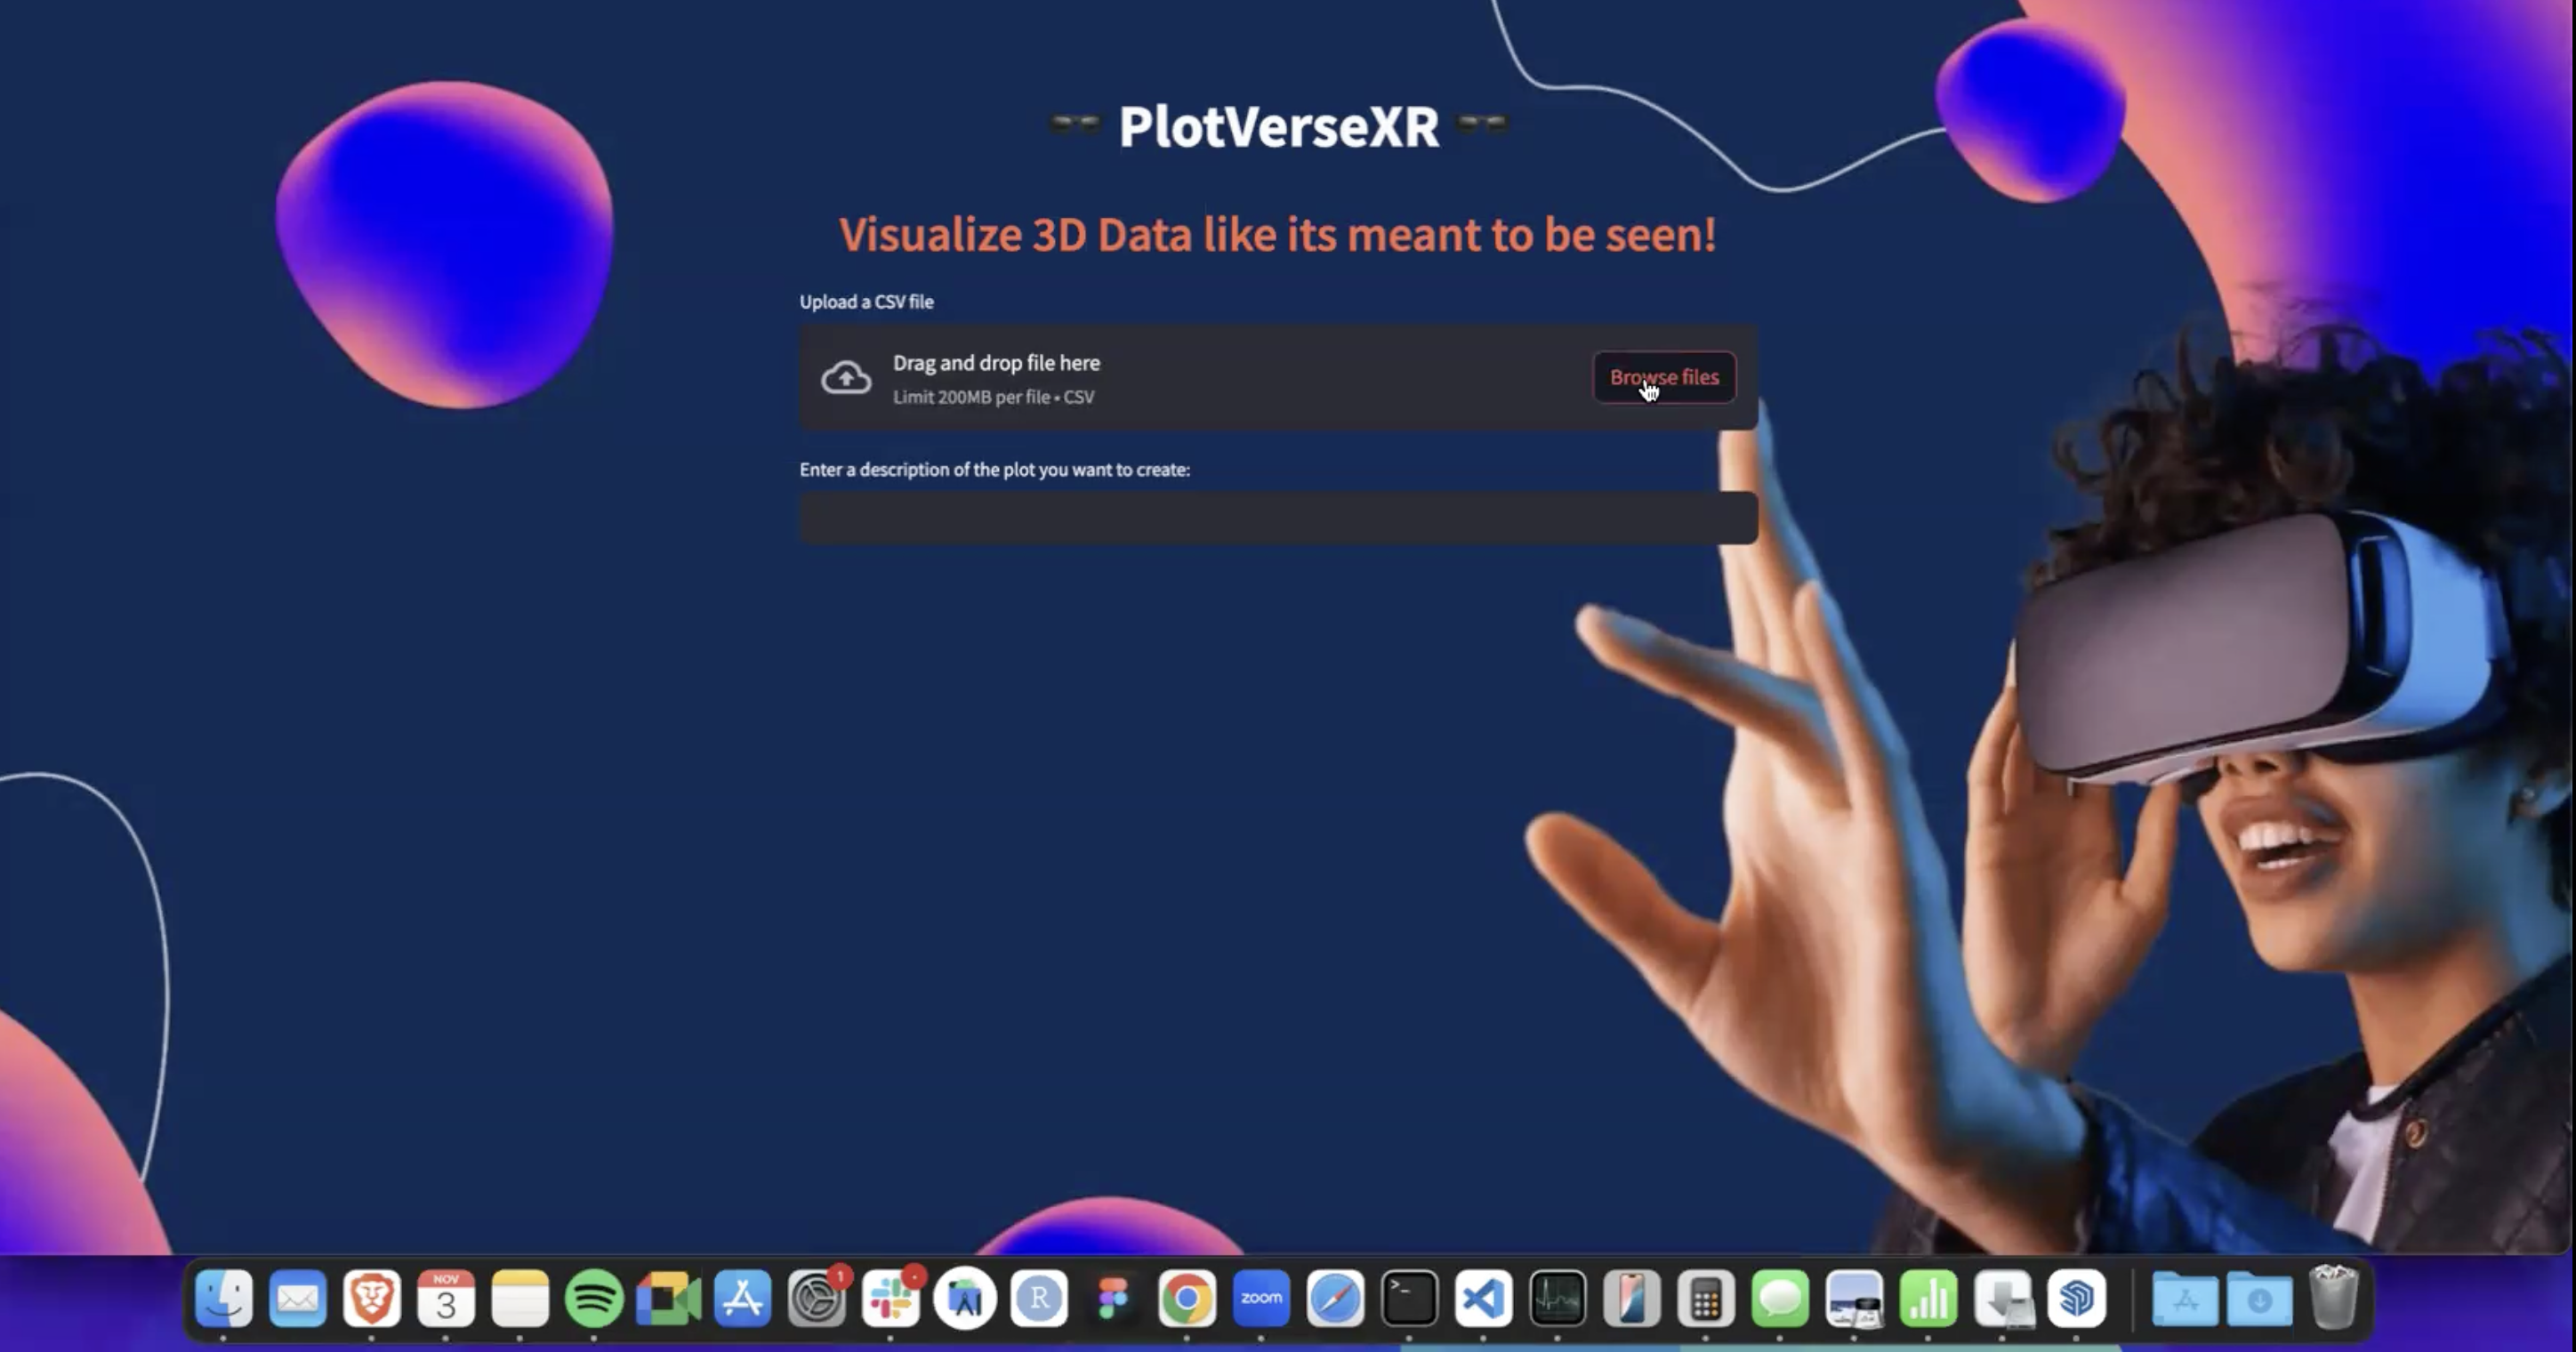
Dataset Upload
-
3D plot visualised in XR


Inspiration
Inspired by the belief that data should be experienced, not just viewed, we're bridging the gap between 2D plots and spatial understanding. The fundamental limitation of 2D screens - trying to compress three dimensions into two - has always forced us to sacrifice either information or clarity. Our platform breaks free from these constraints, transforming raw datasets into immersive XR visualizations using nothing but a simple natural language prompt. Whether it's scatter plots floating in space, bar charts you can walk through, or histograms that tower above you, every visualization is instantly accessible on your Meta Quest. We're not just plotting data - we're creating a new way to discover insights through spatial exploration, one that respects the true dimensionality of our data.
What it does
Our platform seamlessly bridges data visualization and virtual reality. Users simply provide their dataset and express their visualization needs in natural language. The system intelligently converts these natural language requests into dynamic 3D visualizations which are instantly viewable in XR on Meta Quest. Each data point is meticulously positioned in virtual space, ensuring perfect spatial accuracy and true-to-scale representation. This precision becomes particularly powerful when visualizing LLM embedding spaces - allowing users to physically explore how concepts are related within these models. By walking through the three-dimensional embedding space, researchers can intuitively verify if semantically similar concepts cluster together and identify unexpected relationships that traditional 2D visualizations might miss. From floating scatter plots to interactive bar charts, histograms to spatial line graphs - any data story can be transformed into an immersive experience where every dimension, distance, and relationship is precisely preserved.
How we built it
Built on Streamlit, our platform democratizes spatial data visualization. Users simply upload their dataset and describe their visualization needs in natural language. Powered by OpenAI, the system intelligently generates custom Plotly code to create precise 3D visualizations. These visualizations are seamlessly converted into spatial objects and deployed to Meta Quest, letting users explore their data in immersive XR.
Challenges we ran into
This project marked our first dive into XR development, pushing us far beyond our comfort zone. Despite the steep learning curve of XR technology, we embraced the challenge and managed to build a working prototype in just 24 hours. The complexity of spatial computing might have been daunting, but it only fueled our determination to bridge the gap between data visualization and immersive experiences.
Accomplishments that we're proud of
We take pride in our streamlined automation pipeline - a testament to elegant simplicity. Feed in your data, express your visualization needs in plain natural language, and watch as our system orchestrates the entire journey from raw data to spatial XR objects, all without a single line of technical input from the user.
What we learned
This hackathon taught us that the intersection of data and spatial computing is where magic happens. We learned to navigate the complexities of XR development, mastered the art of seamless automation, and discovered that making technology invisible - where complex visualizations emerge from simple natural language prompts - is both challenging and rewarding. Perhaps most importantly, we learned that ambitious ideas, even with tight time constraints, can transform from concept to reality when you're solving the right problem.
What's next for PlotVerseXR
Our next frontier is democratizing this technology through an open-source package, empowering developers worldwide to experiment and innovate. We believe that placing these tools in the hands of the global tech community could spark unexpected breakthroughs - after all, innovation often emerges from the most unexpected places. Beyond this, we're excited to push the boundaries of user interaction by implementing real-time plot manipulation and voice-powered data queries, making data exploration as natural as having a conversation in virtual space.


Log in or sign up for Devpost to join the conversation.