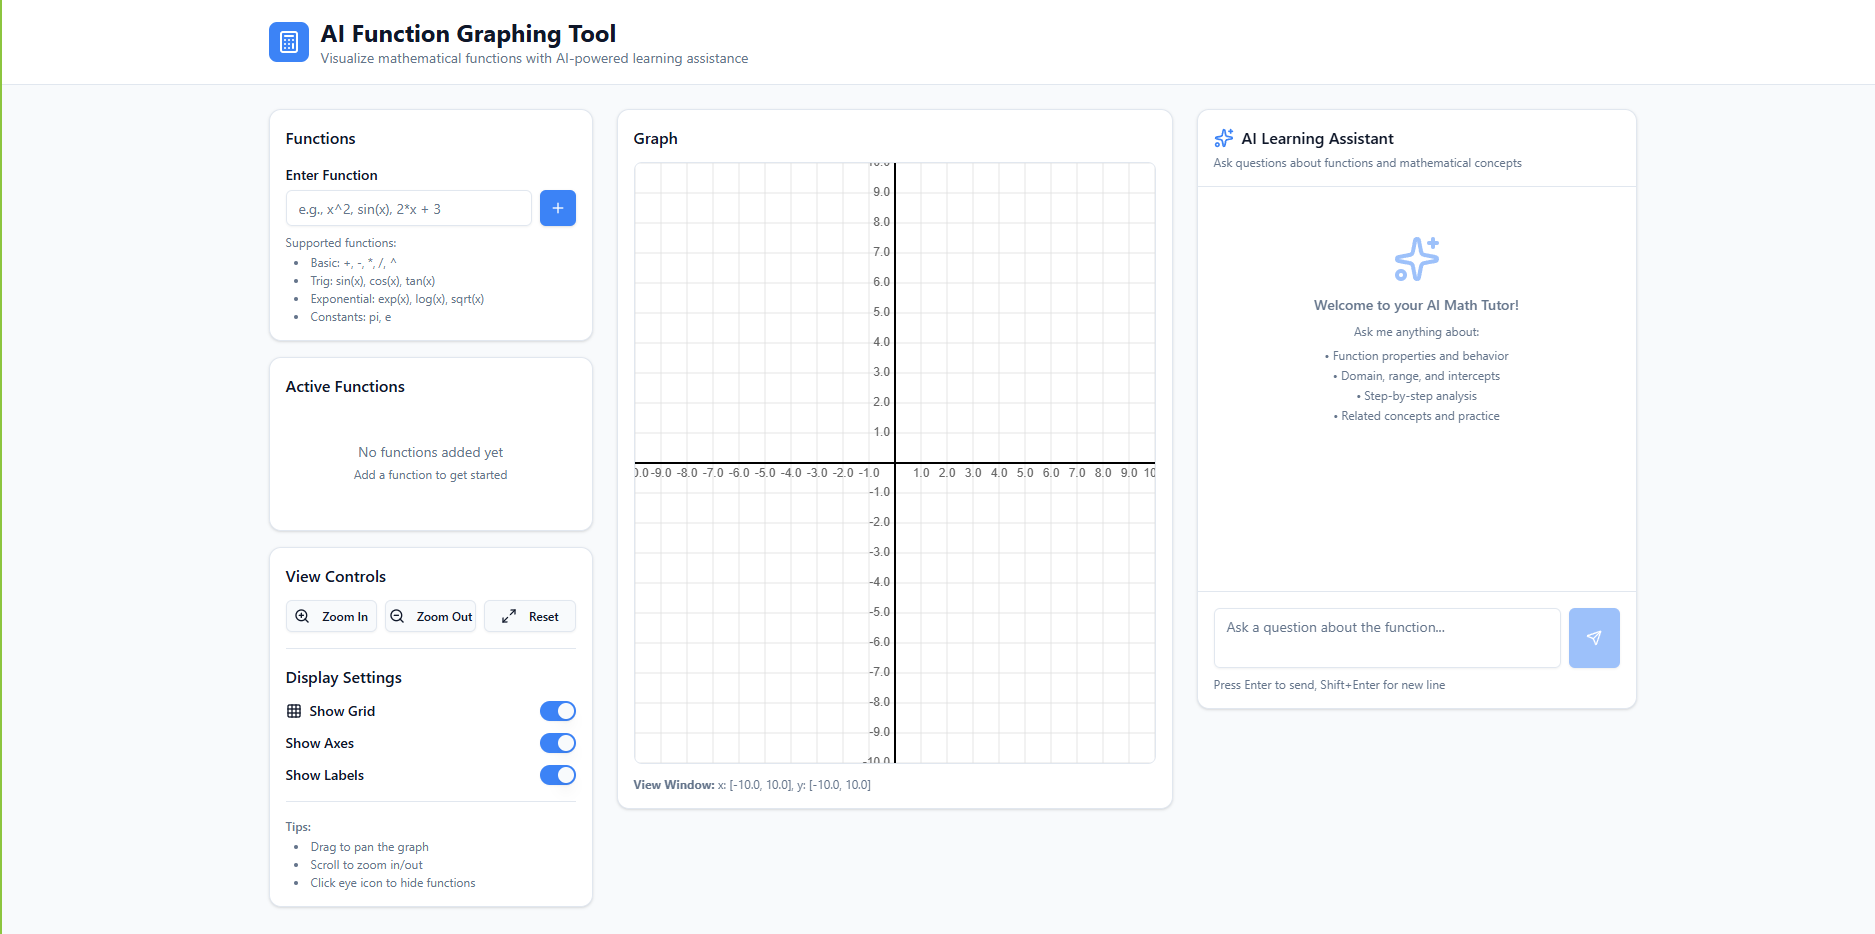
Inspiration The spark for PlotPal came from a common classroom frustration: the "Black Box" effect. Students often treat graphing calculators like magic spells—input an equation, and a shape appears, but the underlying logic remains a mystery. We wanted to transform the graphing experience from a static image into a dynamic conversation, where the "why" is just as accessible as the "what." What it does PlotPal is an AI-powered mathematical canvas. It provides: Real-time Rendering: Instant visualization of complex functions like $f(x) = \frac{\sin(x)}{x}$. Contextual AI Tutoring: A built-in assistant that identifies properties like the y-intercept $(0, b)$ or limits like $\lim_{x \to 0} \frac{\sin(x)}{x} = 1$ without being asked. Smart Comparisons: The ability to overlay multiple functions to visualize intersections and transformations in real-time. How we built it We built the core engine using a modern, scalable stack: Frontend: React and Tailwind CSS for a sleek, responsive workspace. Graphing Core: We utilized Math.js for expression parsing and a custom HTML5 Canvas renderer to handle high-performance plotting. AI Integration: We integrated Gemini 1.5 Flash to act as the "mathematical brain," processing function data to provide pedagogical explanations. Math Formatting: We used LaTeX to ensure all AI responses look like professional textbook entries. Challenges we ran into The most significant hurdle was Sampling Density. Plotting a simple line is easy, but rendering a function with a vertical asymptote, such as:
$$f(x) = \tan(x)$$ ...initially caused "ghost lines" where the renderer tried to connect $+\infty$ to $-\infty$. We had to implement a discontinuity-detection algorithm to ensure the graph stayed mathematically accurate. Additionally, grounding the AI to only talk about the visible range of the graph required complex state-sharing between the canvas and the chat window. Accomplishments that we're proud of We are incredibly proud of our "Aha! Moment" feature. When a user clicks an intersection point, the AI doesn't just give the coordinates; it explains the algebraic steps to solve $f(x) = g(x)$. Creating a tool that feels like a teacher standing over your shoulder—rather than just a computer—was our greatest win. What we learned We learned that UX in EdTech is a balancing act. Too much automation makes students lazy; too little leaves them frustrated. We also gained deep technical knowledge in coordinate transformations, specifically mapping mathematical Cartesian planes to browser-based pixel coordinates. What's next for PlotPal The next frontier for PlotPal is 3D Visualization. We want users to be able to rotate multivariable functions like $z = x^2 + y^2$ and have the AI explain the curvature and gradients of 3D surfaces. We’re also looking into "OCR for Math," allowing students to snap a photo of their homework and have PlotPal render and explain it instantly.
Built With
- medo

Log in or sign up for Devpost to join the conversation.