-
-
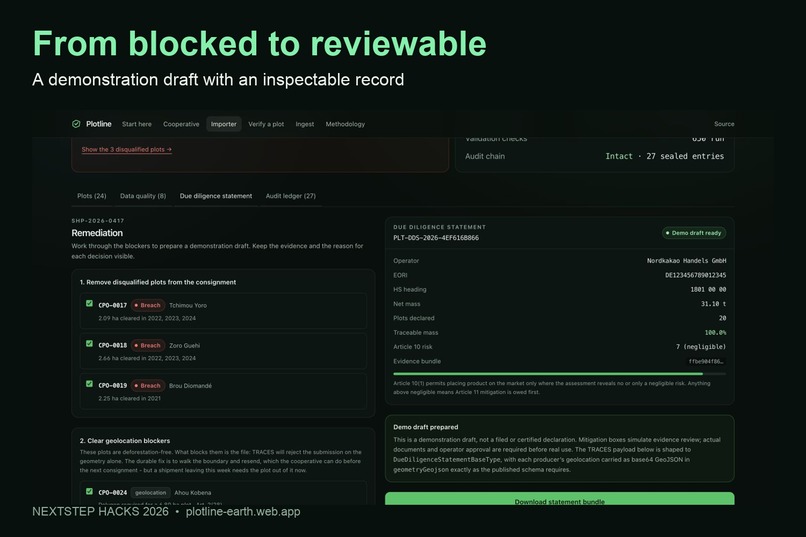
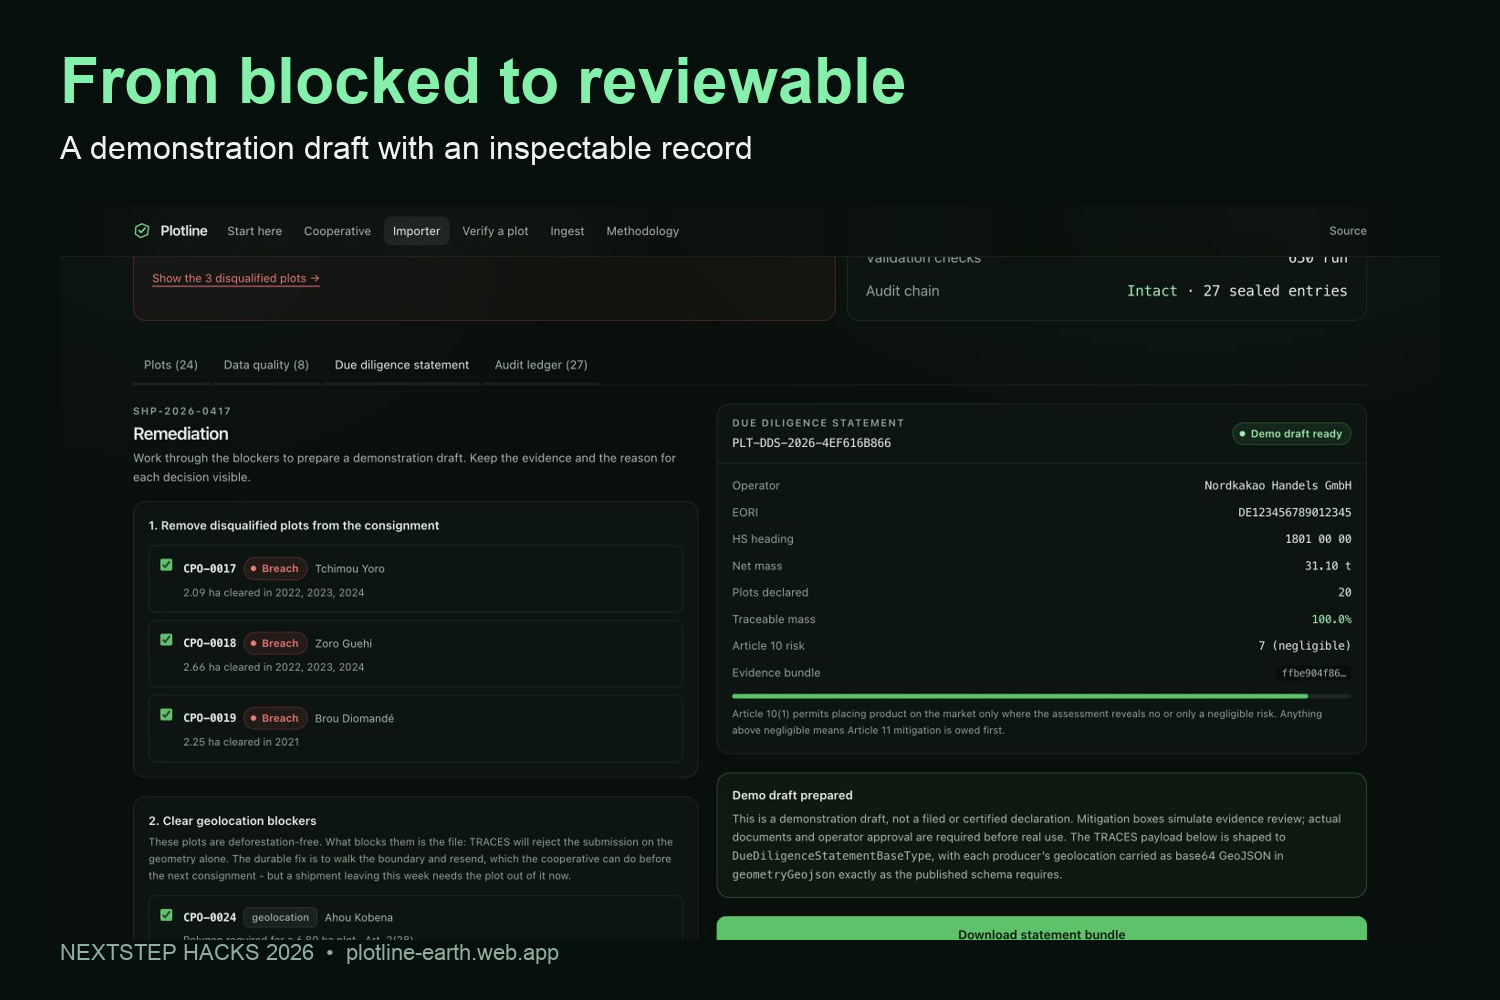
Remediation produces a demonstration draft for 20 plots. Documents and operator approval are still required.
-
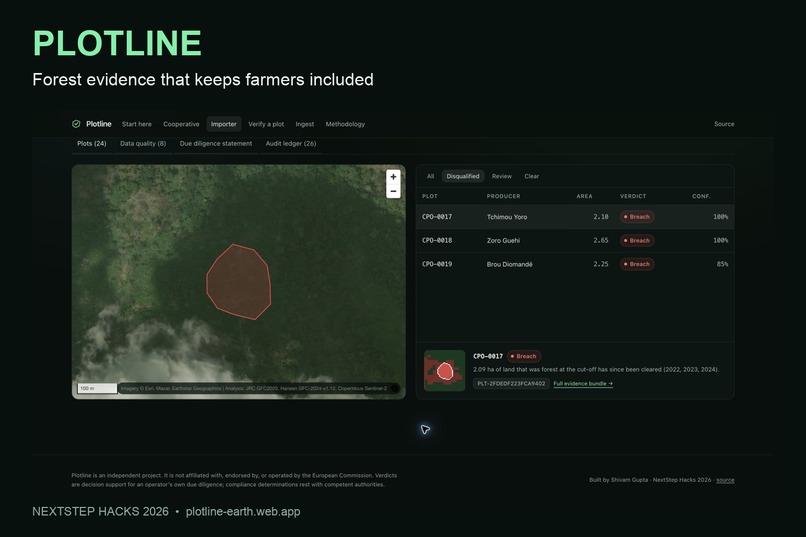
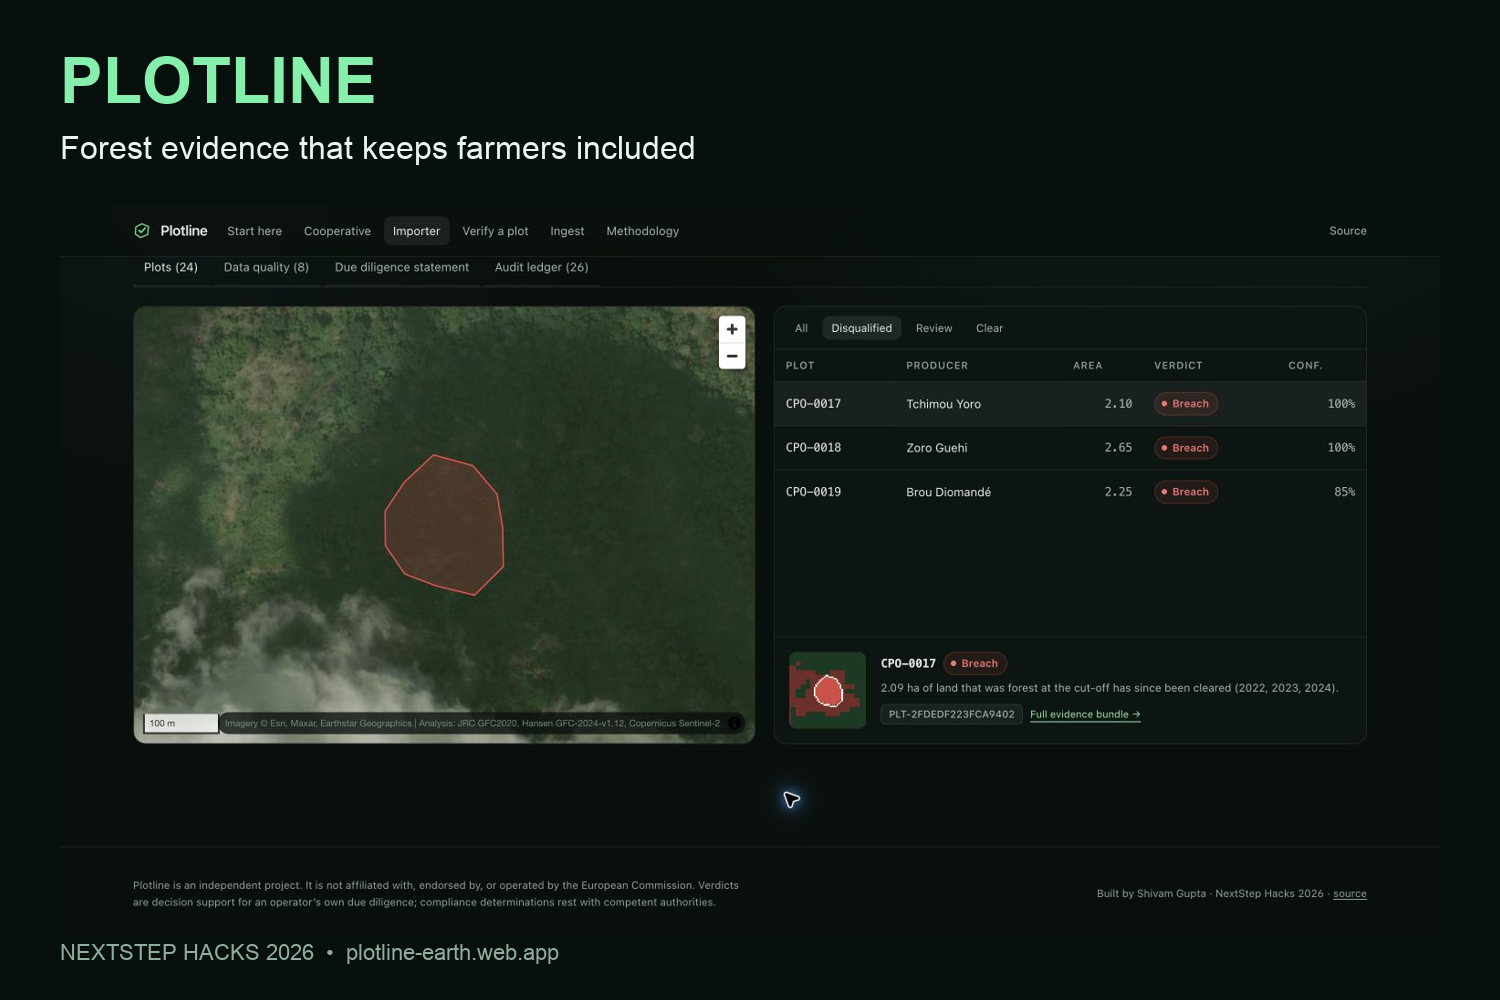
A map of the fictional cooperative, filtered to three plots with real satellite evidence of forest loss.
-
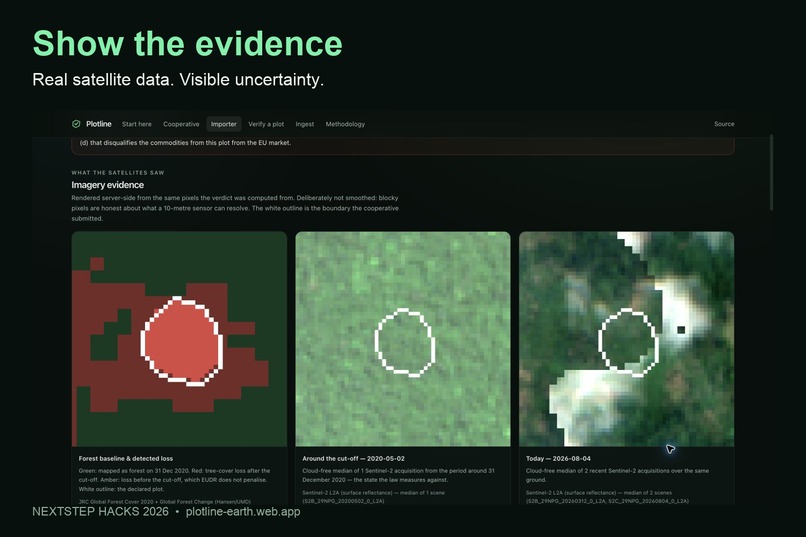
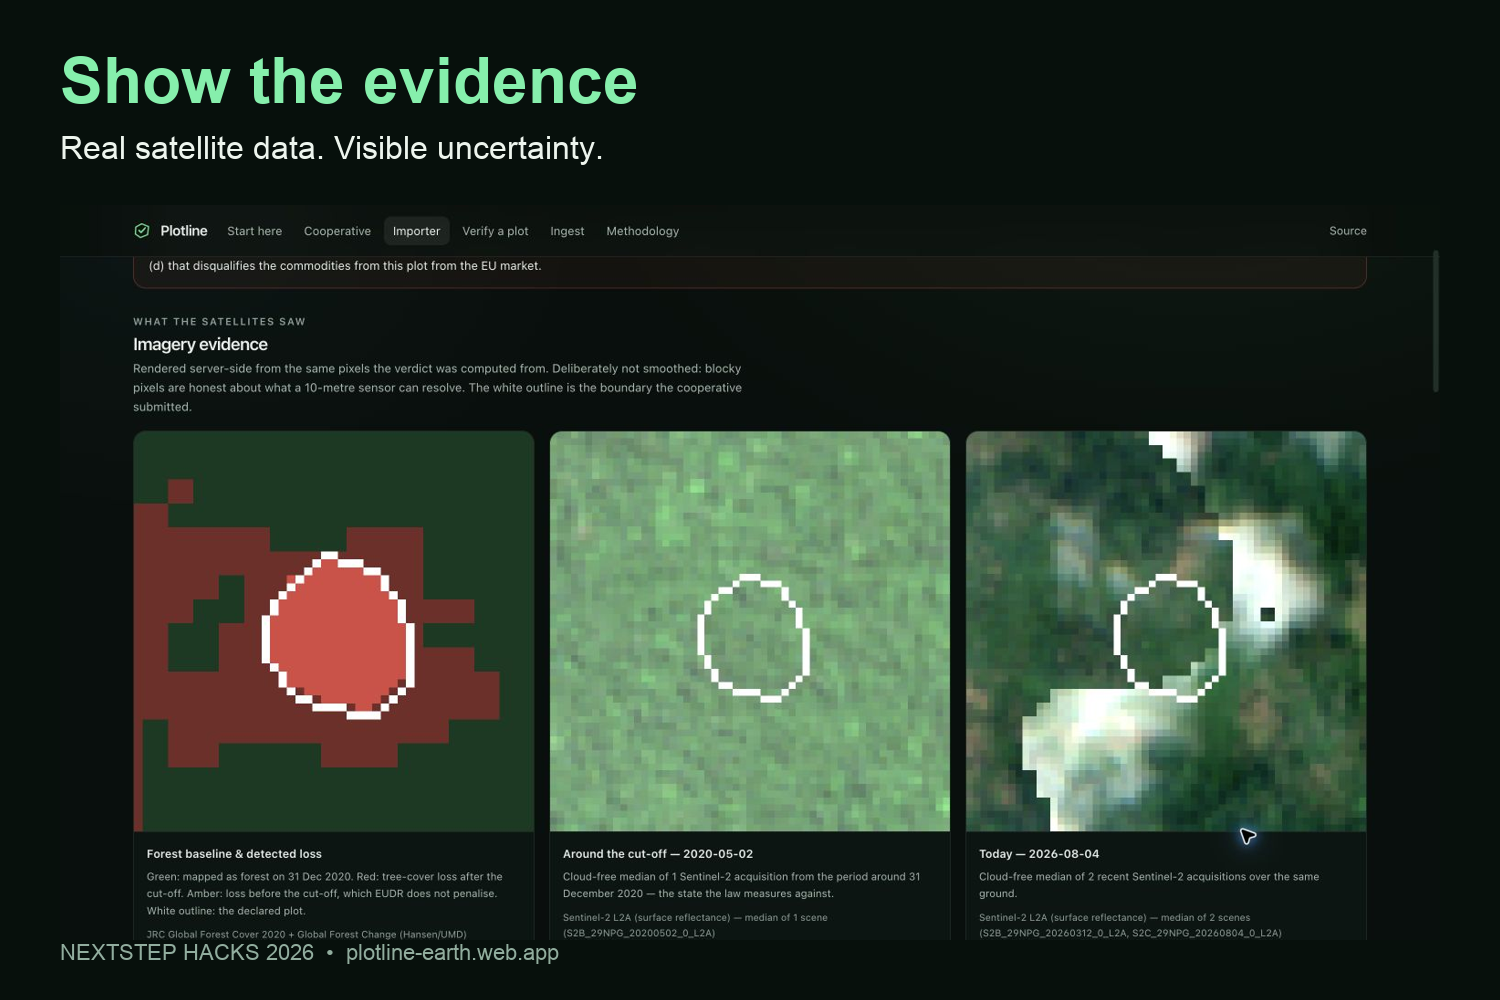
JRC forest baseline, Hansen loss and Sentinel-2 imagery make the evidence inspectable.
Plotline
Protect forests without leaving smallholder farmers behind.
Inspiration
A chocolate bar has a long journey before it reaches a shop. It starts on a farm, passes through a cooperative, and becomes part of a buyer's shipment. Somewhere along that journey, a simple question becomes difficult: did growing this cocoa replace a forest?
The EU Deforestation Regulation makes traceability matter. But a smallholder farmer may have a GPS point in a notebook and a harvest recorded in bags, while a buyer needs structured geolocation and evidence. We wanted to make that gap smaller without making the farmer pay for expensive satellite access.
That is our Earth Forward idea: help buyers identify risky sources while making it easier for farmers to provide the information responsible sourcing requires.
What it does
Plotline takes a cooperative from a messy field message to a reviewable due diligence draft.
- Read field records. Paste the French sample or your own text. AI extracts the fields. Deterministic code handles decimal commas, GPS formats, coordinate order, hectares and harvest units. Coordinates changed or invented by the model are rejected.
- Screen land. Compare a plot against the JRC Global Forest Cover 2020 baseline, Hansen annual tree-cover loss and Sentinel-2 imagery. See each source, the dates, the measurements and the uncertainty.
- Understand a shipment. The importer workspace combines a map, plot evidence, geolocation checks, risk findings and a statement builder.
- Resolve blockers. The demo starts with a blocked shipment. Remove flagged plots, address the oversized point plot, and simulate evidence review to prepare a draft. Download the result for inspection.
- Explain the result to the cooperative. A phone-friendly view in French and English names the producer and explains next steps.
- Keep the evidence. Download plot GeoJSON, live verification JSON and a statement bundle. Inspect the hash-linked audit record.
The sample cooperative and shipment are fictional. Its 24 plots use real locations and saved satellite analyses. Three show about 7 hectares of post-cut-off loss. These are demo screening results, not a claim of measured conservation impact.
How we built it
We built Plotline with Next.js, React and strict TypeScript. MapLibre displays the plot boundaries. Turf, GeoTIFF and projection utilities handle spatial calculations. Zod validates API inputs.
The satellite engine uses HTTP range requests to read the relevant pieces of large Cloud-Optimised GeoTIFFs. It weights pixels by how much of each pixel falls inside a plot, which matters for small farms near the resolution limit.
OpenAI structured output handles field extraction. The model copies coordinate strings; code checks their presence in the source and performs the conversions. A deterministic scanner remains available if the model cannot be reached.
Firebase Hosting provides the public URL, with a separate Cloud Run service behind it. The API key lives in Google Secret Manager and is available only to the server. Public-demo request budgets, input limits and bounded archive waits help keep the demo usable.
Shivam Gupta directed the problem, product and submission. Claude and Codex assisted with implementation, review and testing. The demonstration uses an AI-generated voiceover.
Challenges we ran into
Green does not always mean forest. Cocoa planted after a clearing can look green again. We combined the forest baseline and annual loss record with canopy-change evidence instead of treating greenness as proof.
Small plots expose measurement limits. A farm boundary can cut across just a few satellite pixels. Sub-pixel weighting reduces boundary artefacts, but it cannot create detail the source does not contain. The app shows that limitation.
Public archives are not instant. Fresh imagery can be slow or unavailable. We bounded the wait, preserved available evidence, and kept missing sources visible.
A working demo needs the last step. We fixed coordinate validation, mobile overflow, stale statement interactions, downloads and visitor isolation. We also made the difference between a demonstration draft and a real legal declaration explicit.
Accomplishments that we're proud of
We connected the full journey: field message, map, satellite evidence, blocked shipment, remediation and downloadable draft.
The app does not only show successful cases. It includes real forest-loss examples, unresolved data quality, and unavailable-source handling. A reviewer can inspect why the system reached a result.
We also kept the cooperative in the product. The person who grows the cocoa deserves a clear explanation, not just a red row in someone else's dashboard.
What we learned
A useful environmental tool needs both careful measurement and understandable decisions. More datasets do not automatically produce a better answer. Their dates, resolution, missing coverage and disagreements matter.
We learned to keep AI inside a narrow, testable boundary. Reading messy prose is helpful. Inventing missing coordinates is not.
We also learned that transparency is part of completion. Satellite screening cannot verify land rights, labour conditions or every legal obligation. A hash chain can reveal changes within its record, but production audit records also need durable storage and an independently retained anchor.
What's next for Plotline
Our next step is validation with cocoa cooperatives and field agents. We want to compare boundaries with field measurements, test whether the explanations are useful, and measure the time saved.
For production, we would add authenticated cooperative workspaces, durable storage, document upload and review, independent audit anchoring, scheduled re-screening, and a tested connection to the official submission system.
Plotline currently prepares demonstration drafts. It does not certify compliance or submit declarations to EU authorities. Mitigation checkboxes simulate document review and are not evidence themselves.
Build timeline
All project implementation was built during NextStep Hacks 2026, after the hackathon began. There was no pre-hackathon implementation.
Try it
Testing instructions
No login or API key is needed. Start at the guided demo.
- Open the cooperative view and switch French and English.
- In Ingest, load the sample and extract five plots. Check that 18 cocoa bags become 1,170 kg, then download GeoJSON.
- Open the importer workspace, filter the three disqualified plots, and inspect a plot's satellite evidence.
- Open Due diligence statement. It starts blocked. Exclude CPO-0017, CPO-0018, CPO-0019 and CPO-0024, then tick the three simulated evidence-review boxes.
- Confirm the demo draft has 20 plots and about 31.10 tonnes. Download the bundle and inspect the updated audit ledger.
- Use Verify a plot to run a fresh check on either sample location. Public archives can be slow; missing imagery is disclosed.
Detailed testing instructions include expected results and limitations.
Built With
- firebase
- geotiff
- google-cloud
- maplibre
- next.js
- openai
- react
- sentinel-2
- turf.js
- typescript

Log in or sign up for Devpost to join the conversation.