-
-

Top Artists over different time ranges
-

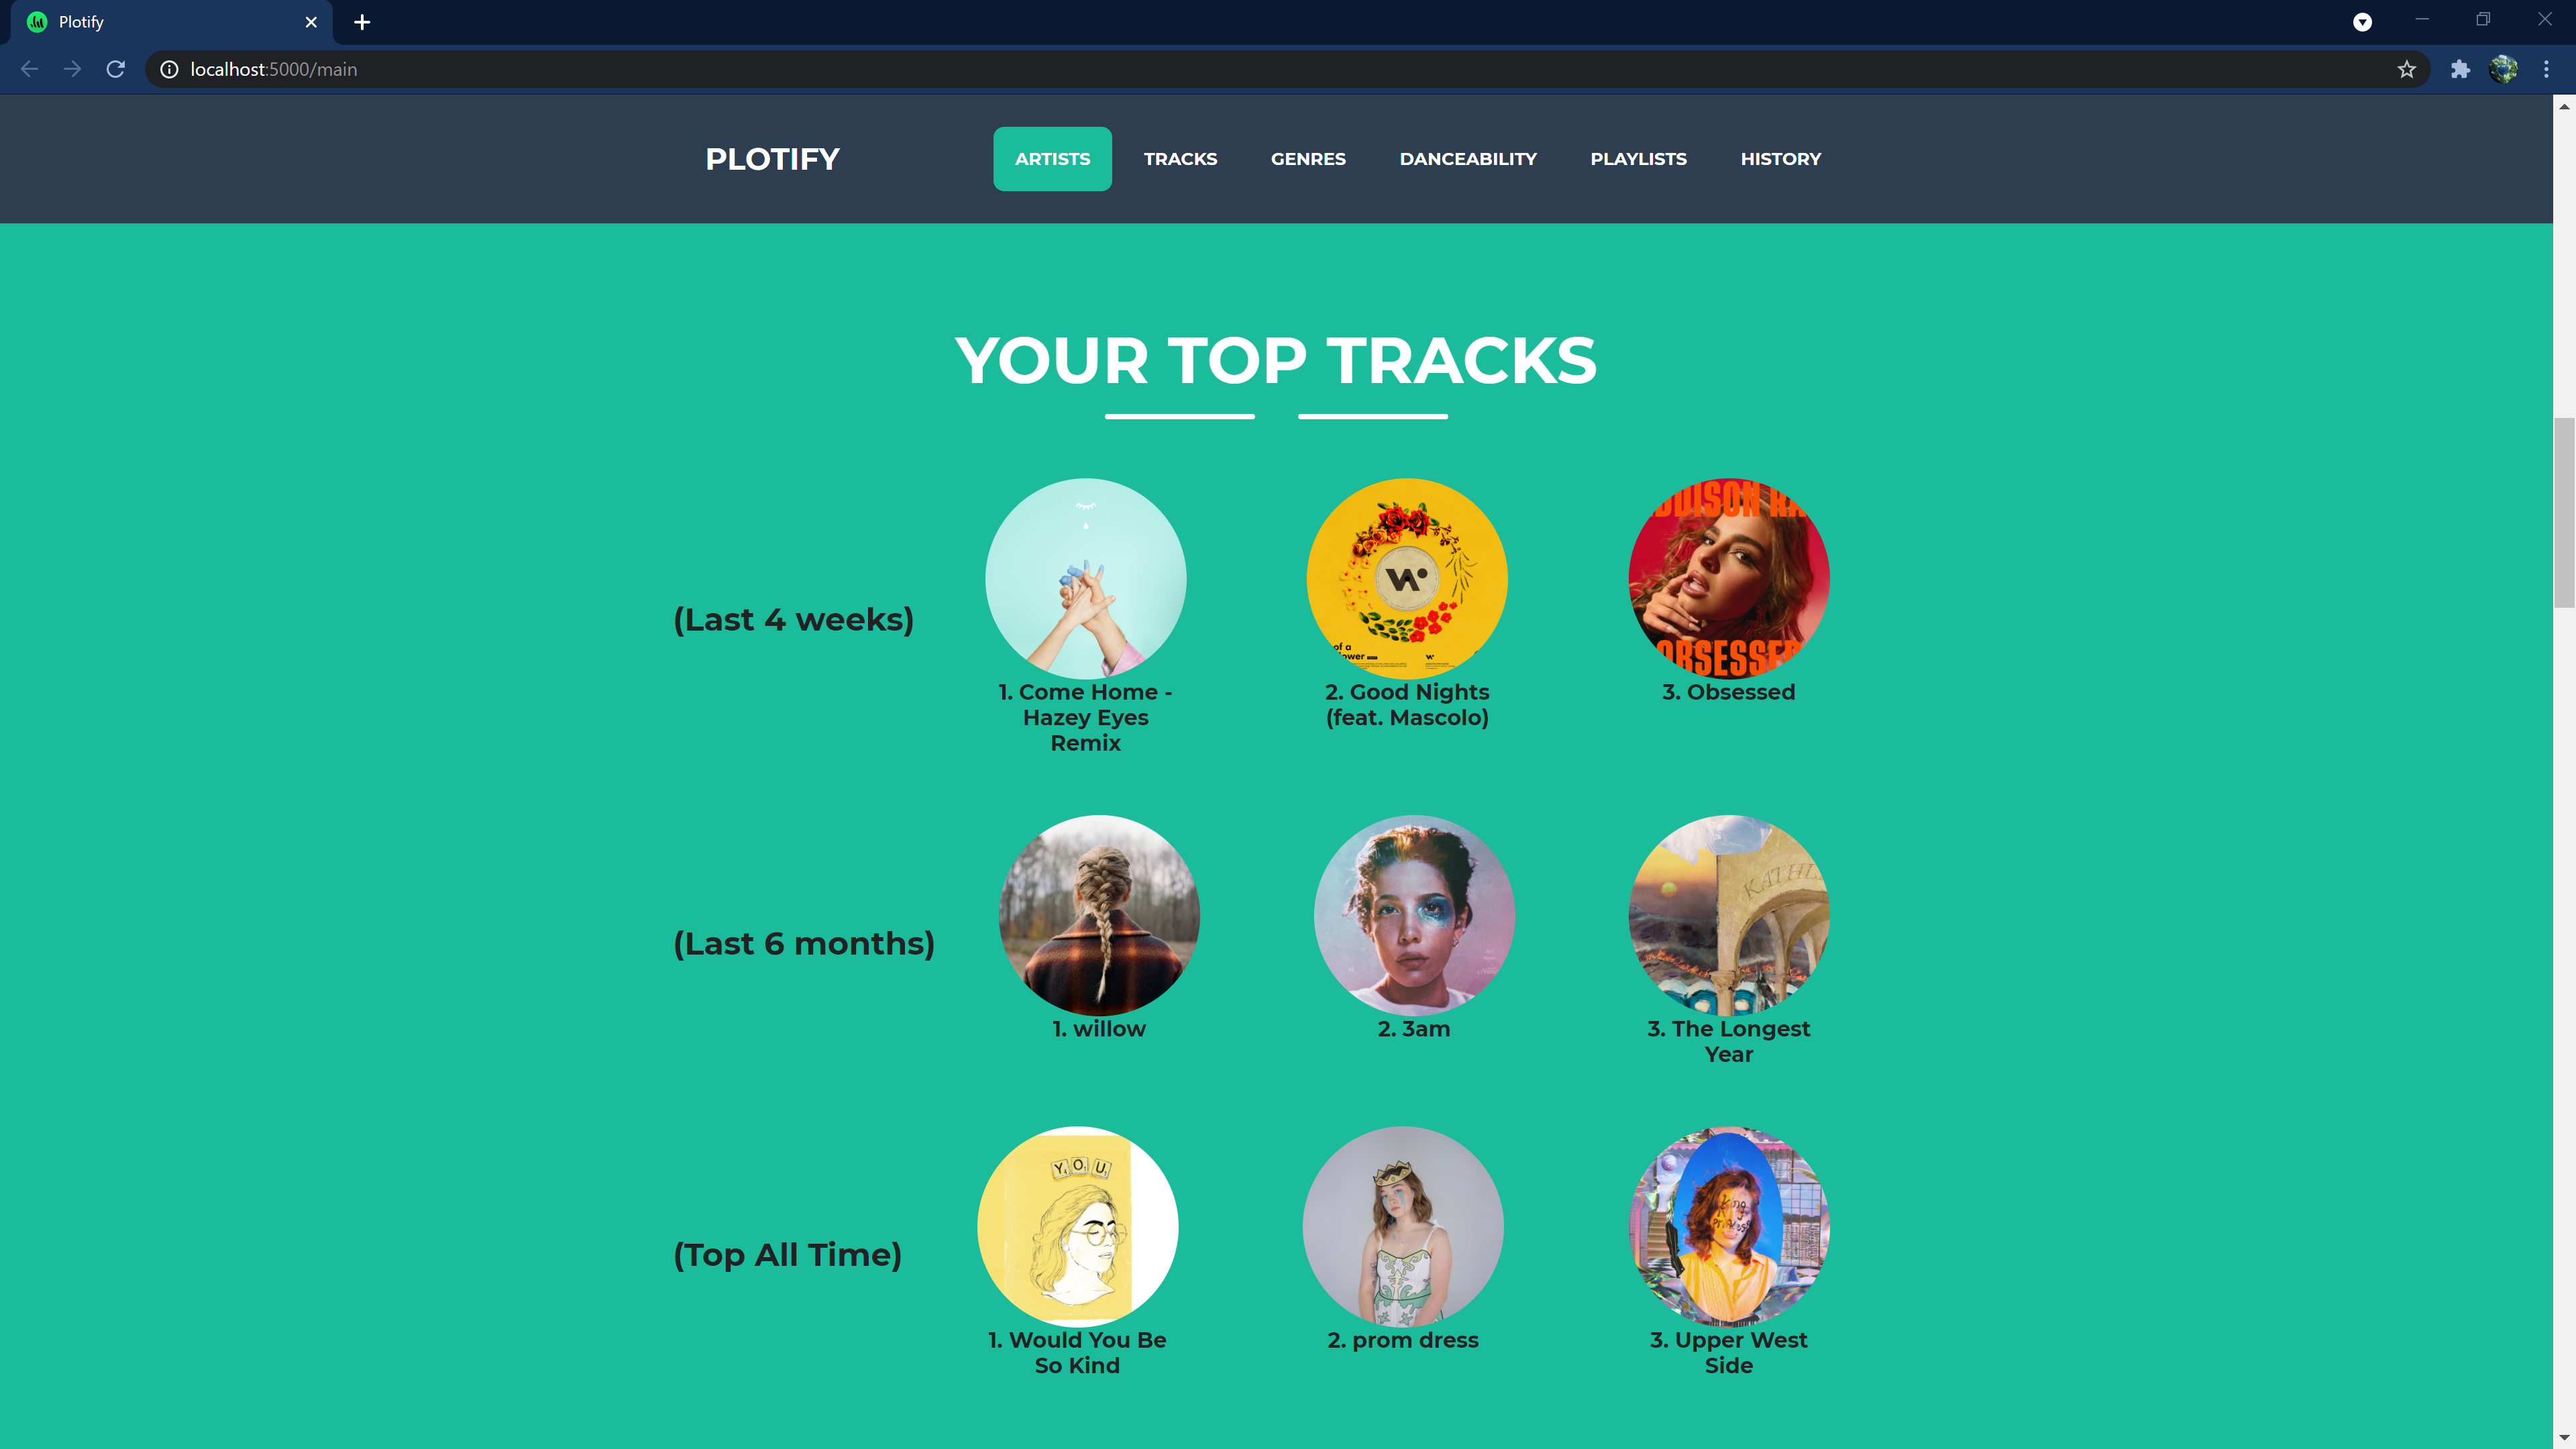
Top Tracks over different time ranges
-

Bubble chart of genre frequency in top tracks
-

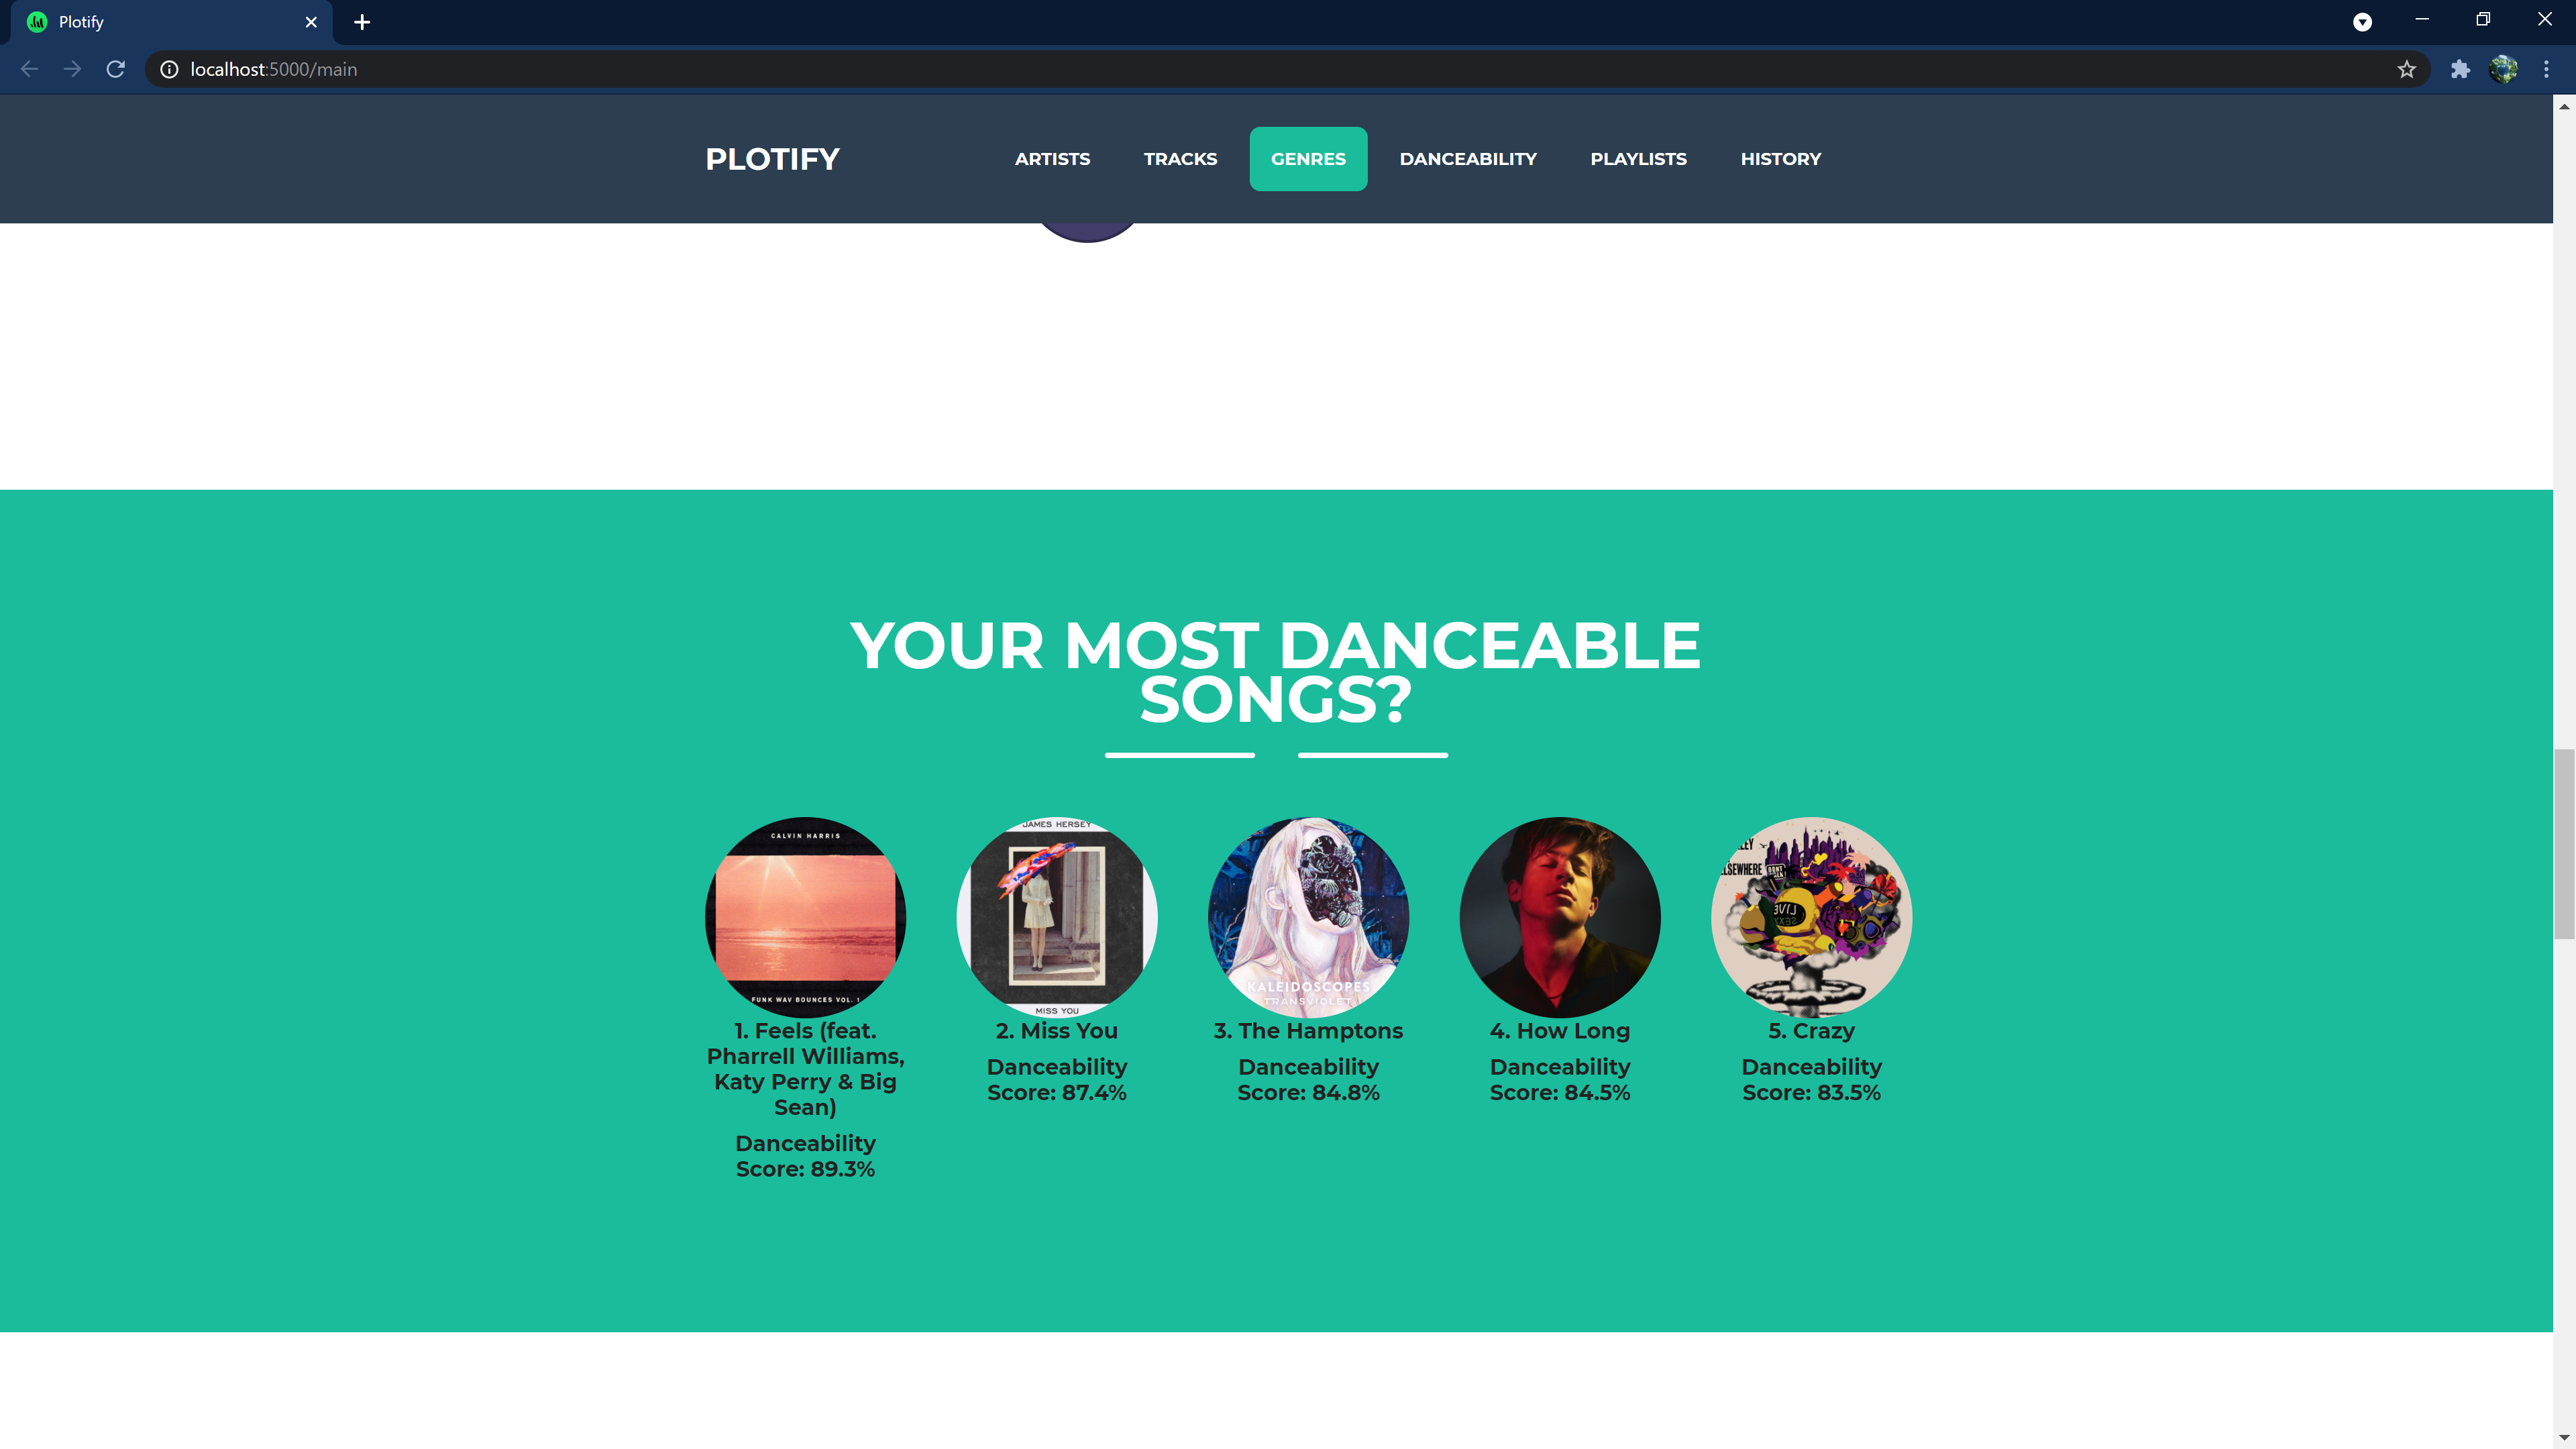
Songs with highest danceability
-

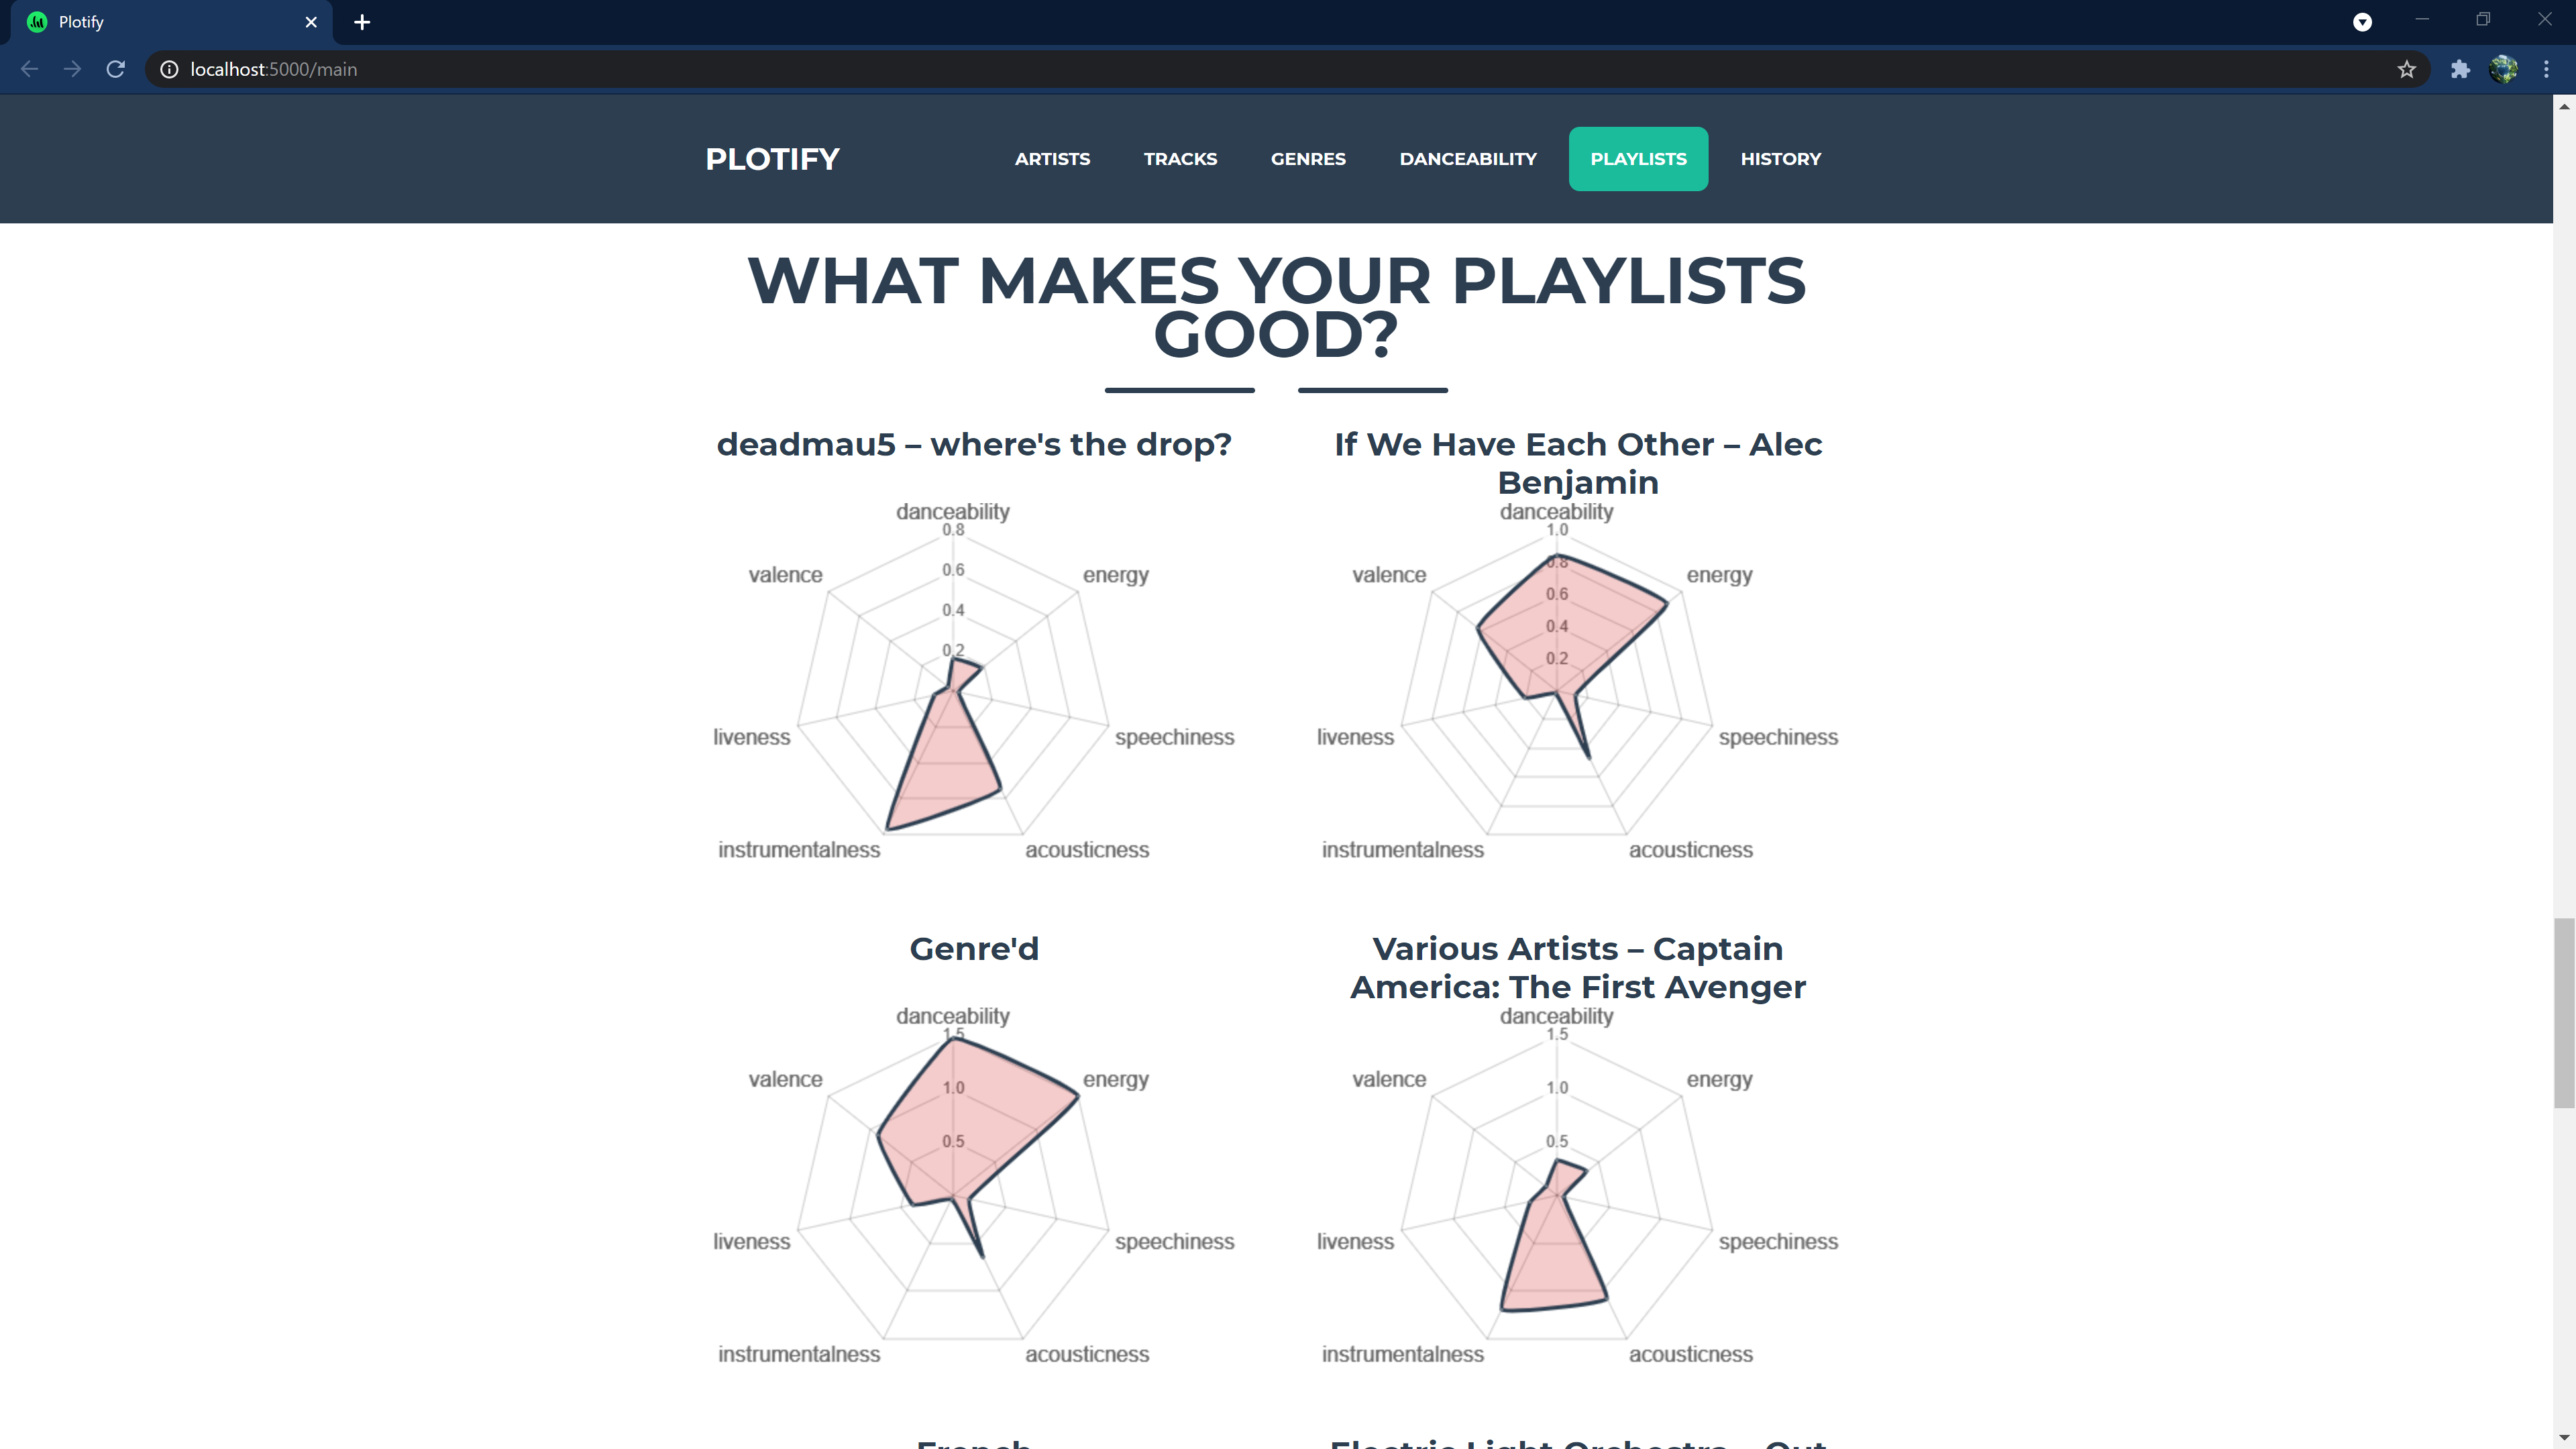
Radar plot of average playlist metrics
-

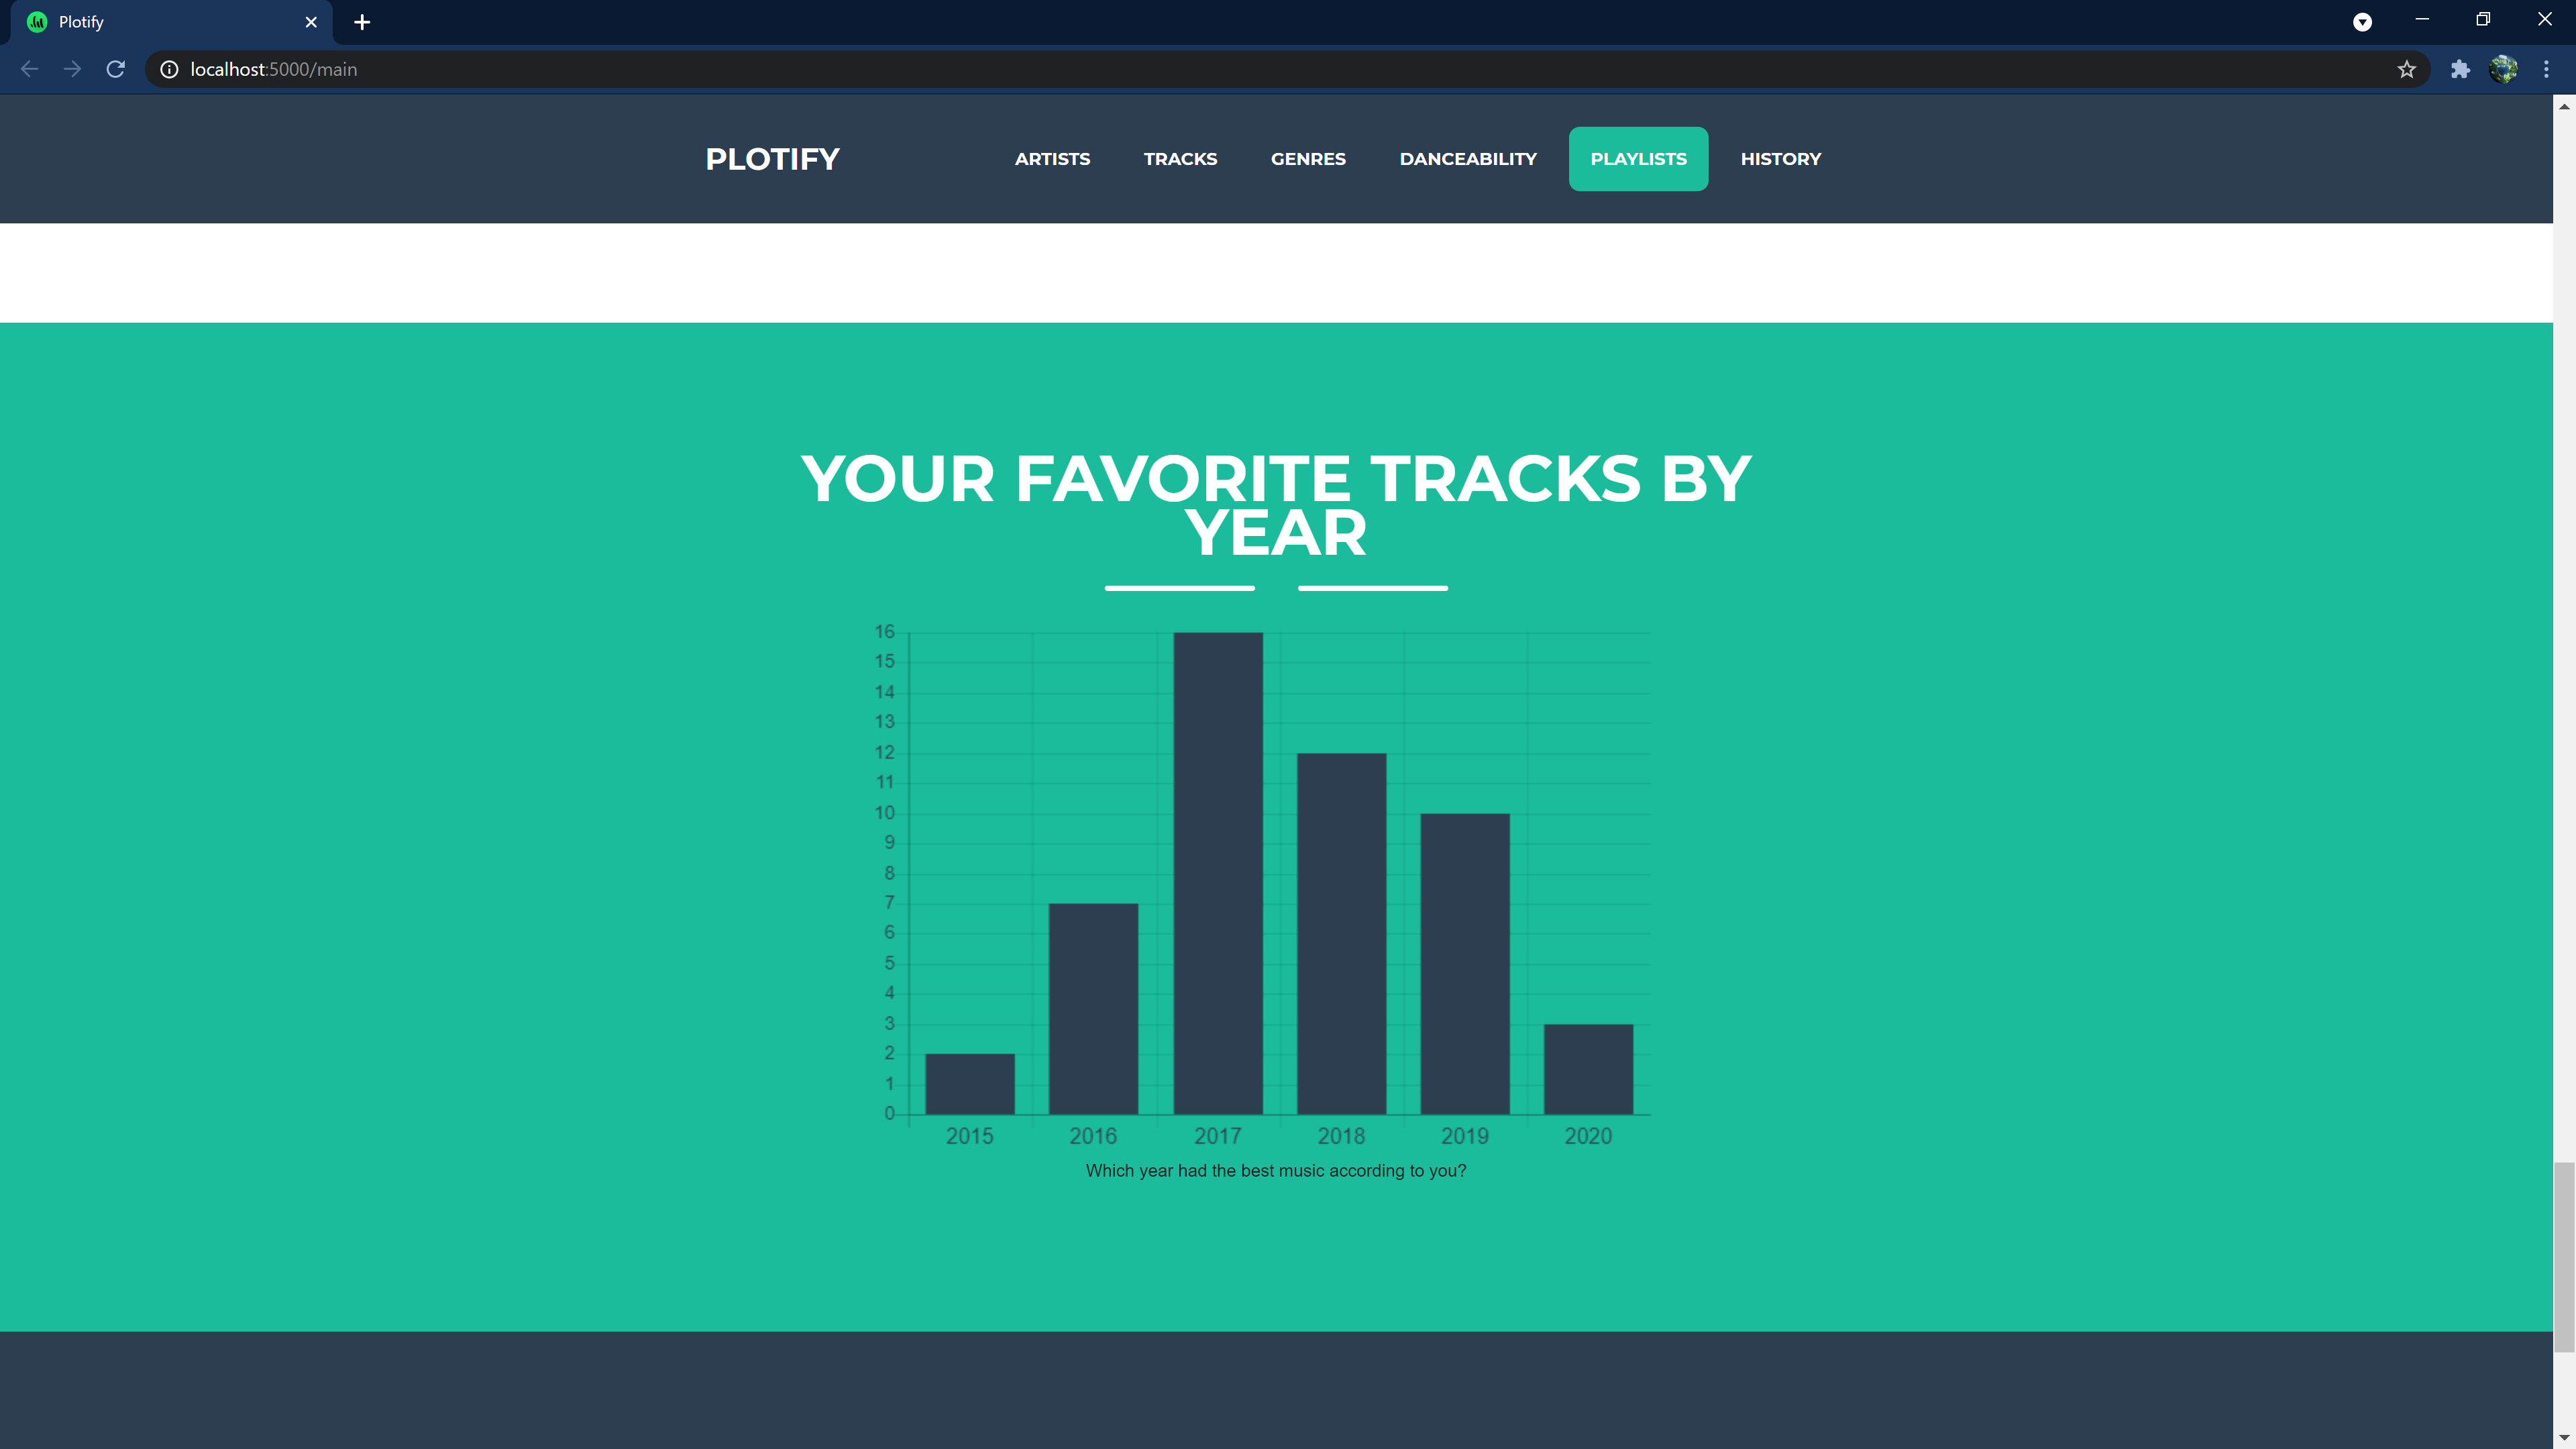
Histogram of top 50 tracks


Inspiration
I always like going through my spotify wrapped but some years it has been underwhelming since I can often guess who my top artists were for the entire year. I wanted to experiment with javascript libraries and the spotify API seemed like it had enough data to work with.
What it does
Plotify lets users authorize their spotify accounts and displays relevant information about their top artists, tracks, genres, playlists and more.
How I built it
I developed this app with flask and python scripting as the backend. I'm running authorization through a python utility for handling api tokens, and storing api call results in json. Plotting was done using both D3 and chart.js
Challenges I ran into
I've used flask several times before, but there was a significant time crunch with troubleshooting the charting libraries and trying to wrangle and filter enough data to make meaningful visualizations.
Accomplishments that I'm proud of
In the end, I'm very satisfied with the result. It's not highly sophisticated, but the original spotify wrappeds weren't either. I'm confident there's at least one thing that everyone could find interesting, whether a new genre they didn't know they liked, or realizing that they often prefer older music.
What I learned
I learned that 24 hours isn't very much time to get something polished and that even the nicest looking API documentation still has its kinks to solve.
What's next for Plotify
In the future, I'd like to take advantage of the streaming data that you can request from Spotify and allow users to upload their listening history directly to the site. Having years worth of data could make for some very interesting visualizations with how music preferences shift over time.


Log in or sign up for Devpost to join the conversation.