Inspiration
What it does
How we built it
Challenges we ran intoInspiration
Football matches generate a huge amount of event-level data, but raw data can be difficult to understand quickly. We wanted to build a platform that could turn these events into meaningful, visual insights — especially identifying when a match changed and why that period mattered.
This inspired us to build PlayPulse, a football analytics platform using StatsBomb Open Data.
What We Built
PlayPulse takes StatsBomb match-event data and transforms it into an interactive analytics dashboard.
The platform provides:
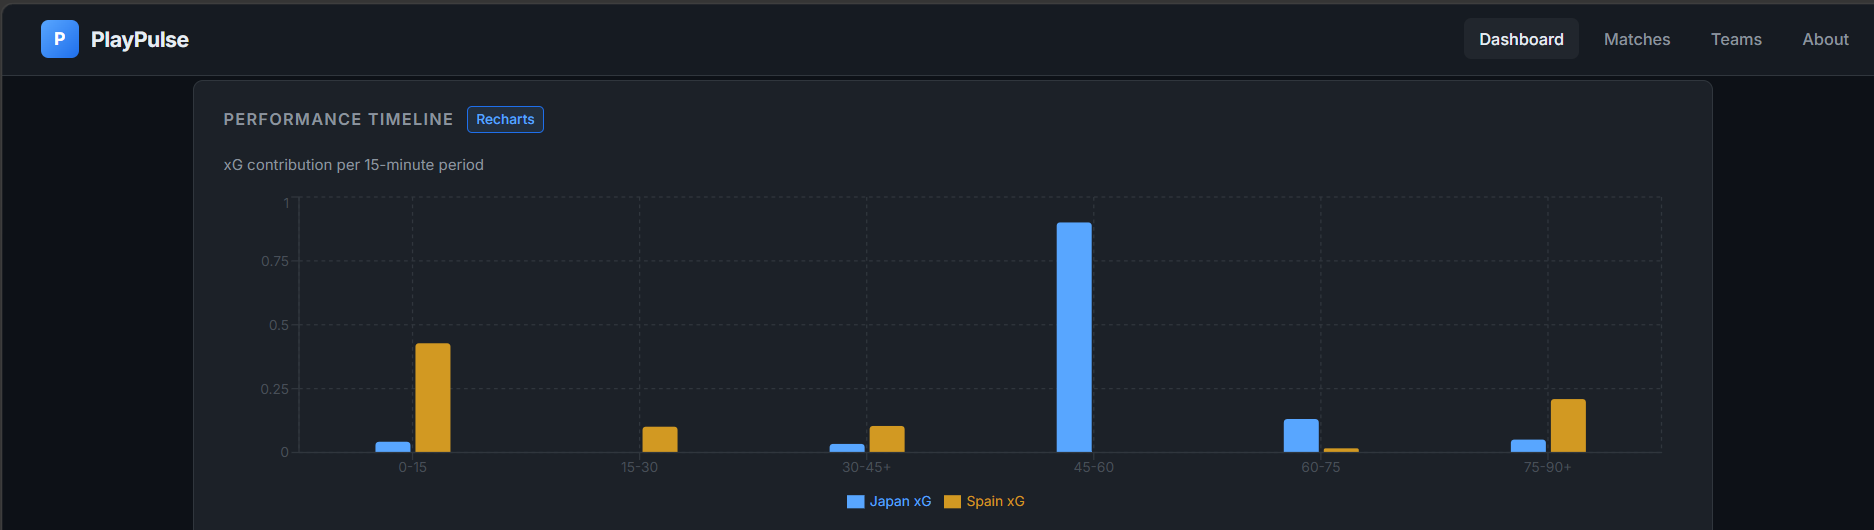
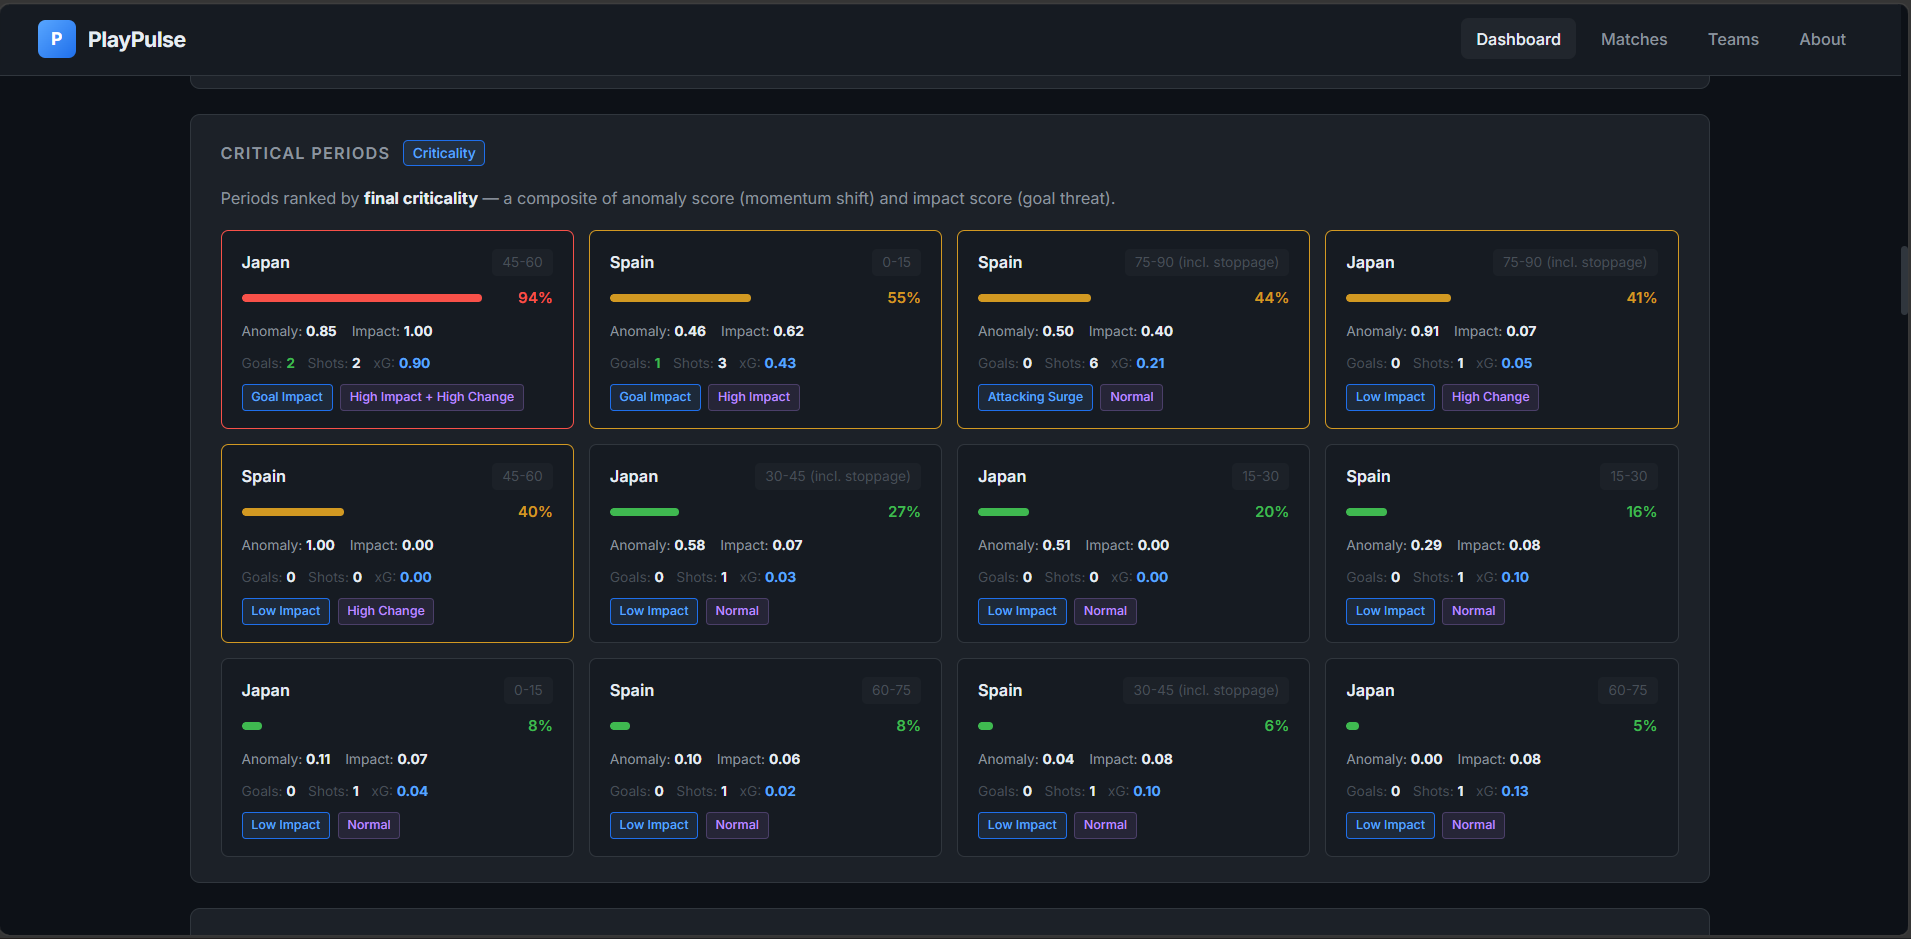
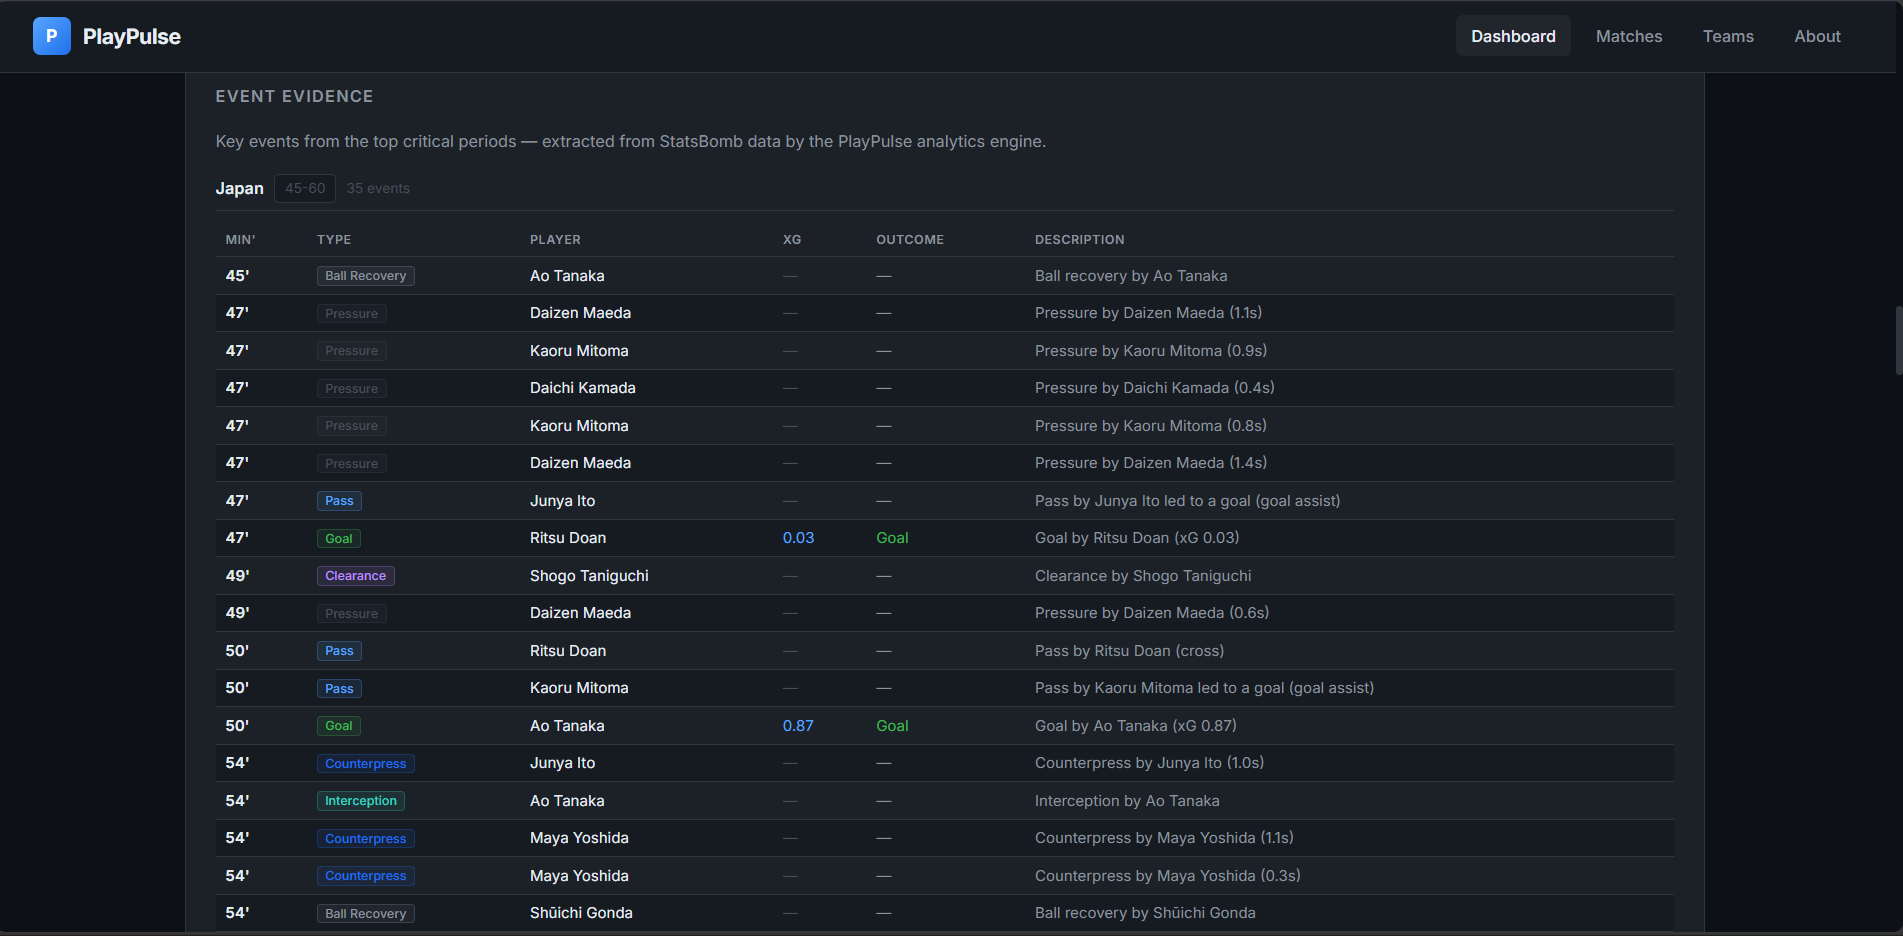
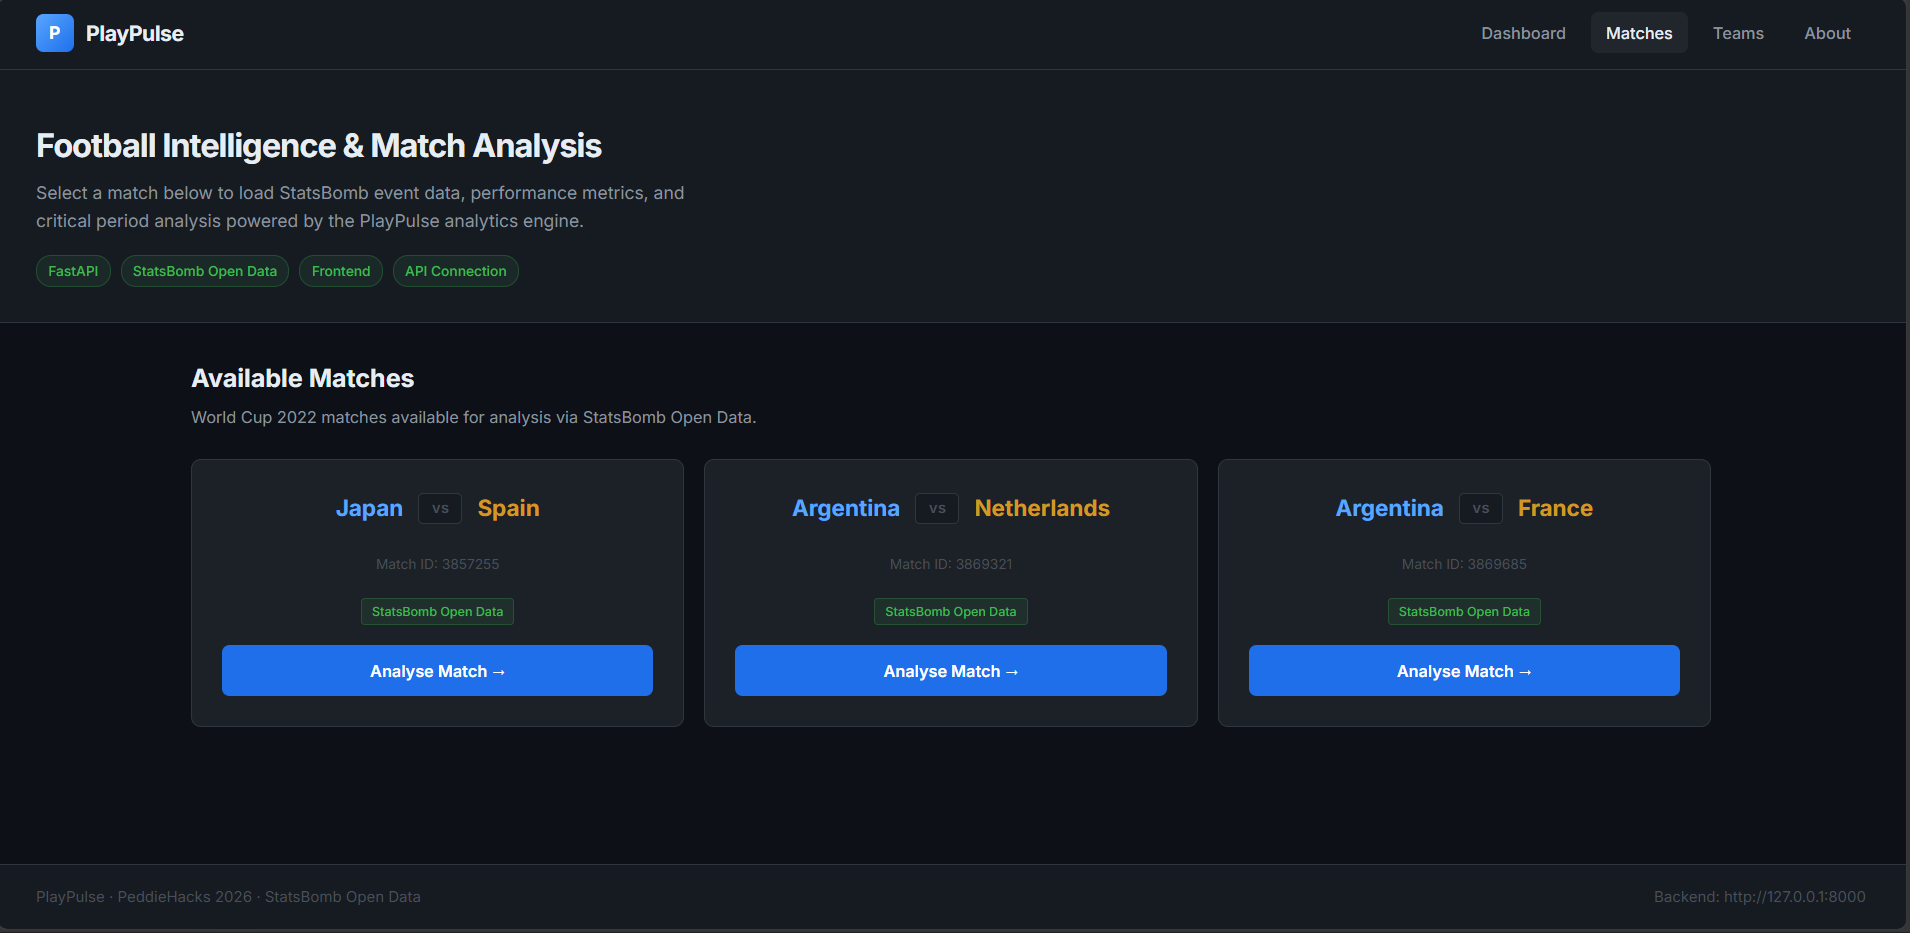
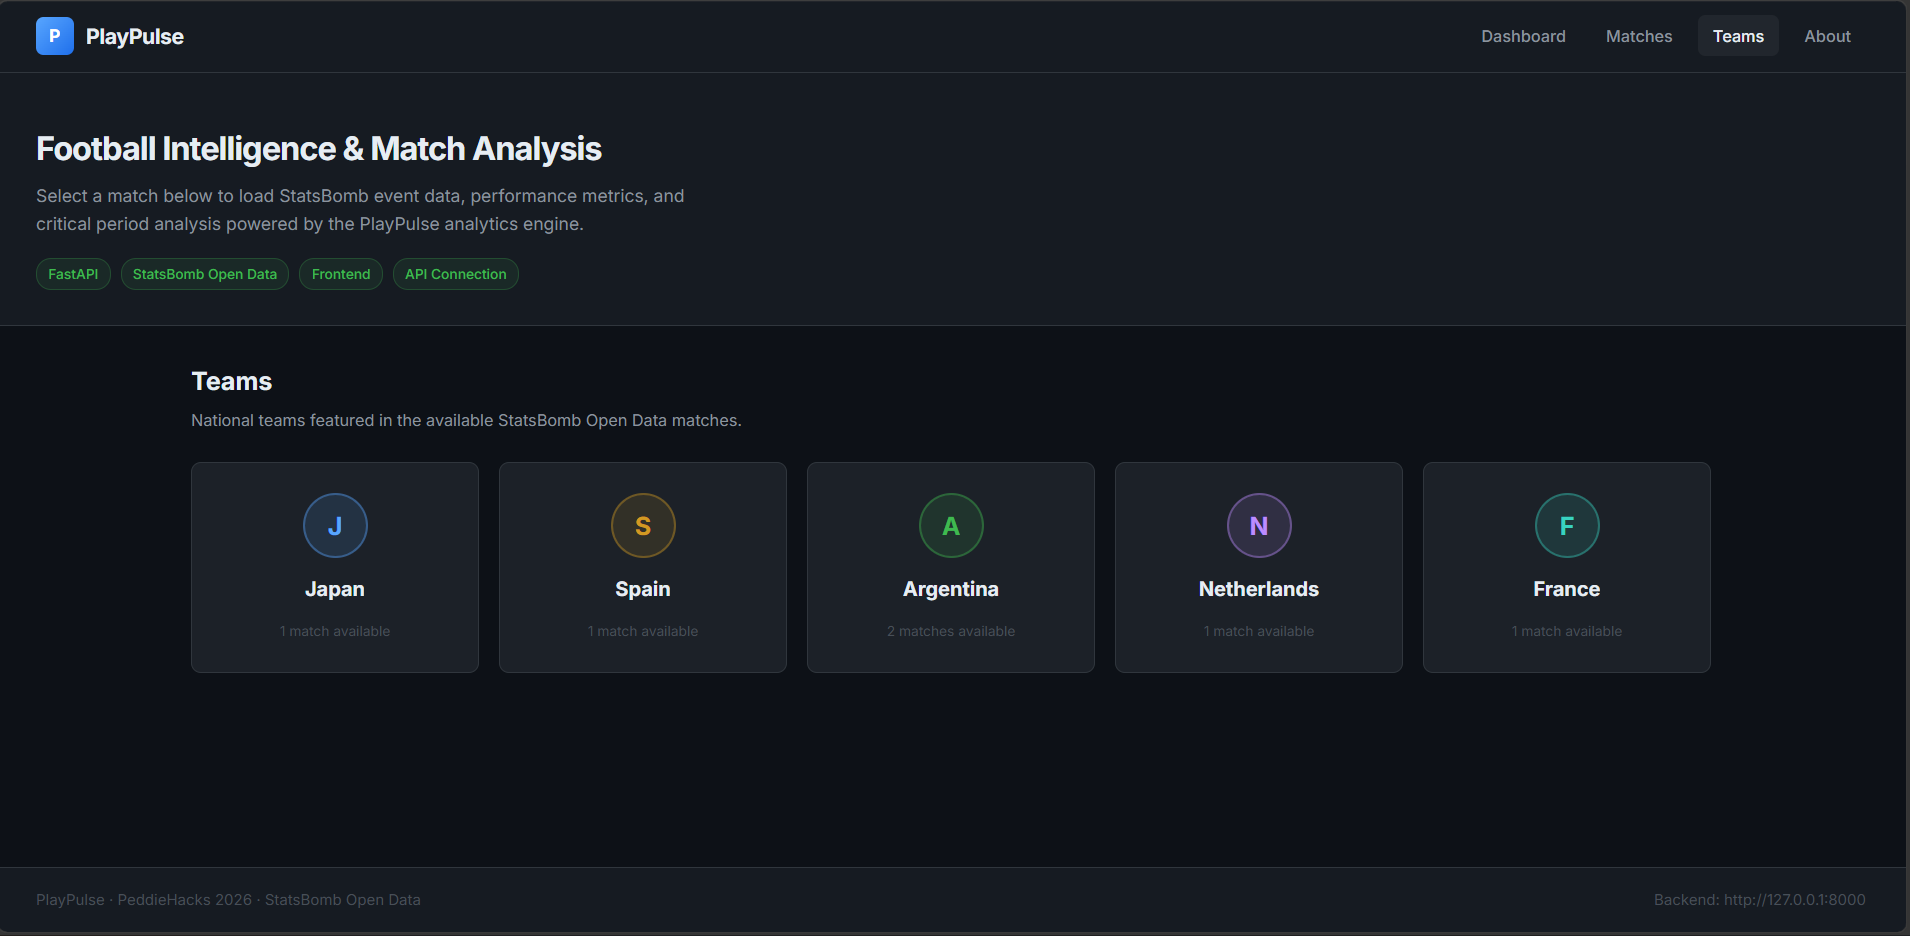
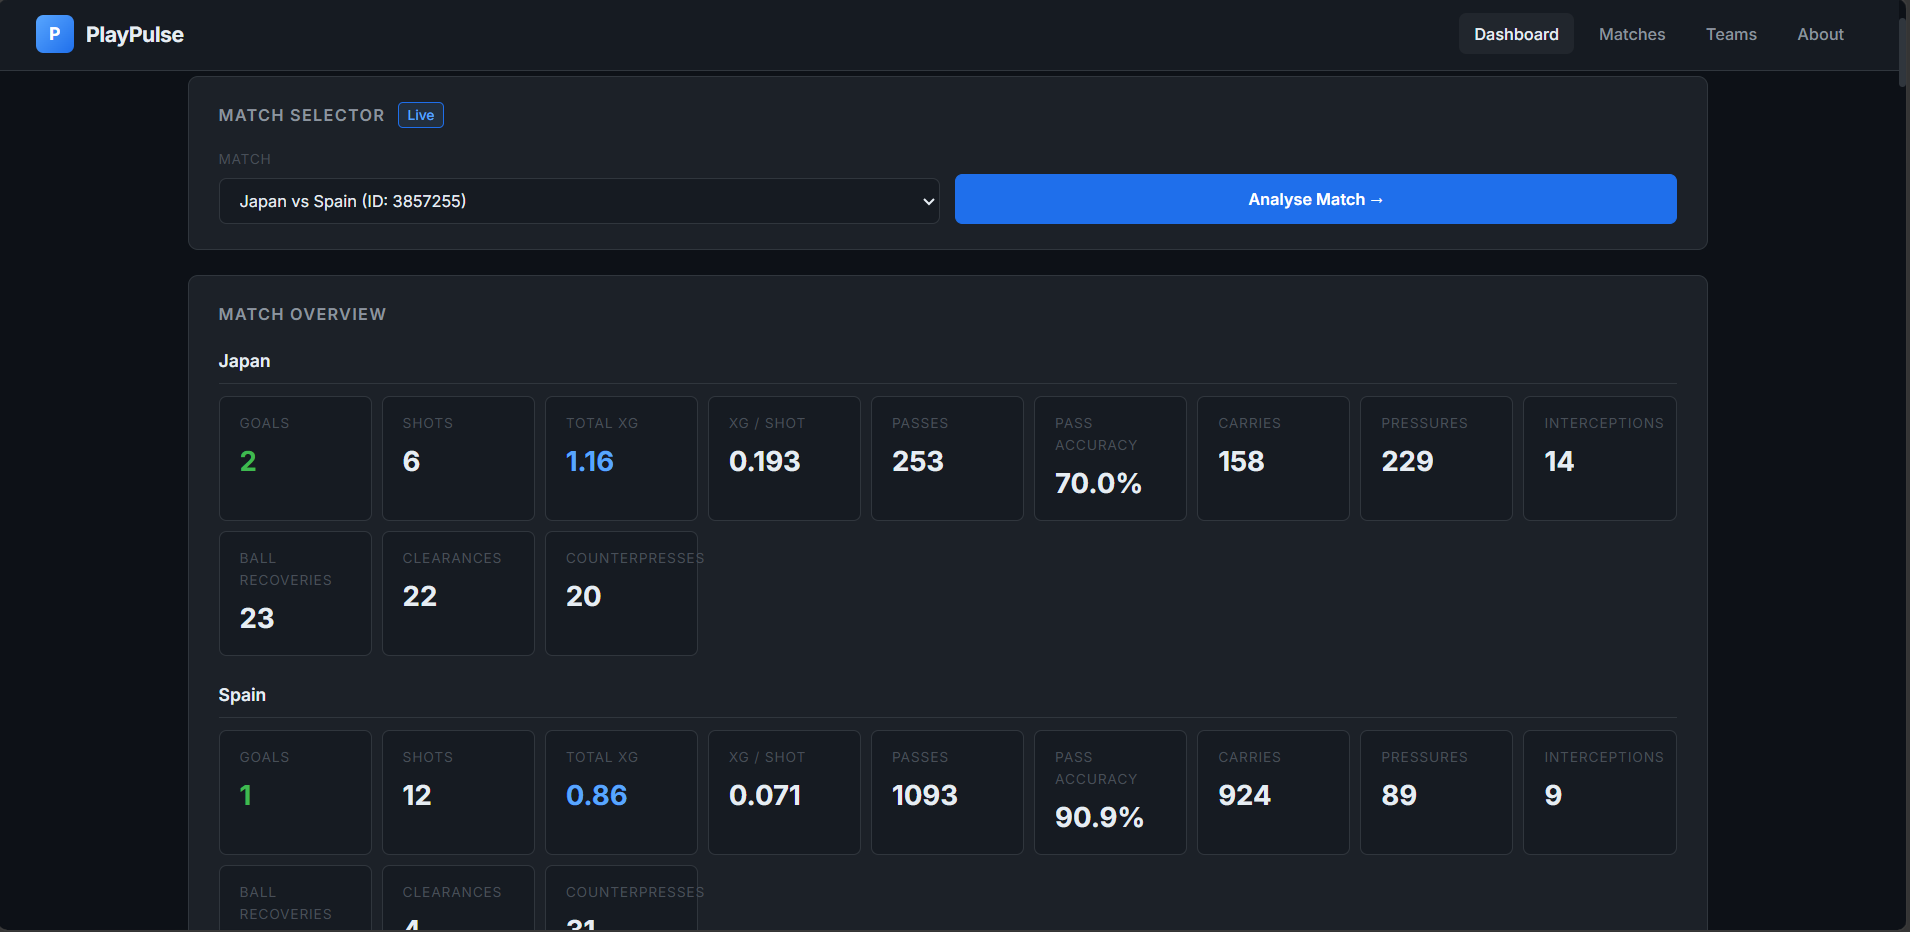
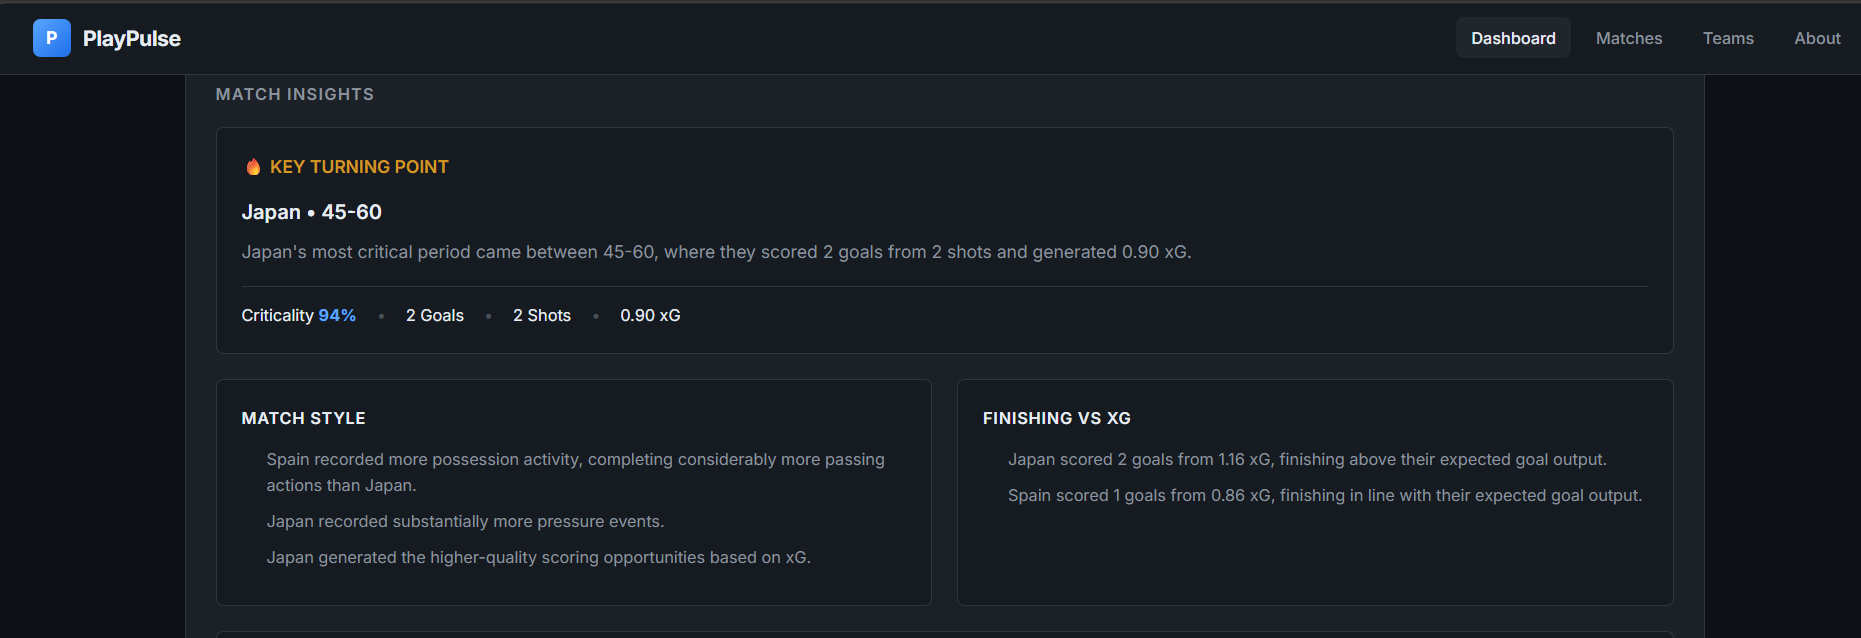
Match Selector — Select and analyse available matches. Match Overview — Goals, shots, xG, passes, pass accuracy, pressures, interceptions, carries, and other metrics. Performance Timeline — Breaks match performance into 15-minute periods and visualises xG and other metrics. Critical Periods — Identifies the most important periods using anomaly and impact scoring. Event Evidence — Shows the events supporting important periods, including goals, shots, pressures, interceptions, and other events. Match Insights — Converts the calculated metrics into readable, deterministic observations. Matches, Teams, and About pages — Provides additional navigation and project information. How We Built It
The backend was built using Python and FastAPI. StatsBomb JSON event data is processed and normalised before being passed through our analytics modules.
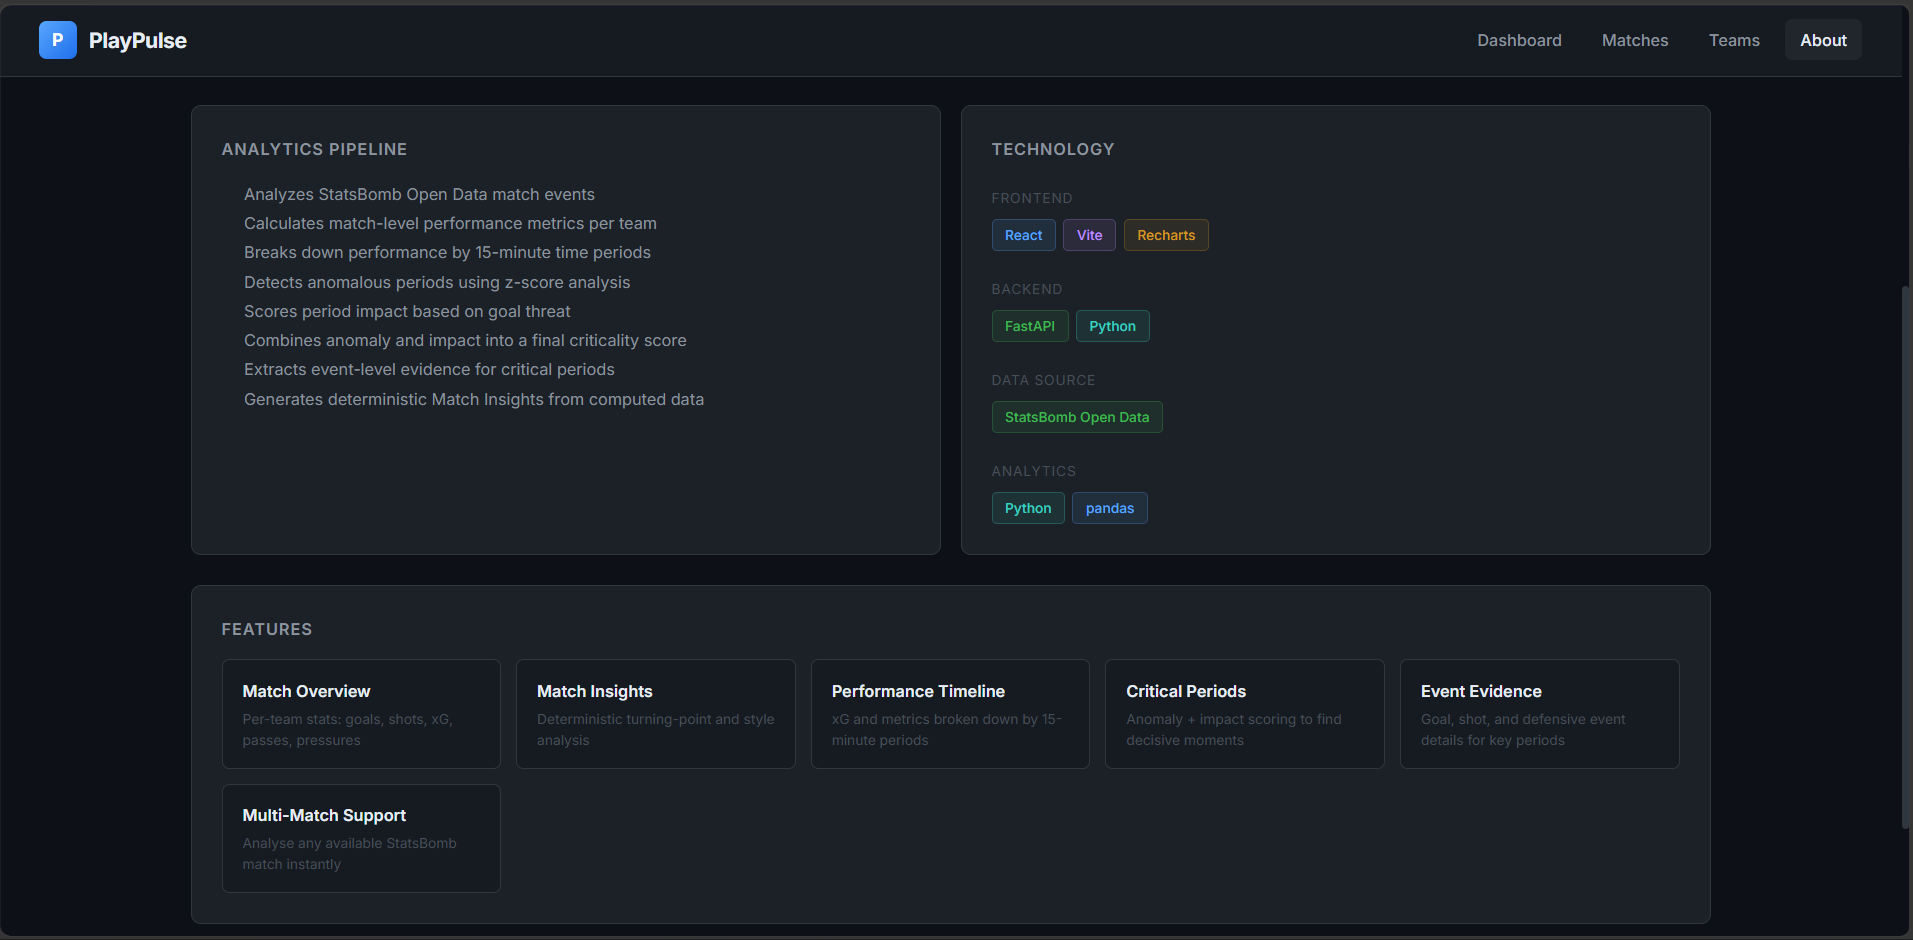
The analytics pipeline calculates:
Match-level metrics 15-minute period metrics Anomaly scores representing momentum changes Impact scores representing goal threat Final criticality scores Supporting event evidence
The frontend was built using React, Vite, and Recharts. It communicates with the FastAPI backend through REST APIs and dynamically updates when a different match is selected.
The criticality calculation is performed in the backend rather than being duplicated in the frontend. This keeps the analytics consistent and transparent.
What We Learned
Building PlayPulse helped us understand how to move from raw event data to an end-to-end analytics product.
We learned about:
Processing real-world football event data Designing analytics pipelines Building REST APIs with FastAPI Connecting React applications to backend APIs Creating time-based visualisations Designing deterministic scoring systems Handling API errors, CORS, and frontend state Keeping frontend and backend responsibilities separated Turning numerical analytics into understandable insights
One important lesson was that good analytics is not only about calculating numbers — it is also about presenting those numbers in a way that people can understand and act on.
Challenges
One of our biggest challenges was connecting the different parts of the application reliably.
We had to make sure that changing the selected match updated the overview, timeline, critical periods, event evidence, and insights without leaving stale information from the previous match.
We also had to handle:
StatsBomb event-data structure Different match periods and stoppage-time labels Backend API integration CORS configuration Loading and error states Consistent response structures between backend and frontend Git and project organisation
Accomplishments that we're proud of
What we learned
What's next for Play Plus
Built With
- analysis
- analytics
- api
- data
- fastapi
- football
- html
- javascript
- pandas
- python
- react
- recharts
- rest
- sports
- statsbomb
- visualization
- vite

