Inspiration
We were inspired by the growing concern for urban environments and the desire to create more sustainable and resilient cities. We saw an opportunity to empower individuals to actively contribute to their local ecosystems by providing easy-to-use tools for understanding and enhancing tree canopy coverage.
What it does
PLANTrees is a user-friendly web application that leverages advanced satellite imagery and geographic information systems (GIS) to:
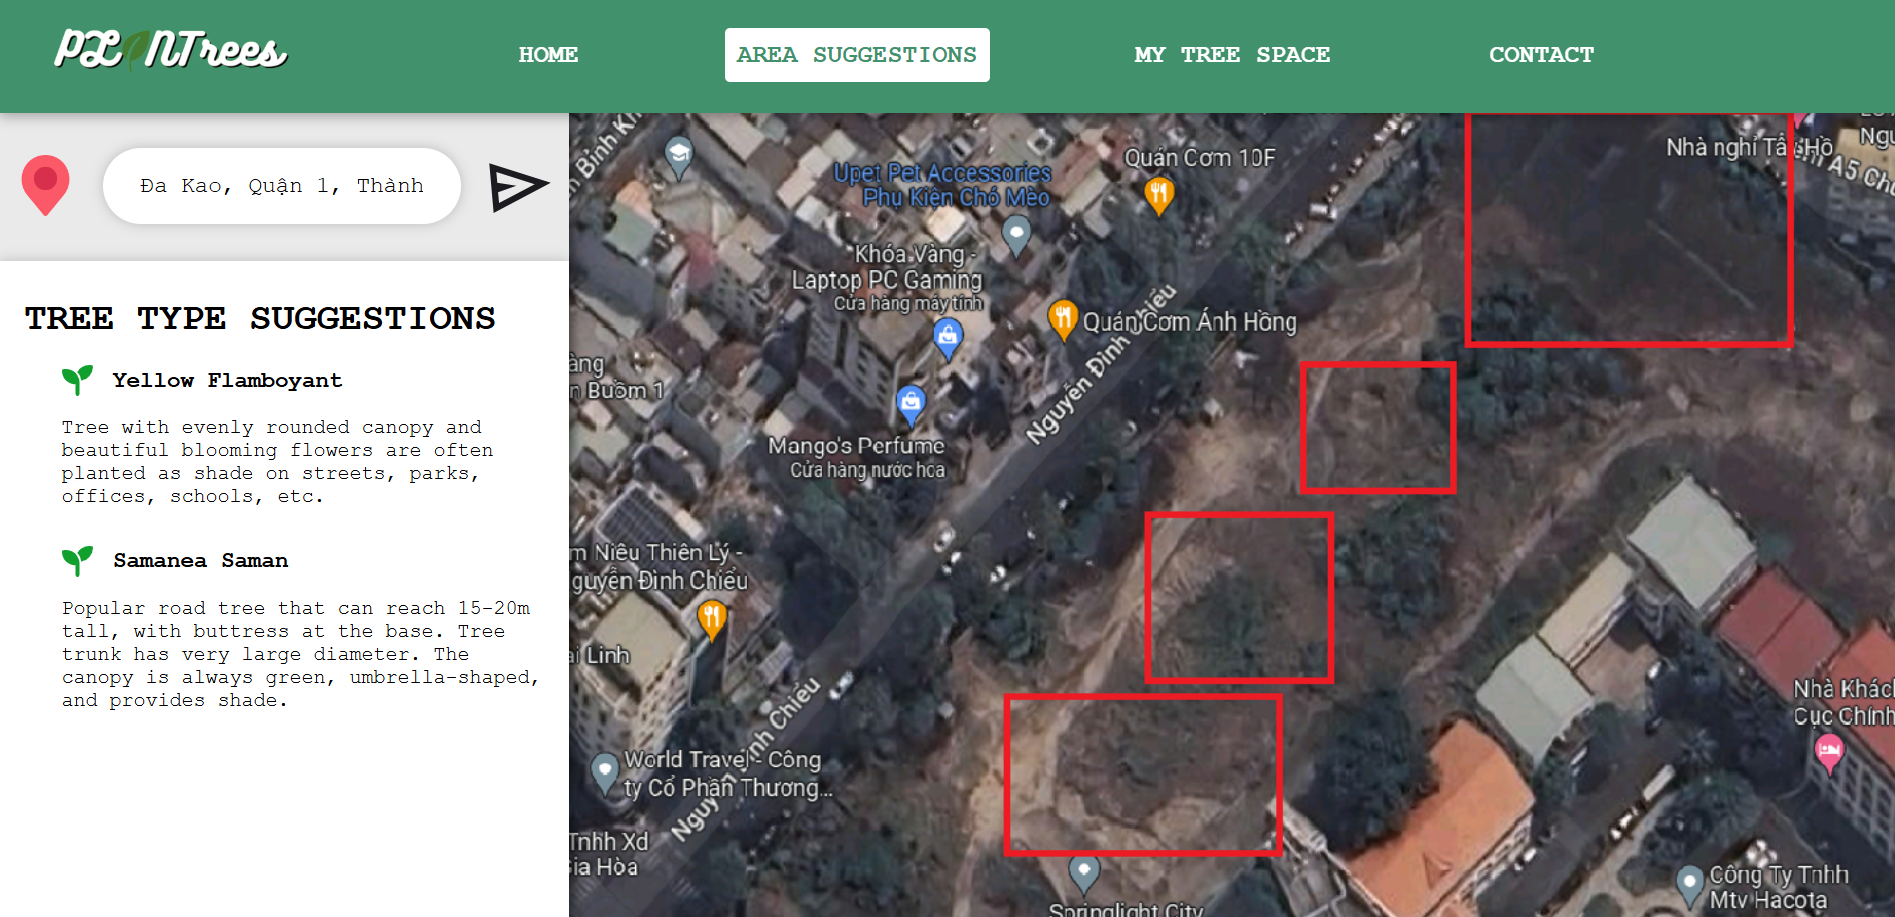
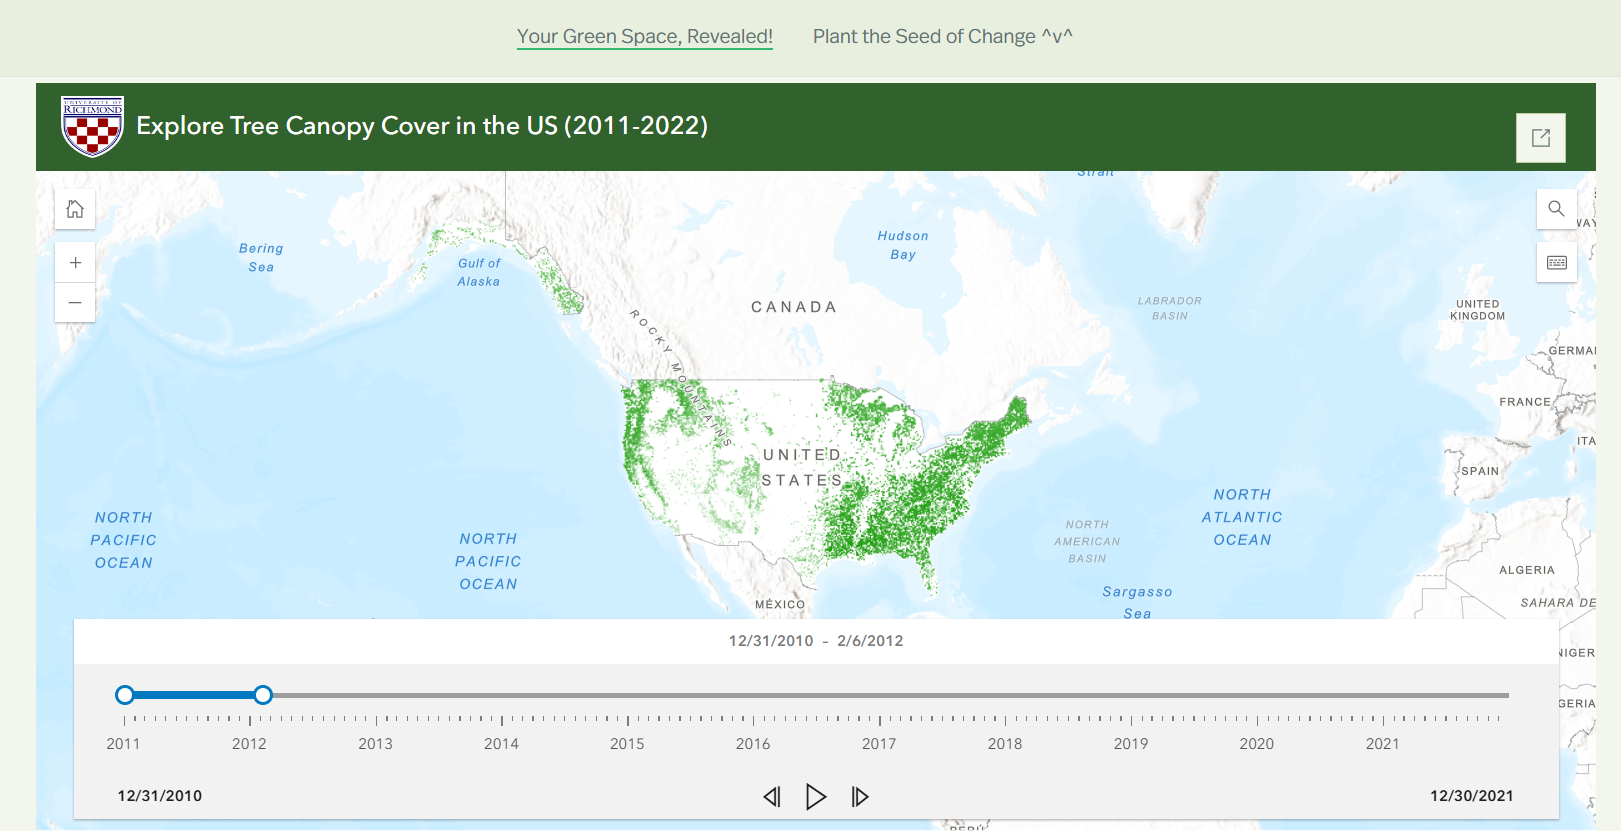
- Visualize Tree Canopy Coverage: Users can explore interactive maps of their neighborhood to see the current tree canopy density.
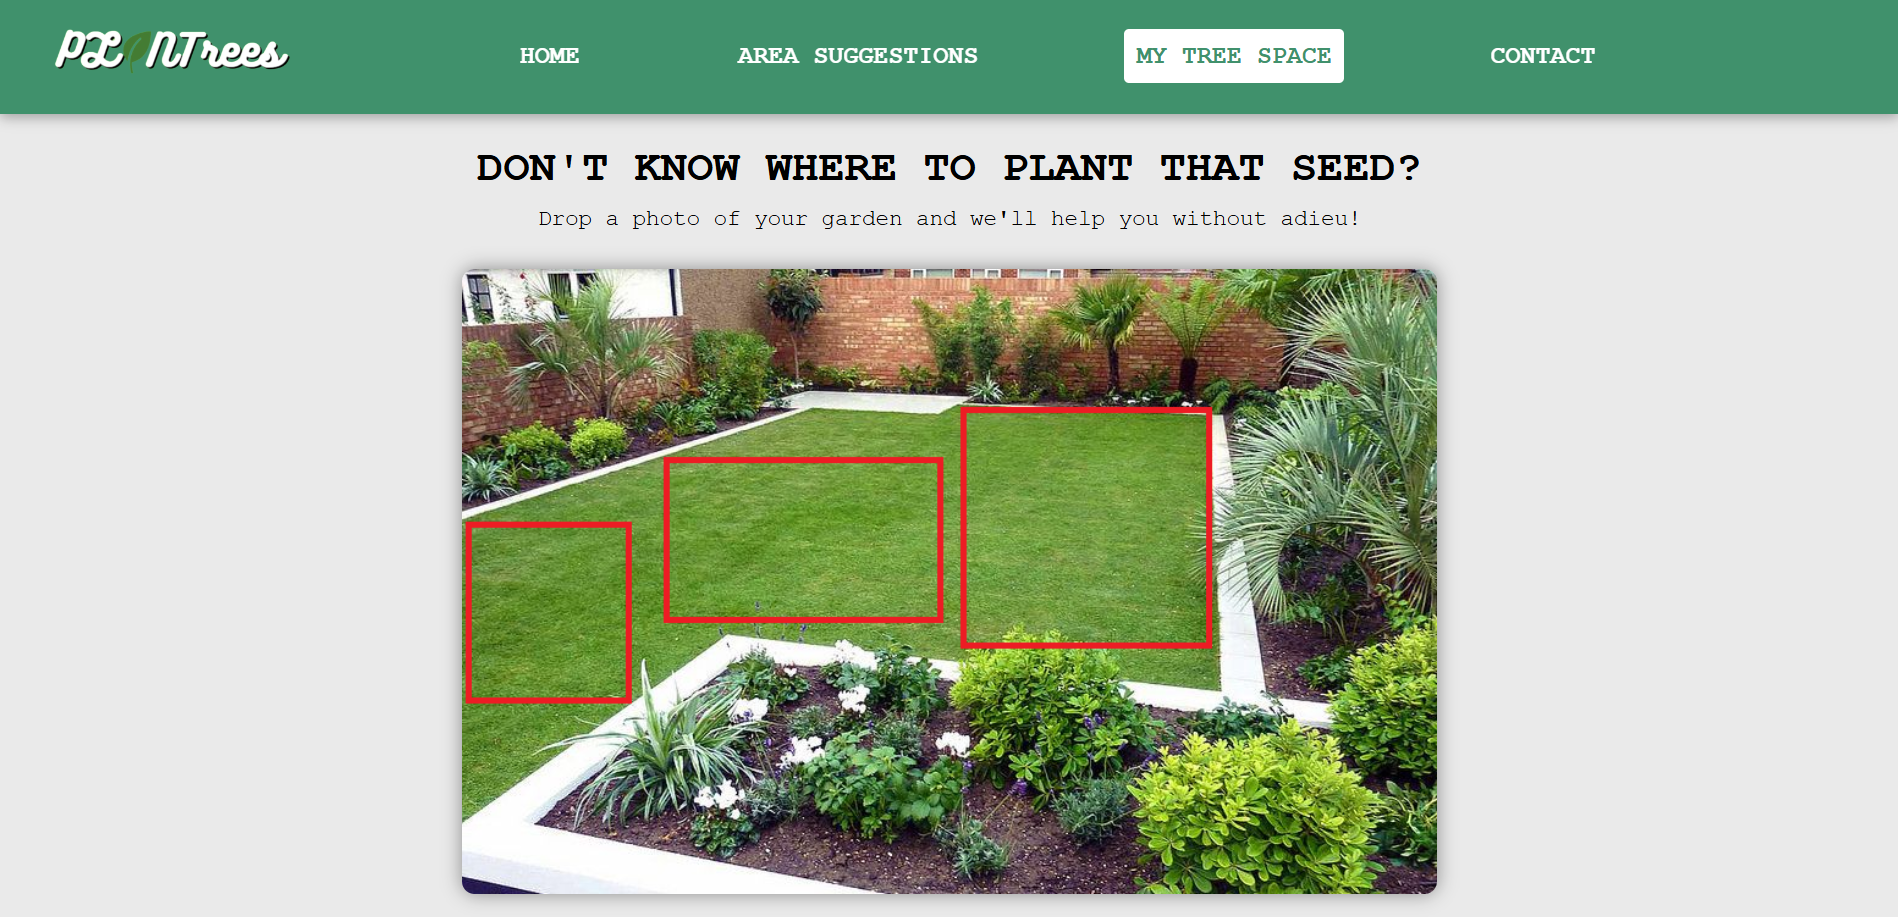
- Identify Optimal Planting Locations: Our algorithm suggests suitable locations for new tree plantings, considering factors like sunlight exposure, soil type, and proximity to infrastructure.
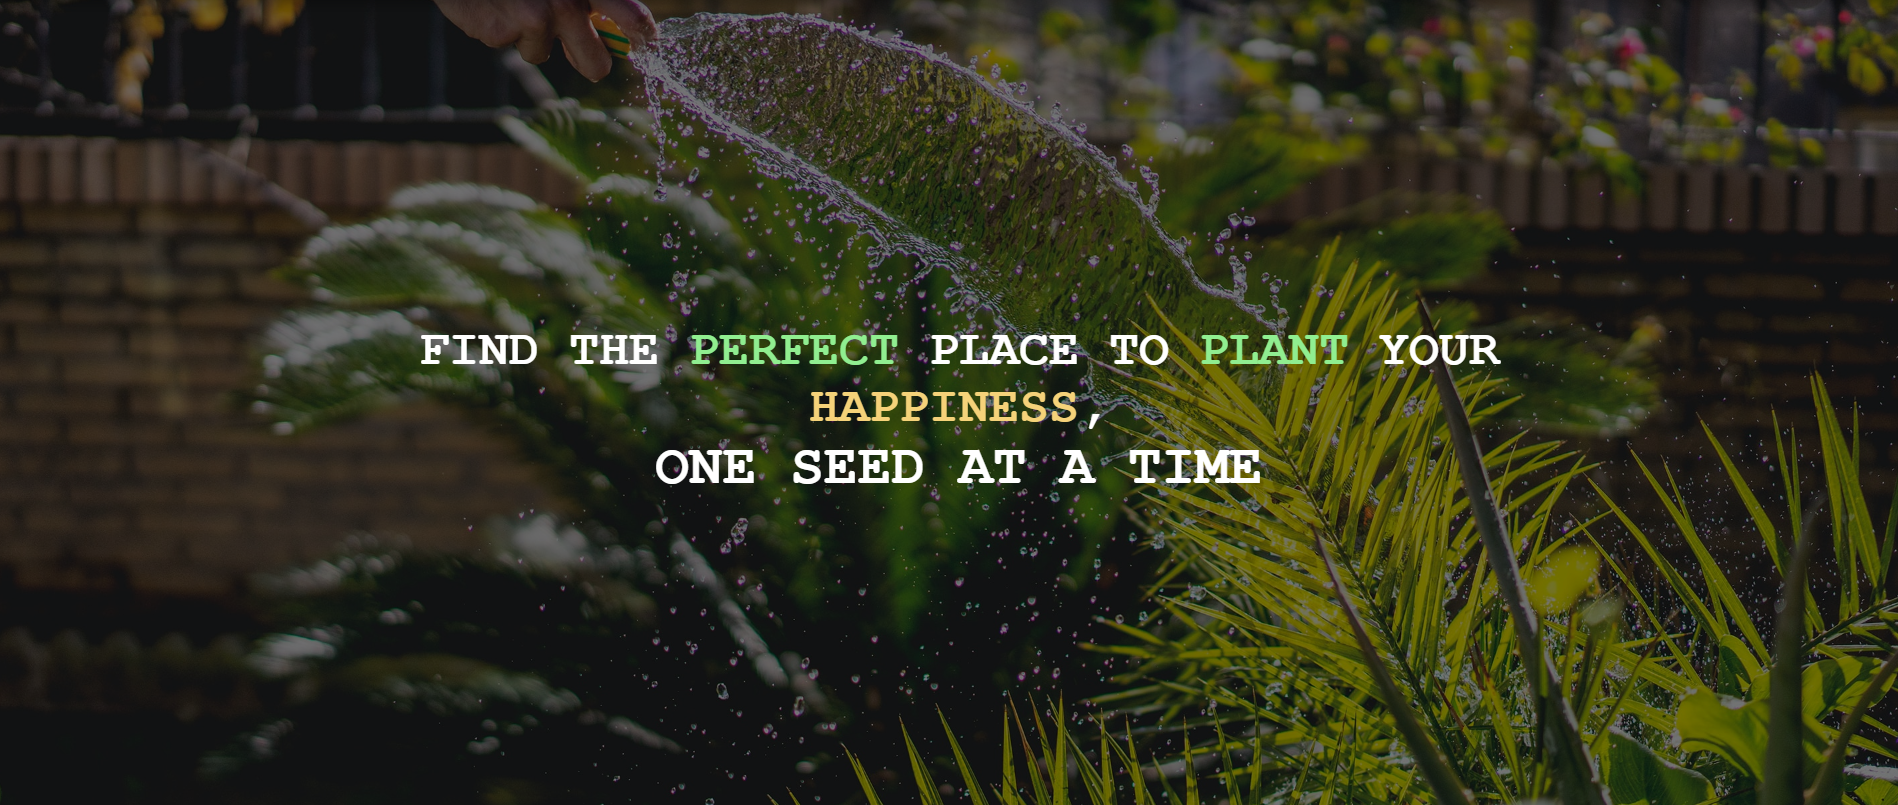
- Educate and Empower: We provide valuable information on the environmental benefits of trees, tree care tips, and the importance of community involvement in urban forestry initiatives.
How we built it
- React.js: A powerful JavaScript library for building user interfaces. It allowed us to create a dynamic and interactive experience for our users.
- HTML and CSS: The foundation of web development, used to structure and style the application.
- ESRI Web Map and Story Map: We leveraged these powerful GIS tools to visualize and explore Tree Canopy Coverage Data by ESRI. They provided interactive maps, data layers, and storytelling capabilities.
- Machine Learning: YOLOv8 model (in development) for object detection and image analysis.
Challenges we ran into
- Model Deployment: Integrating the model into a production environment and ensuring efficient inference is challenging.
- Optimizing Performance: Ensuring that the application performs well, especially when handling large datasets and complex map visualizations.
- User Experience: Designing an intuitive and engaging user interface that guides users through the various features of the application.
Accomplishments that we're proud of
- User-Friendly Interface: We created a clean and intuitive interface that is easy to navigate.
- Interactive Maps: The integration of ESRI Web Map and Story Map allows users to explore detailed tree canopy data.
- Community Engagement: We've built a platform that fosters community involvement and encourages users to share their experiences.
What's next for PLANTrees
- Expand Data Sources: Incorporate data from additional sources to provide more comprehensive insights.
- Enhance Machine Learning Capabilities: Explore advanced machine learning techniques to improve planting recommendations.
- Develop Mobile App: Create a mobile app for on-the-go access to PLANTrees features.
- Partner with Local Organizations: Collaborate with local organizations to promote tree planting initiatives and support community efforts.
Built With
- css
- esristorymap
- gis
- html
- javascript
- react
- yolov8


Log in or sign up for Devpost to join the conversation.