-
-
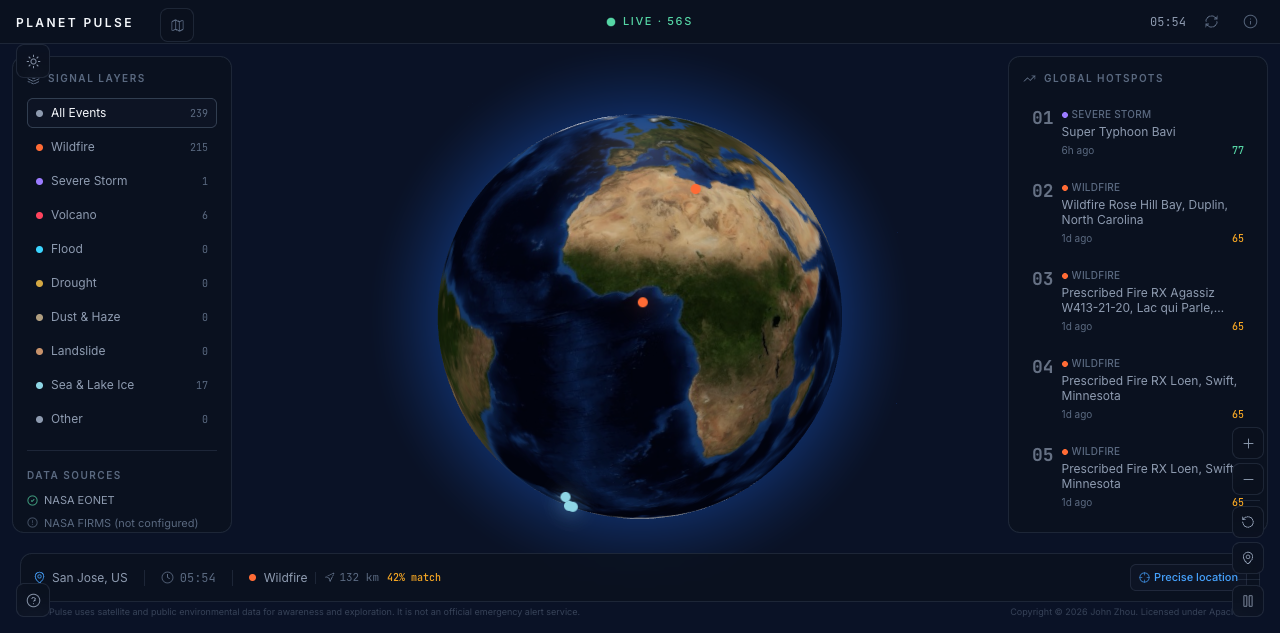
Night Mode
-
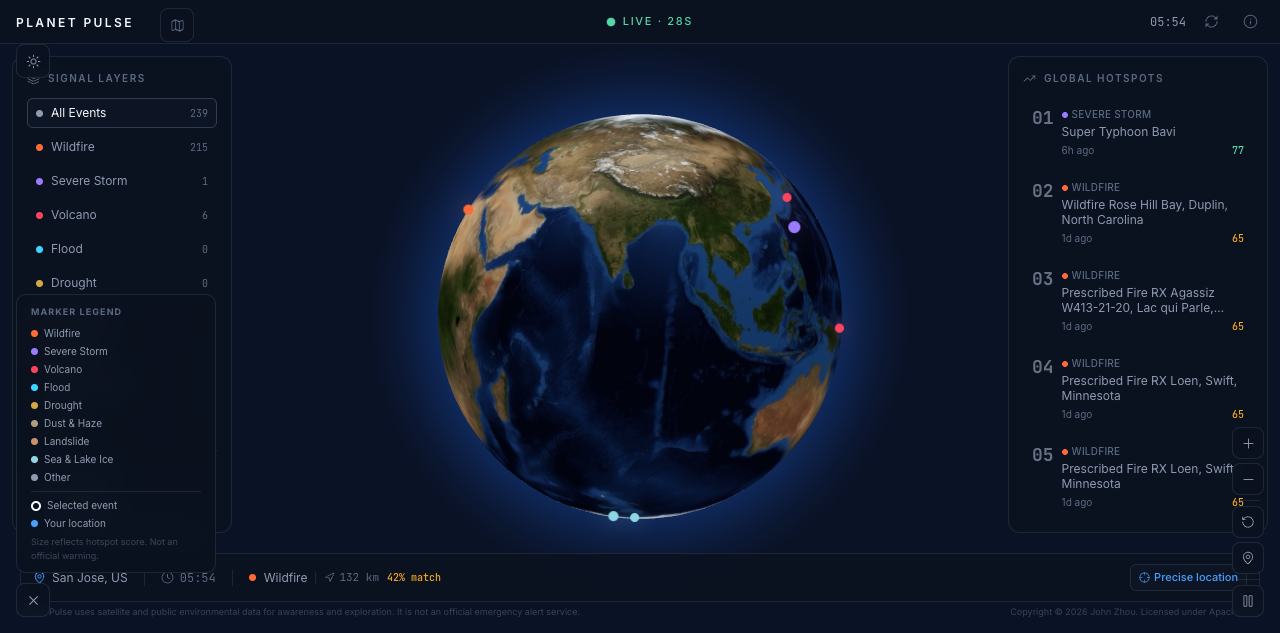
Night Mode
-
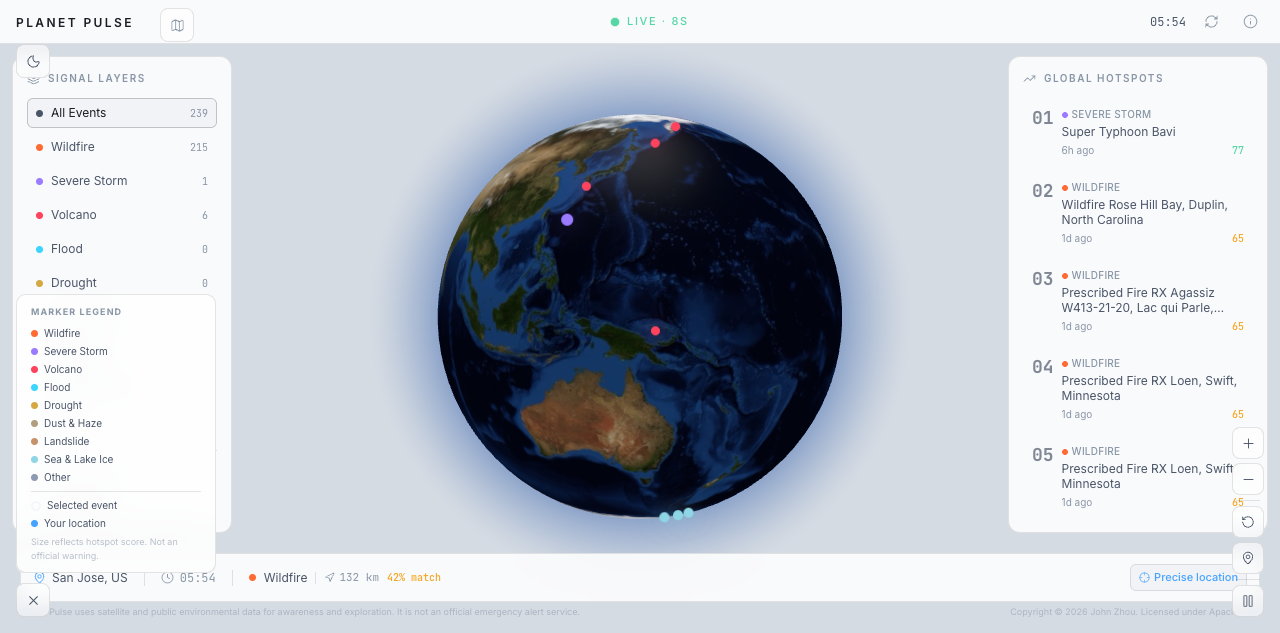
Day Mode
-
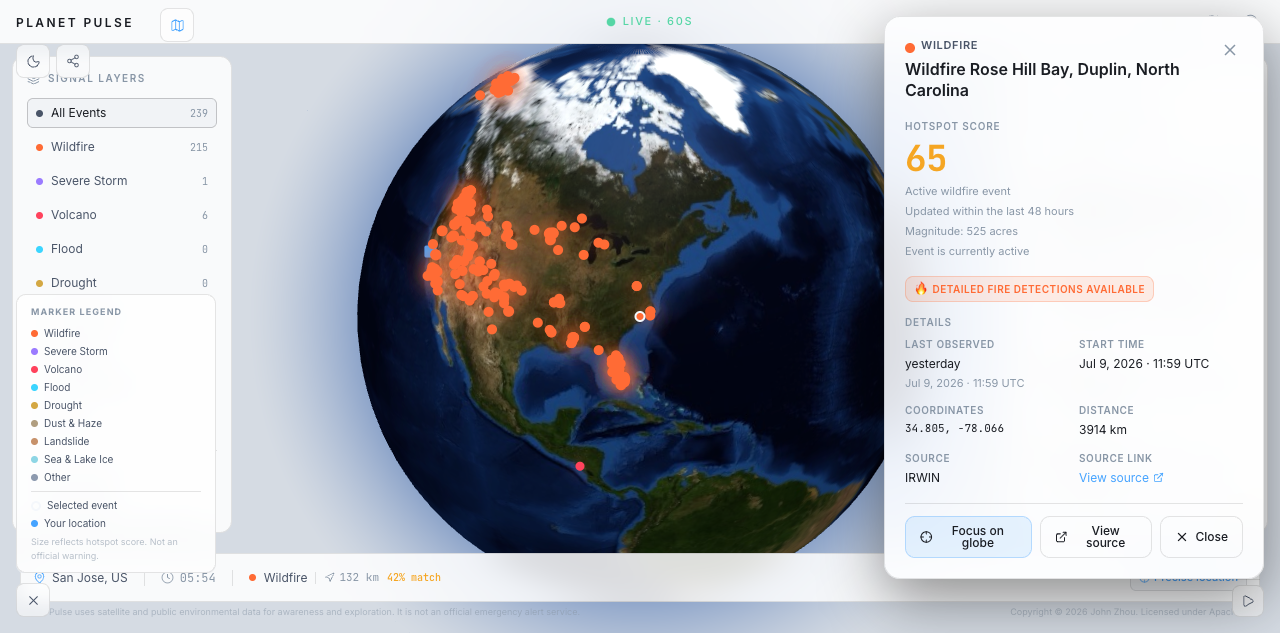
Wildfire Case
-
Day Mode
-
Day Mode
-
NASA picture
-
NASA picture
Inspiration
Environmental disasters happen around the world every day, but information about them is often scattered across different websites, maps, and reports. I have also personally experienced a typhoon, which made me realize that a disaster is not just a number on a screen. It can affect transportation, schools, communication, families, and everyday life.
I wanted to create a platform that helps people quickly understand what is happening around the world and whether nearby environmental events may be relevant to them. This idea became Planet Pulse.
What it does
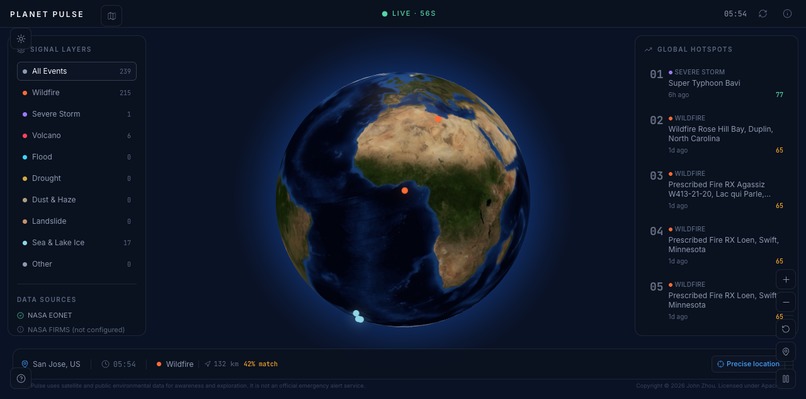
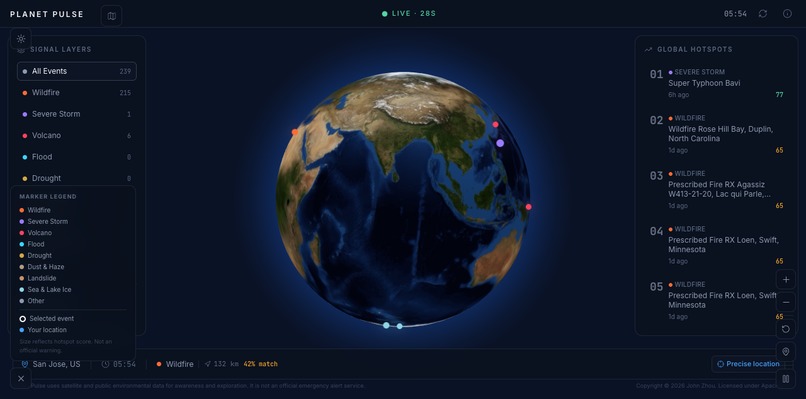
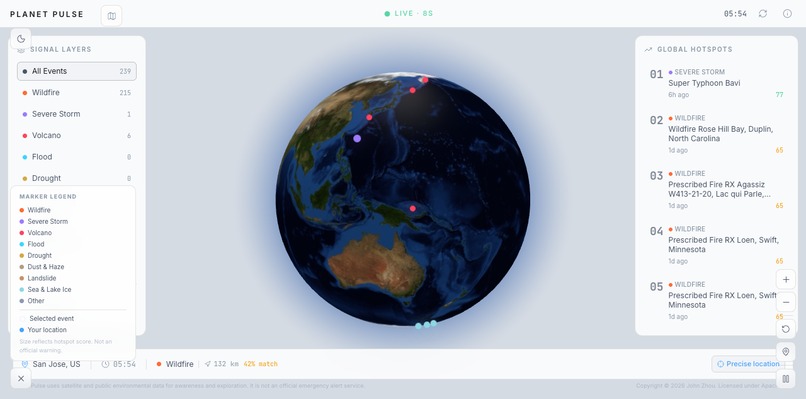
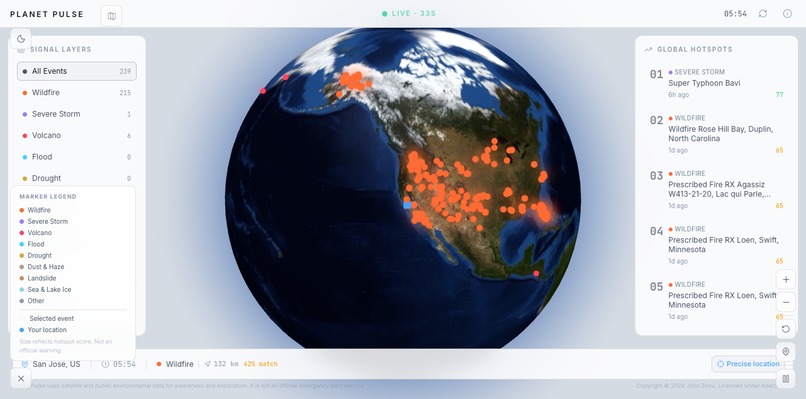
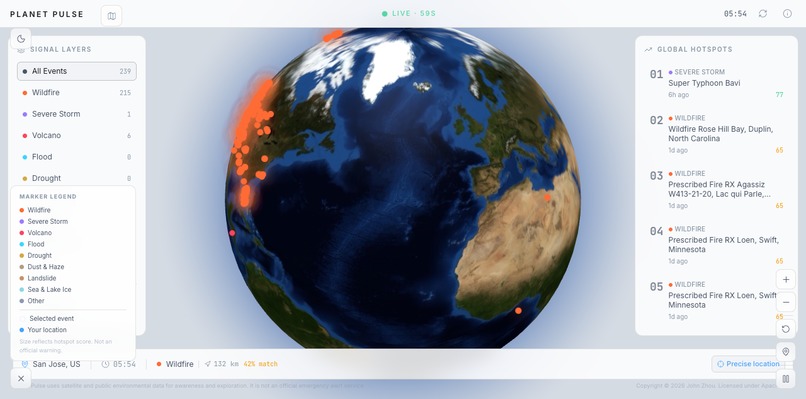
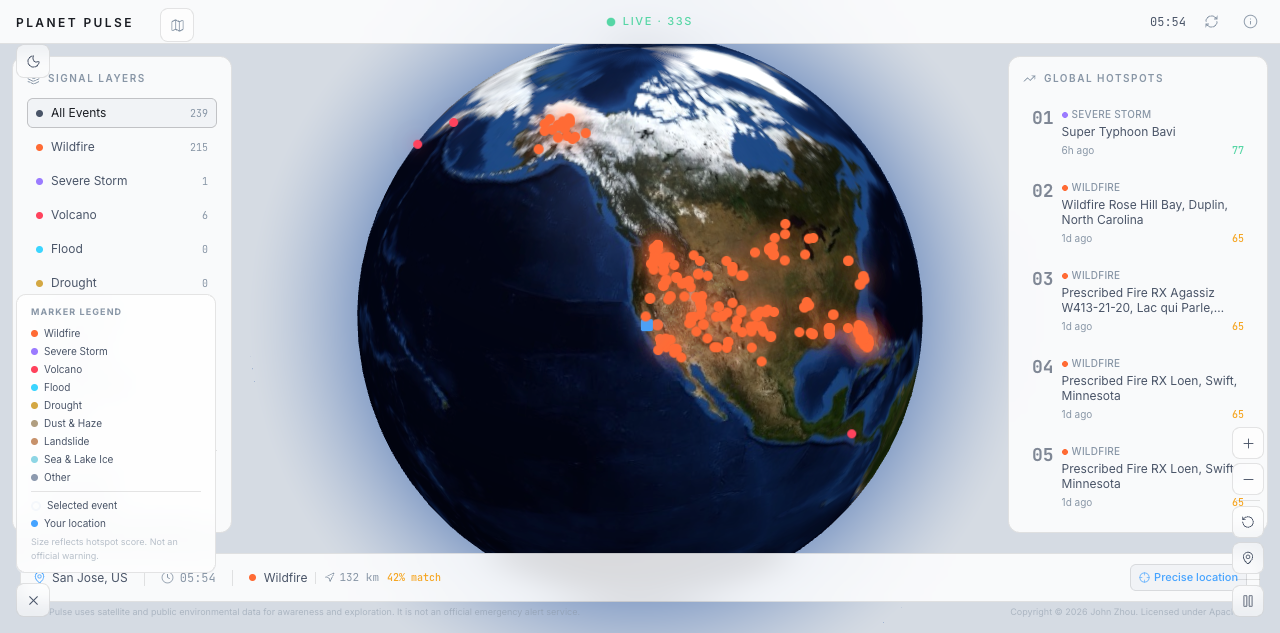
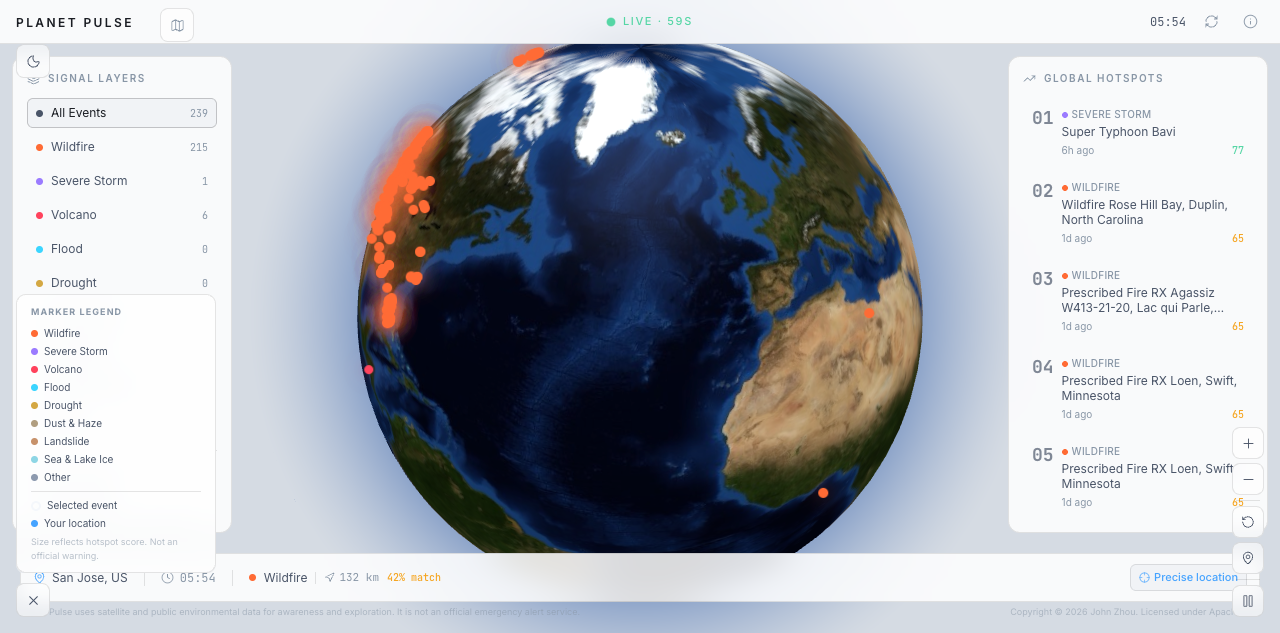
Planet Pulse is an environmental situation-awareness platform centered around an interactive 3D Earth.
Users can:
- Drag, rotate, and zoom the globe
- Explore environmental events from NASA EONET
- View wildfires, storms, floods, volcanoes, droughts, and other events
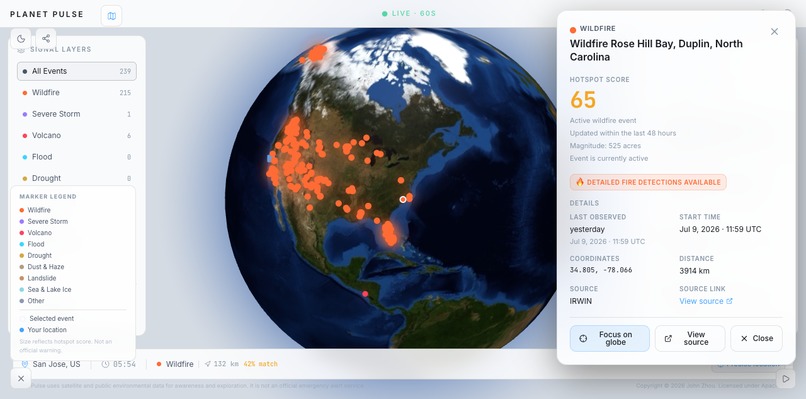
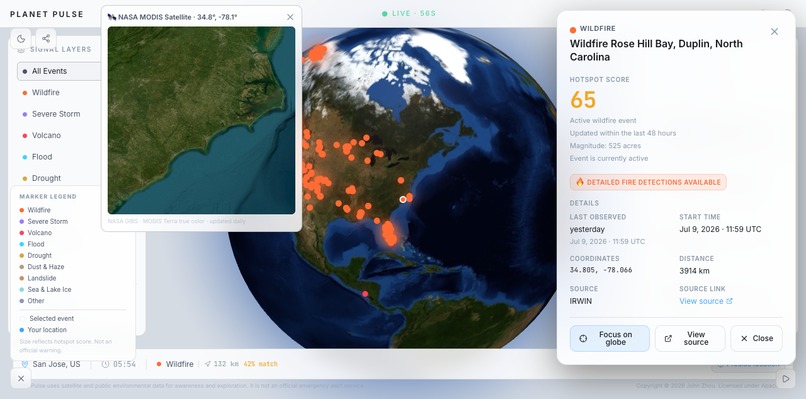
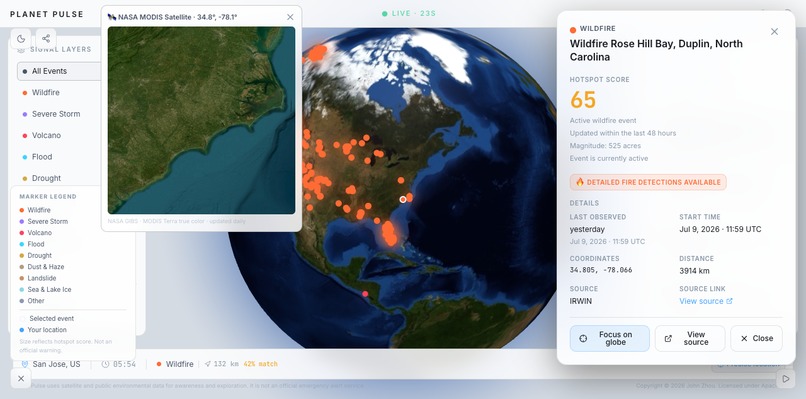
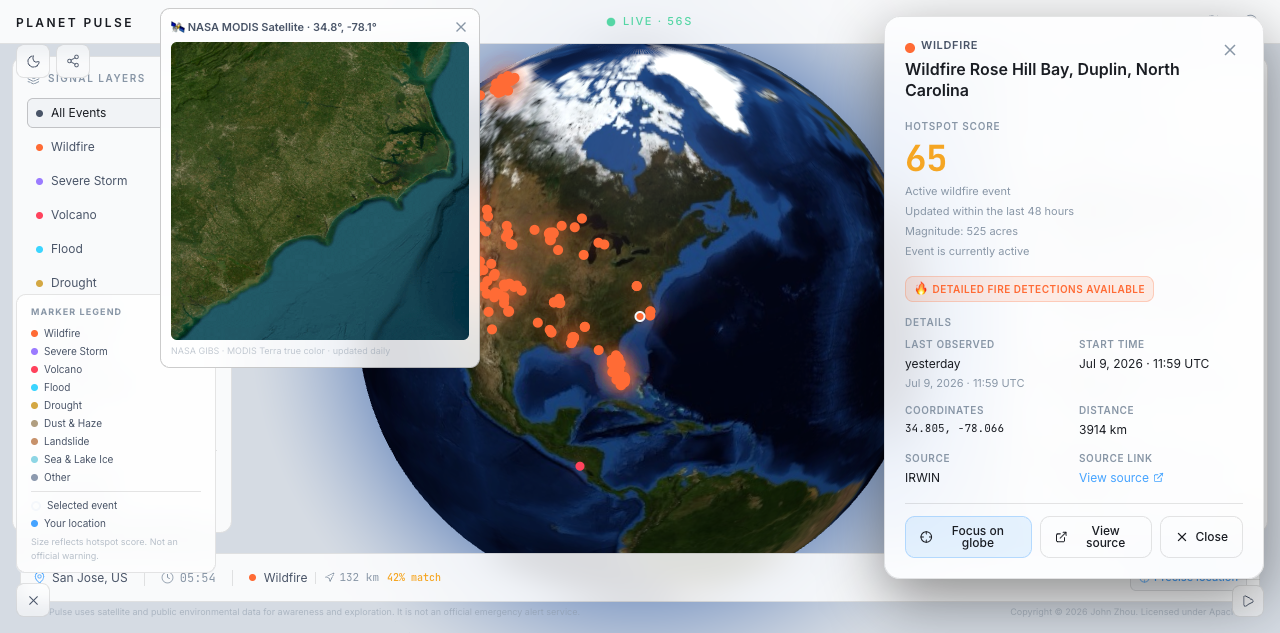
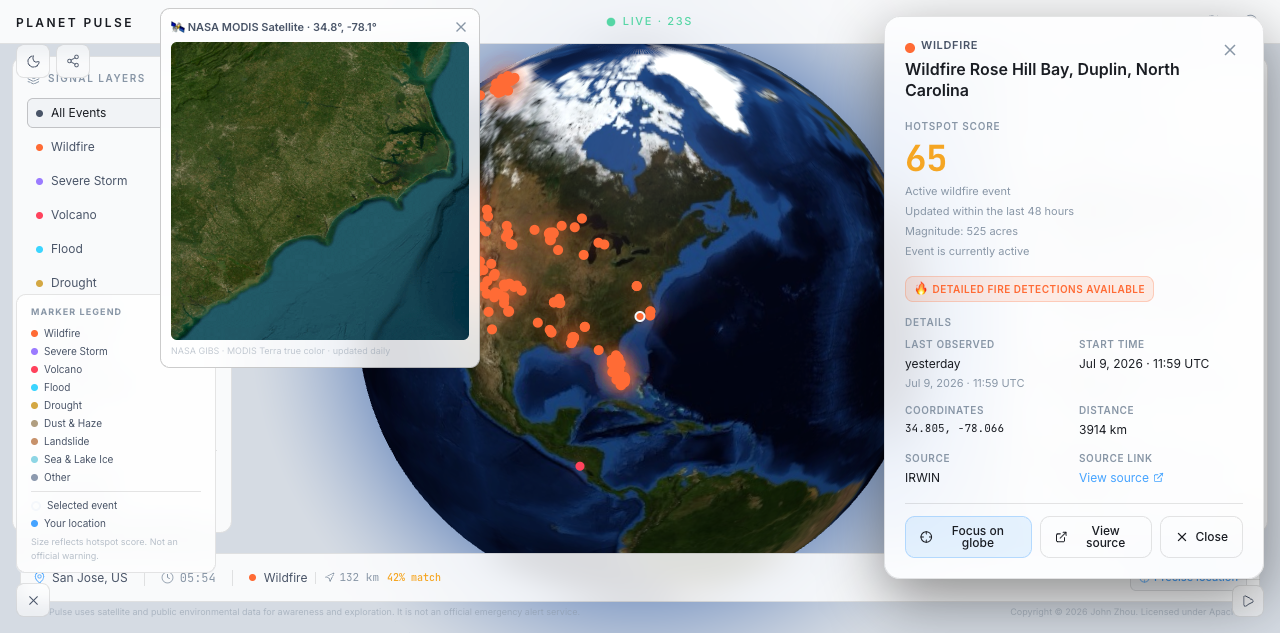
- Click highlighted locations to inspect event details
- Compare events using an explainable hotspot score
- See which events are most relevant to their approximate location
- Distinguish live NASA data, cached NASA data, and offline sample data
Planet Pulse uses different marker colors, sizes, altitudes, and pulse effects to make important environmental events easier to recognize.
The hotspot score uses a deterministic formula based on factors such as data recency, event category, magnitude, and available observations:
$$ H = w_rR + w_mM + w_oO + w_cC $$
In this formula:
- (R) represents data recency
- (M) represents available magnitude information
- (O) represents the number of observations
- (C) represents the event-category weight
- (w_r, w_m, w_o,) and (w_c) are fixed weights
This score is designed for comparison and exploration. It is not an official emergency or danger rating.
How we built it
We built Planet Pulse using:
- Next.js
- TypeScript
- Tailwind CSS
- Three.js
- react-globe.gl
- NASA EONET
- Optional NASA FIRMS integration
- Zod
- Vitest
- GitHub Actions
- Vercel
NASA data is fetched through server-side API routes, validated with Zod, and converted into a shared environmental-event format.
The events are ranked and displayed on a real WebGL-rendered 3D Earth. The globe supports dragging, zooming, touch interaction, camera animations, event markers, observation-history paths, and a separate user-location marker.
We also added retry logic, caching, fallback data, source metadata, automated tests, continuous integration, and production deployment.
You can view the live project here:
Challenges we ran into
One major challenge was handling NASA EONET’s response formats. The API returned standard JSON using an events field, while the original validator expected GeoJSON using a features field. As a result, valid live data was rejected and the website incorrectly displayed fallback data.
We fixed this by supporting both JSON and GeoJSON formats, adding bounded retries, and clearly identifying whether the displayed data is live, cached, or offline sample data.
Another challenge was building a smooth 3D Earth. Rendering too many markers and animations could reduce performance, especially on mobile devices. We limited the number of markers, animated only higher-scoring events, and displayed observation history only for the selected event.
We also encountered React hydration errors because the server and browser could display different local times during the first render. Fixing this taught us the importance of deterministic server-side rendering.
Accomplishments that we're proud of
We are especially proud that Planet Pulse is more than a visual mockup. It is a deployed and functional product that uses real scientific data.
The project currently includes:
- A genuine interactive 3D Earth
- Real NASA EONET environmental events
- Explainable hotspot rankings
- User-location-aware relevance
- Event filtering and animated camera focus
- Data validation and fallback handling
- More than 130 automated unit tests
- Passing lint, type checking, testing, and production builds
- GitHub Actions continuous integration
- A publicly accessible Vercel deployment
We are also proud that the website clearly communicates its limitations. Planet Pulse does not claim to be an official NASA product or an emergency-warning service.
What we learned
Through Planet Pulse, we learned how to:
- Work with real scientific APIs
- Validate inconsistent external data
- Build interactive WebGL visualizations
- Design deterministic and explainable scoring systems
- Handle API failures and degraded-data states
- Protect user-location privacy
- Optimize 3D graphics for desktop and mobile devices
- Debug React hydration problems
- Write automated tests
- Deploy and maintain a production web application
Most importantly, we learned that simply presenting environmental data is not enough. A useful product must help people understand where an event is happening, how recently it was observed, and why it may matter to them.
What's next for Planet Pulse
Our next steps are focused on making Planet Pulse more informative, reliable, and easier to use.
Planned improvements include:
- Event observation timelines
- Shareable event links
- A realistic day-and-night Earth effect
- NASA satellite imagery layers
- More detailed regional fire detections through NASA FIRMS
- Air-quality information
- Better mobile interactions
- Long-term event-history storage
- Additional browser and end-to-end testing
The long-term goal is to turn Planet Pulse into a trustworthy environmental-intelligence platform that helps users understand global events without overwhelming them with raw data.


Log in or sign up for Devpost to join the conversation.