-
-
Planet Pulse
Inspiration
In the context of global environmental challenges, it is essential to build a robust system of comprehensive operational and dynamic ecological monitoring. My idea was to contribute to the global environmental science with the web dashboard that fetches and generalizes threat signals from four major domains (air pollution, deforestation, water stress and ocean temperature) using API calls and approximation from satellite monitoring systems, and provides scientists with global-scale alerts and possible ways to diminish their negative impact.
What it does
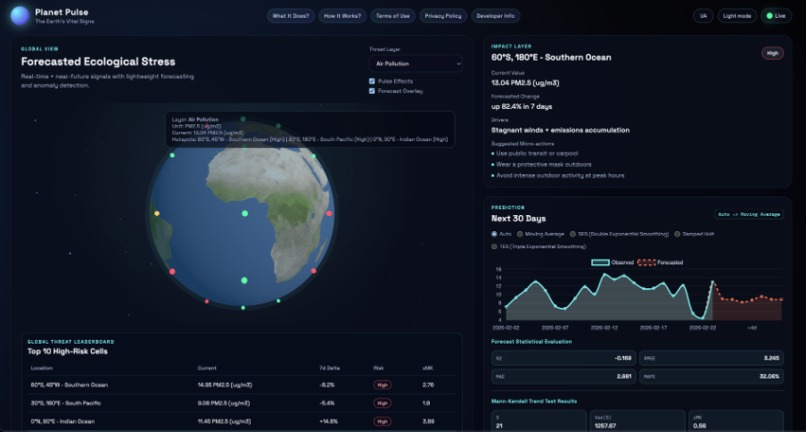
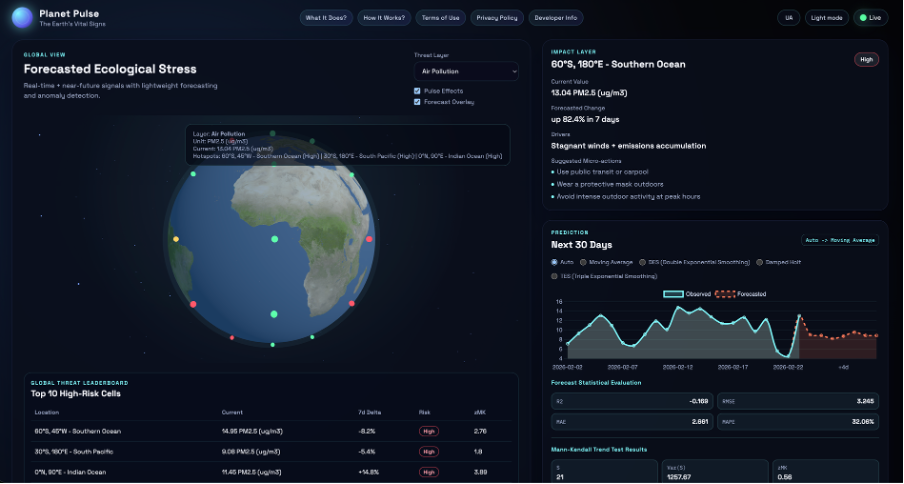
Planet Pulse is a global monitoring dashboard that treats Earth like a living system by combining live environmental signals, trend analysis, and short-term forecasting in one interface. It helps users quickly identify where ecological pressure is rising, how confident forecasts are, and what practical actions can reduce risk in the next days and weeks. The main features are:
- Monitors global threat layers: Air pollution, deforestation pressure, water stress, and ocean temperature.
- Forecasts near-term change: Compares multiple forecasting models (exponential smoothing, moving average, Holt) and auto-selects the best one by error metrics.
- Detects trend behavior: Uses Mann-Kendall statistics (S, Var(S), zMK) to identify meaningful upward/downward trends.
- Prioritizes hotspots: Ranks high-risk cells in a live leaderboard with current values and projected 7-day shift.
- Issues operational alerts: Flags critical growth zones and allows one-click focus on affected regions.
- Supports scenario planning: Lets users test intervention levers and see projected improvement with action guidance.
How we built it
Planet Pulse is a client-side visualization app that combines Three.js rendering, Chart.js forecasting views, and lightweight scoring logic for global risk surfacing. The technological stack of the application includes:
- UI stack: HTML5, CSS3, vanilla JavaScript modules.
- 3D engine: Three.js globe, interactive point selection, and animated atmospheric effects.
- Charts: Chart.js line chart with observed plus forecasted series overlays.
- Data strategy: API-first with synthetic fallback for continuity and demo stability. Data sources include Open-Meteo, OpenAQ, Global Forest Watch, WRI, NASA EarthData.
Challenges we ran into
I had to learn the mathematical statistics algorithms myself to write the corresponding code. Also, it was challenging to ensure stability in fetching data through API calls, and make simulations. Apart form the aforementioned, I was not familiar with Three.js and Chart.js libraries before this hackathon, and had to learn their main functionality fast.
Accomplishments that we're proud of
A complete self-sufficient bilingual lightweight global-scale ecological monitoring system that does not only fetch threats and signals, but also provides insights like forecasts and diminishing effects - isn't it great?
What we learned
Chart.js, Three.js, mathematical statistics algorithms.
What's next for Planet Pulse
If the application gets acknowledged, I will extend the functionality, add more threats watching, and maybe release a mobile app;ication.


Log in or sign up for Devpost to join the conversation.