-
 GIF
GIF
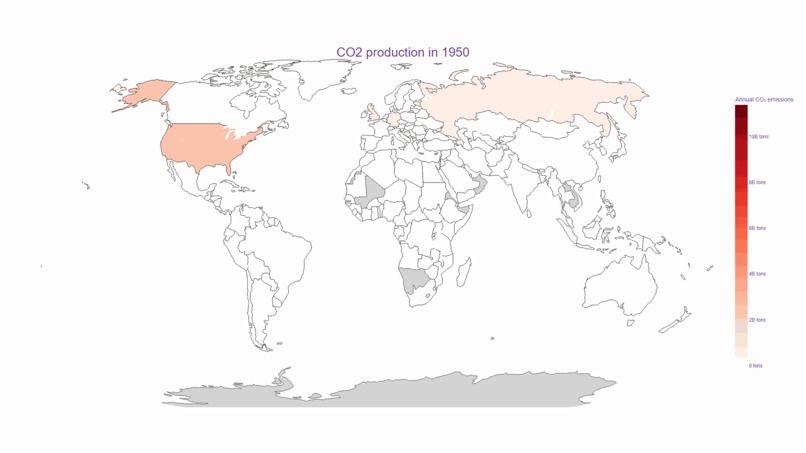
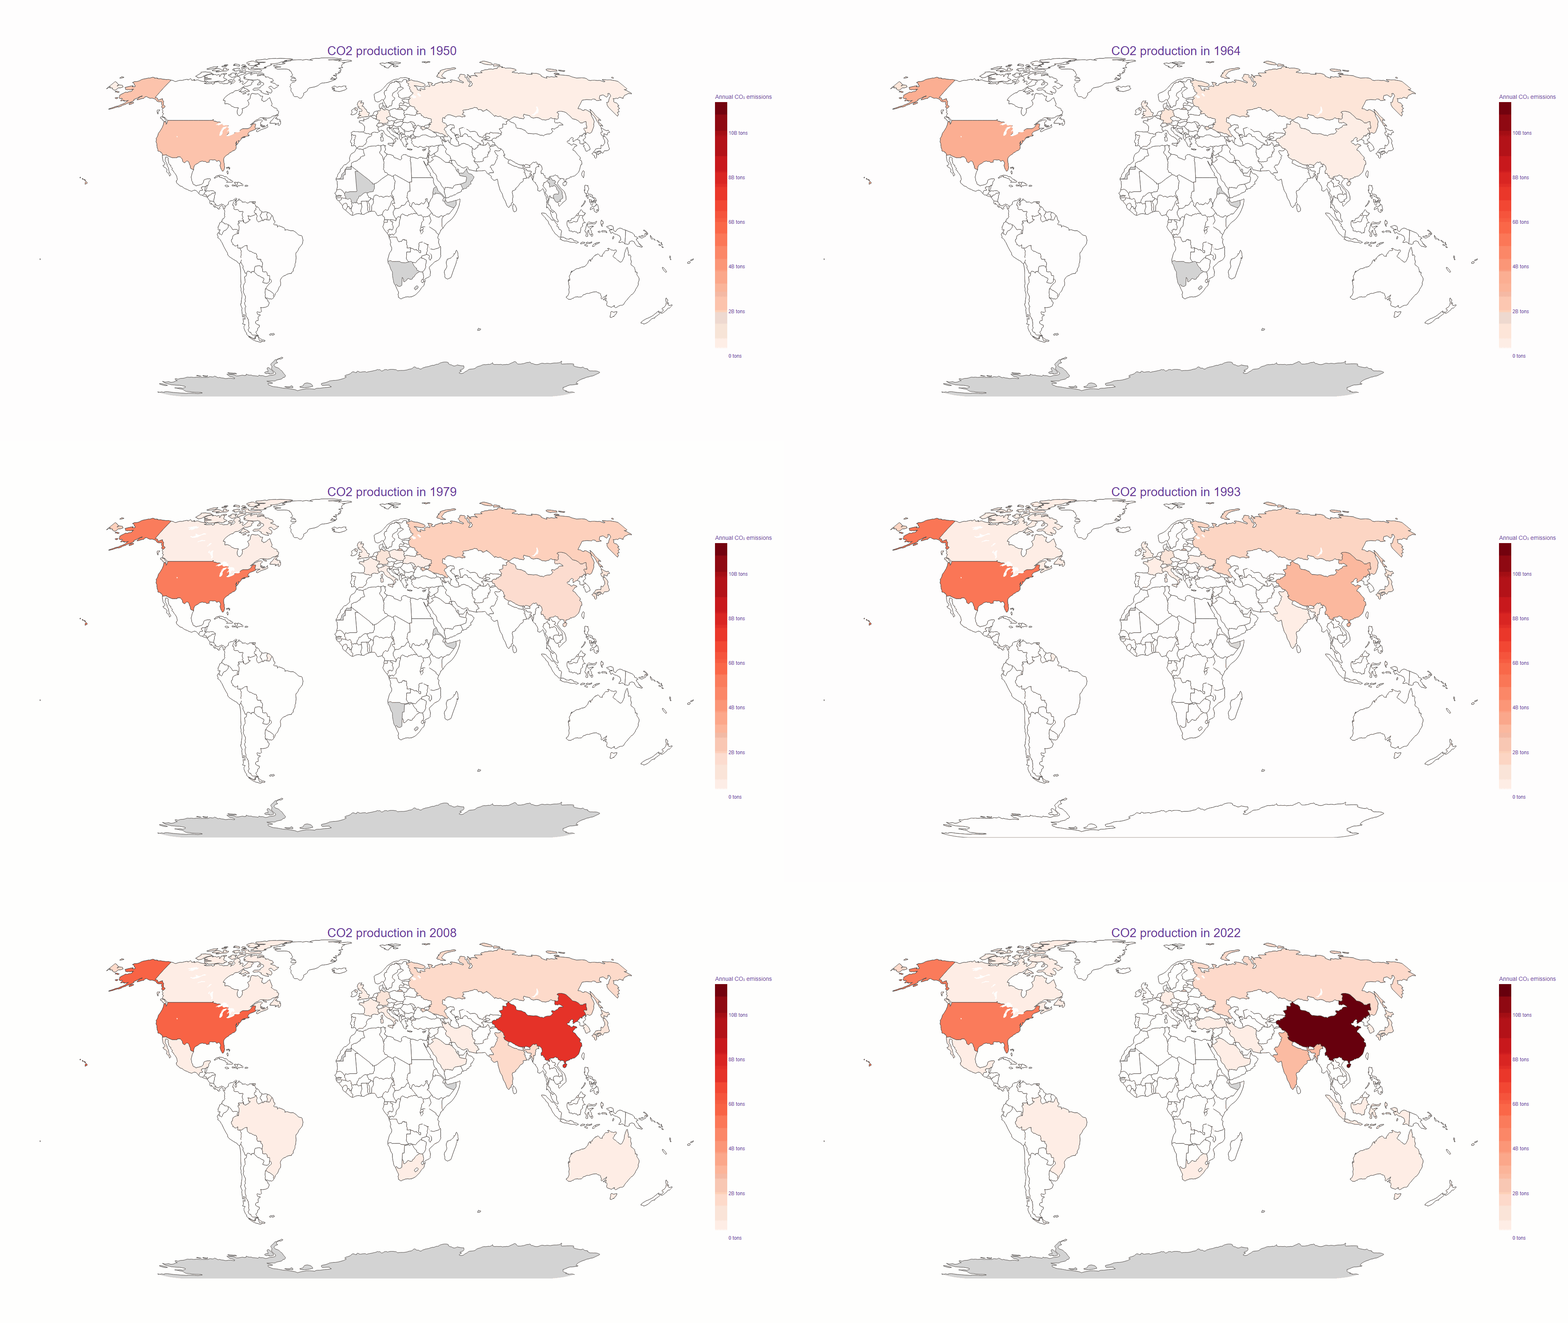
Animation of Global CO2 Productions from 1950 to 2022
-
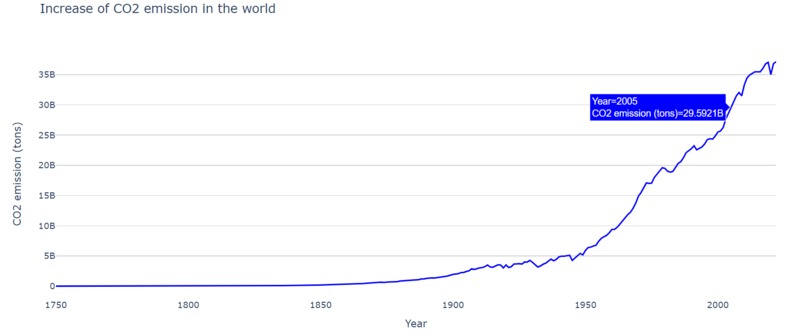
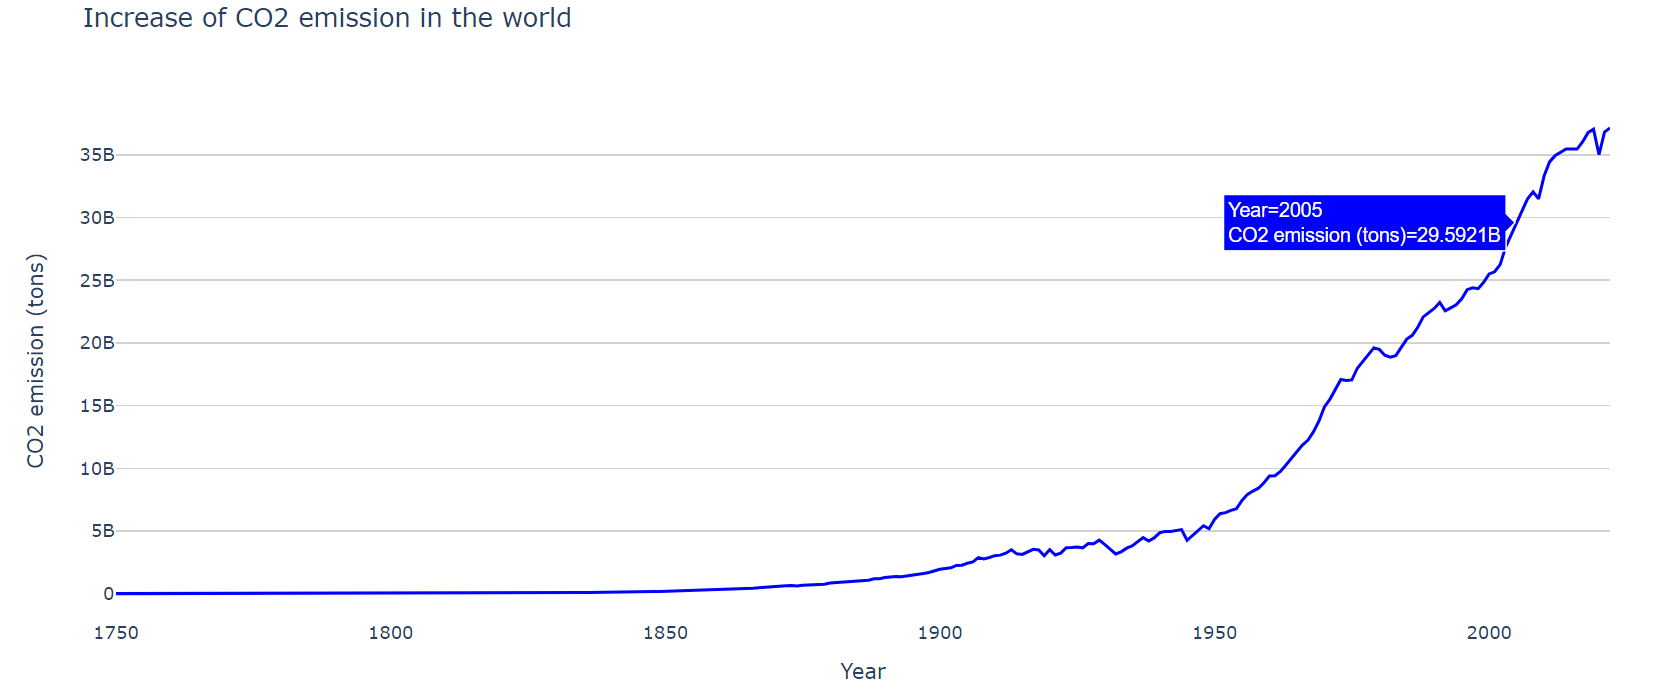
Increase of Global CO2 Emissions
-
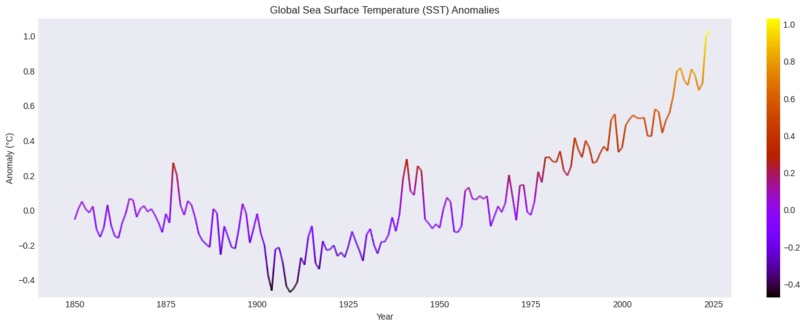
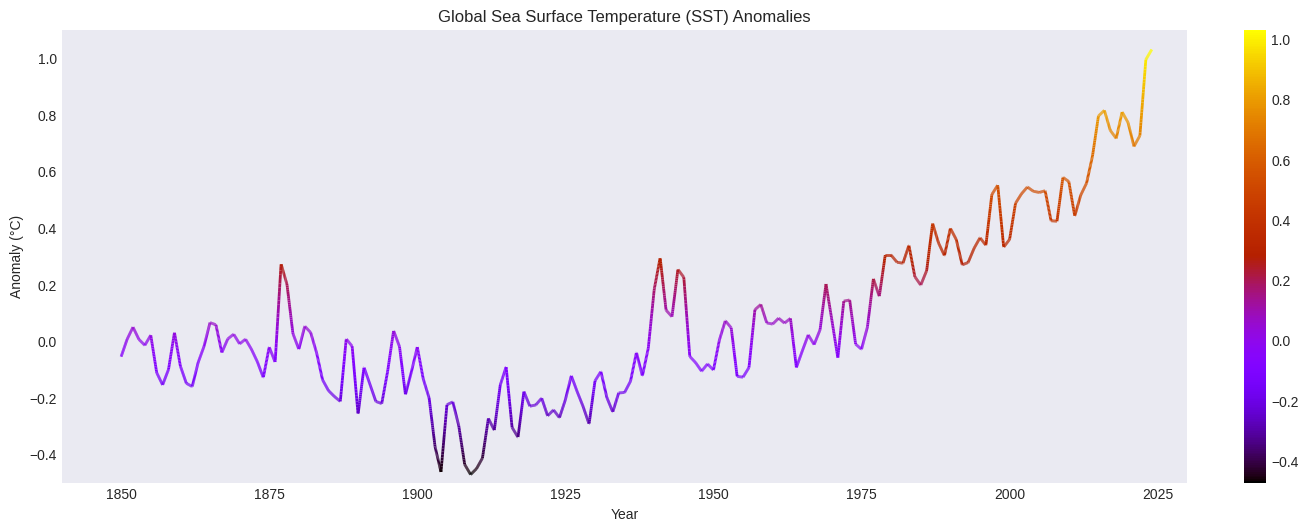
Global Sea Surface Temperature (SST) Anomalies
-
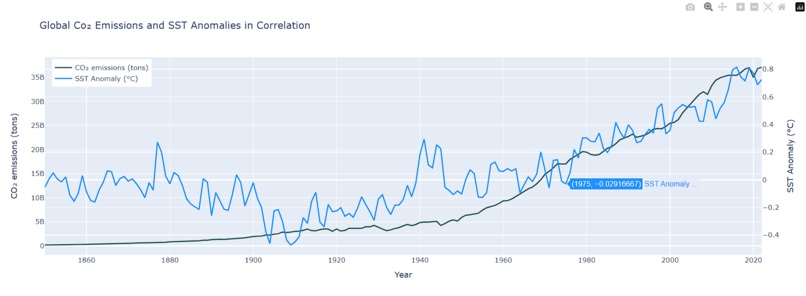
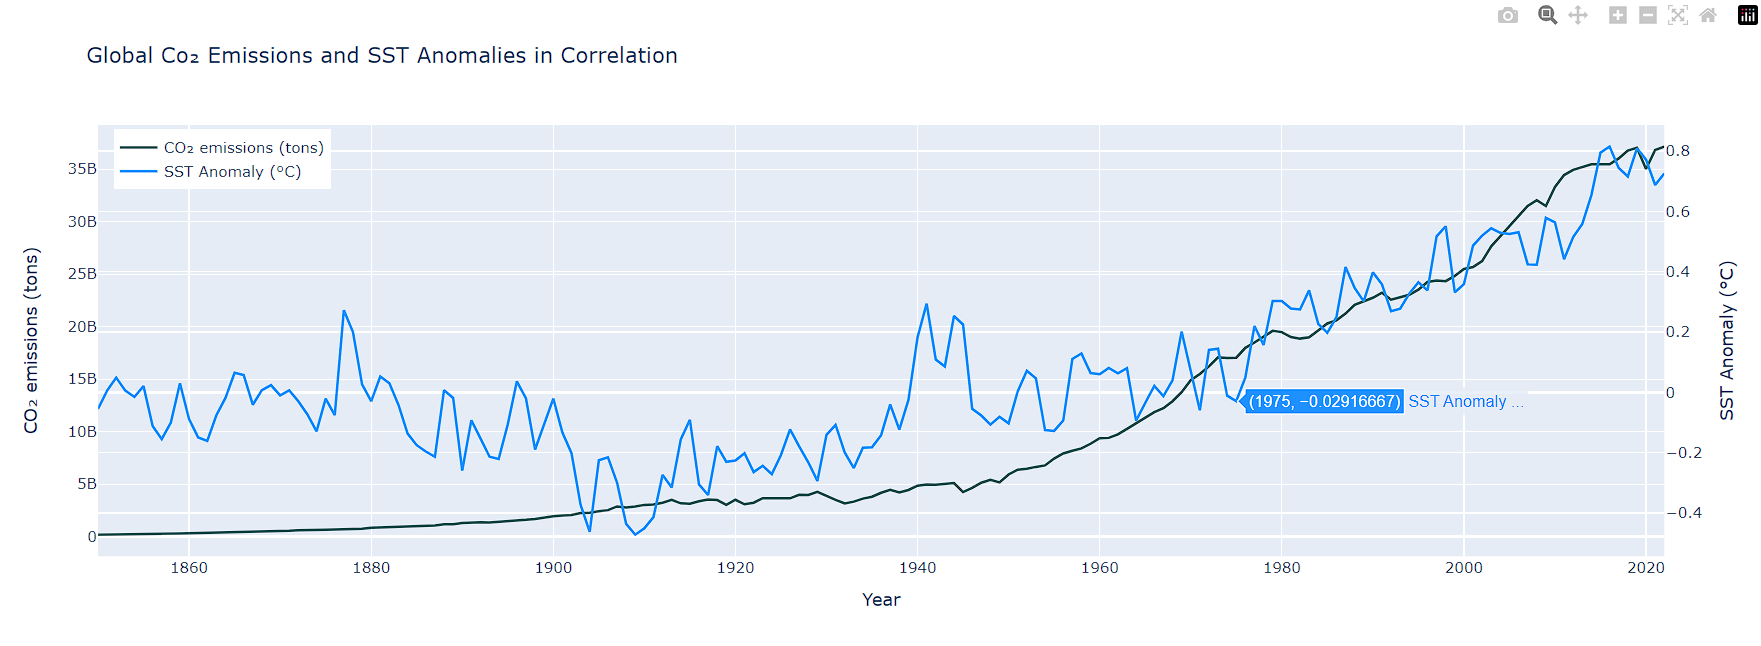
Global Co2 Emissions and SST Anomalies in Correlation
-
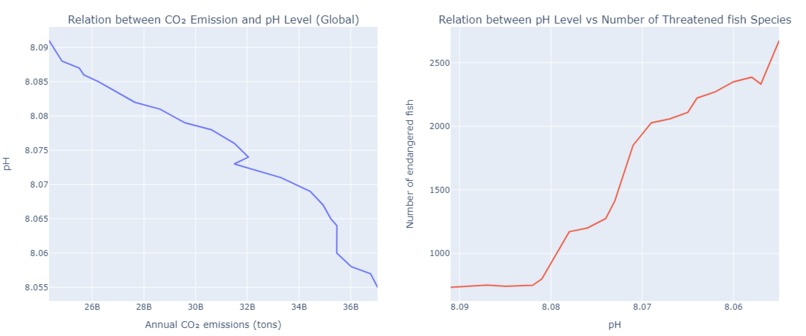
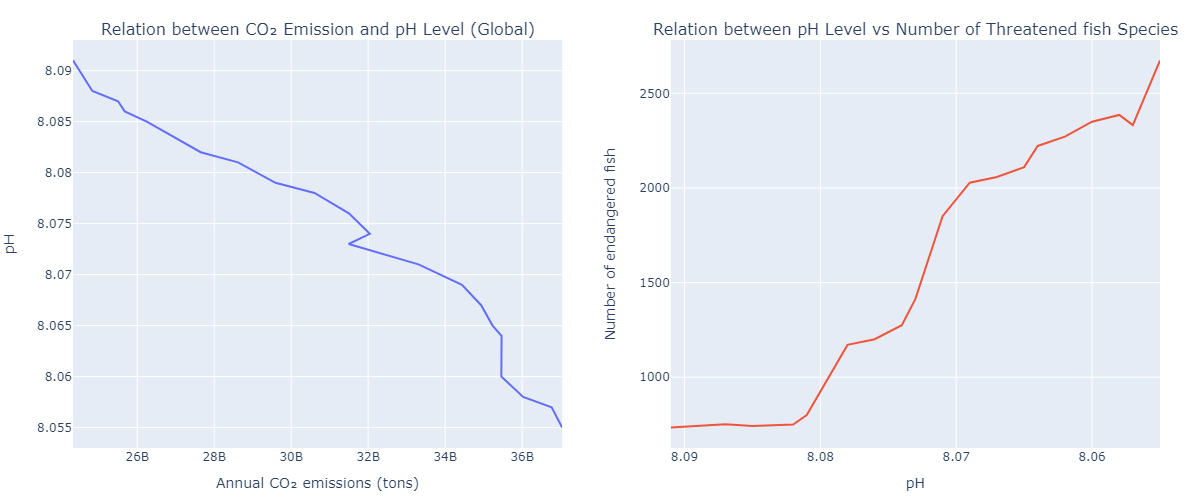
Relations between CO2 Emissions, PH levels, and Threatened Fish Species
-
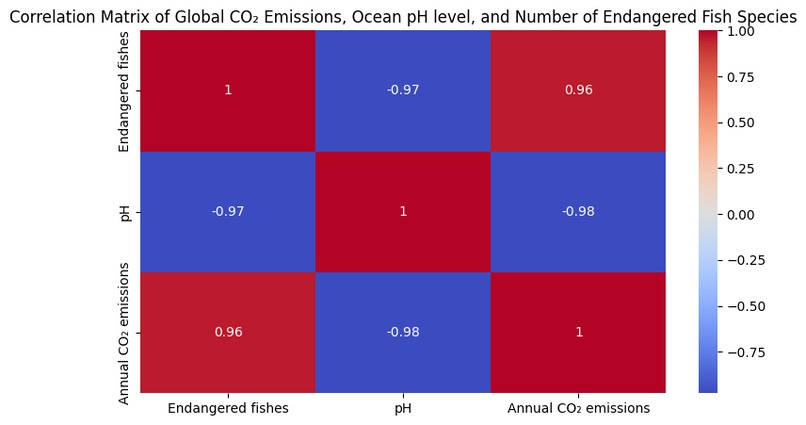
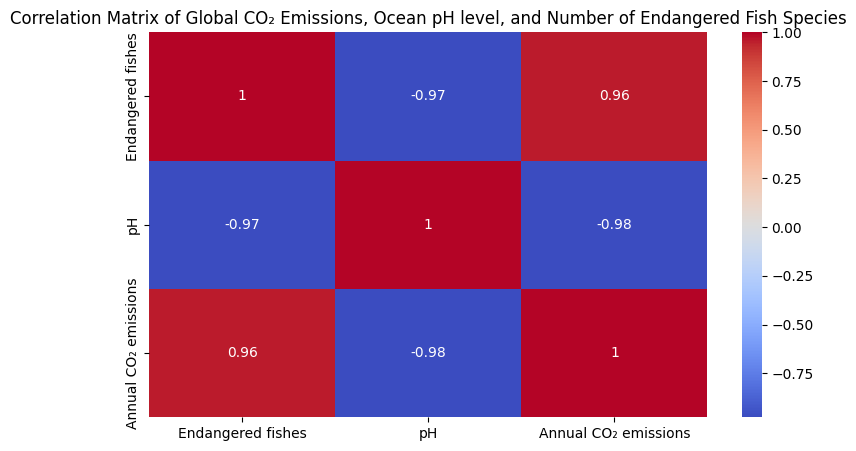
Correlation Matrix of Global CO2 Emissions, Ocean PH level, and Number of Endangered Fish Species
-
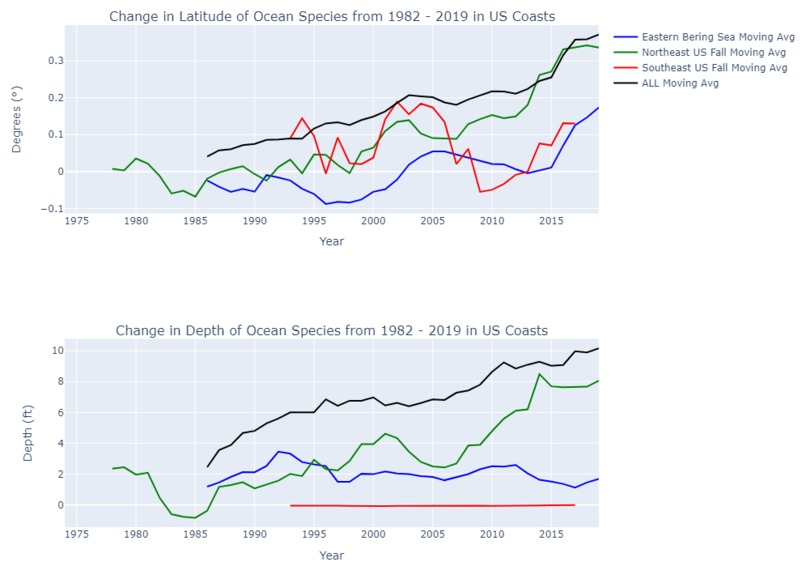
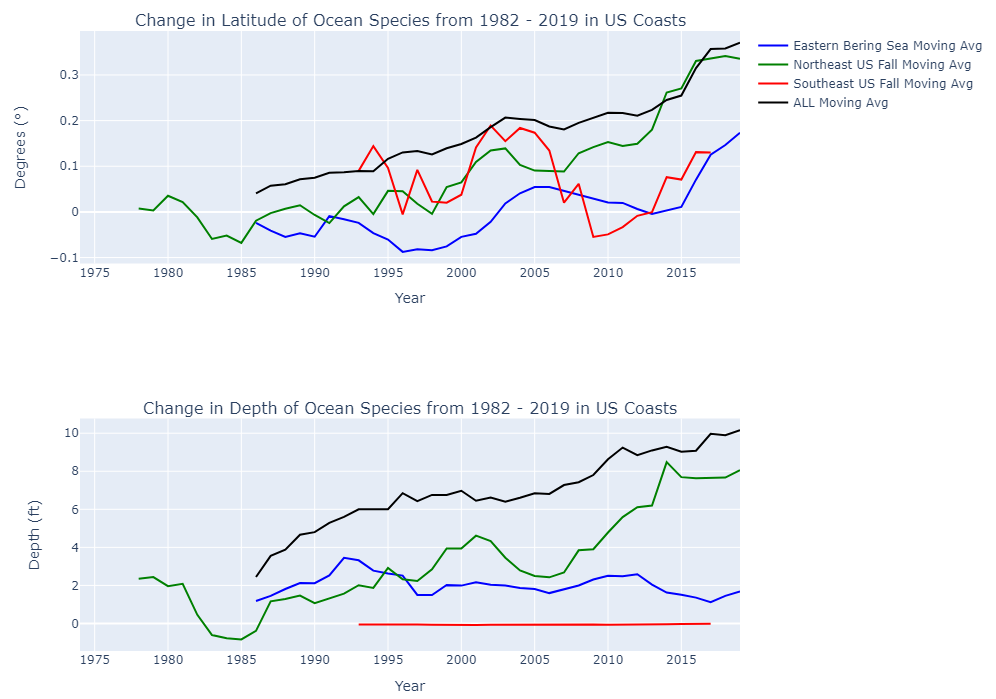
Ocean Species Migration Over the Years in US Coasts
-
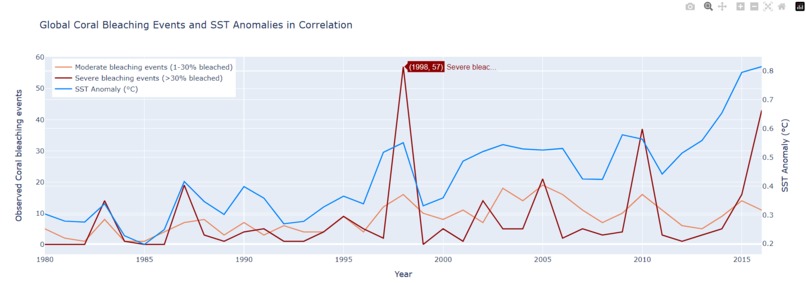
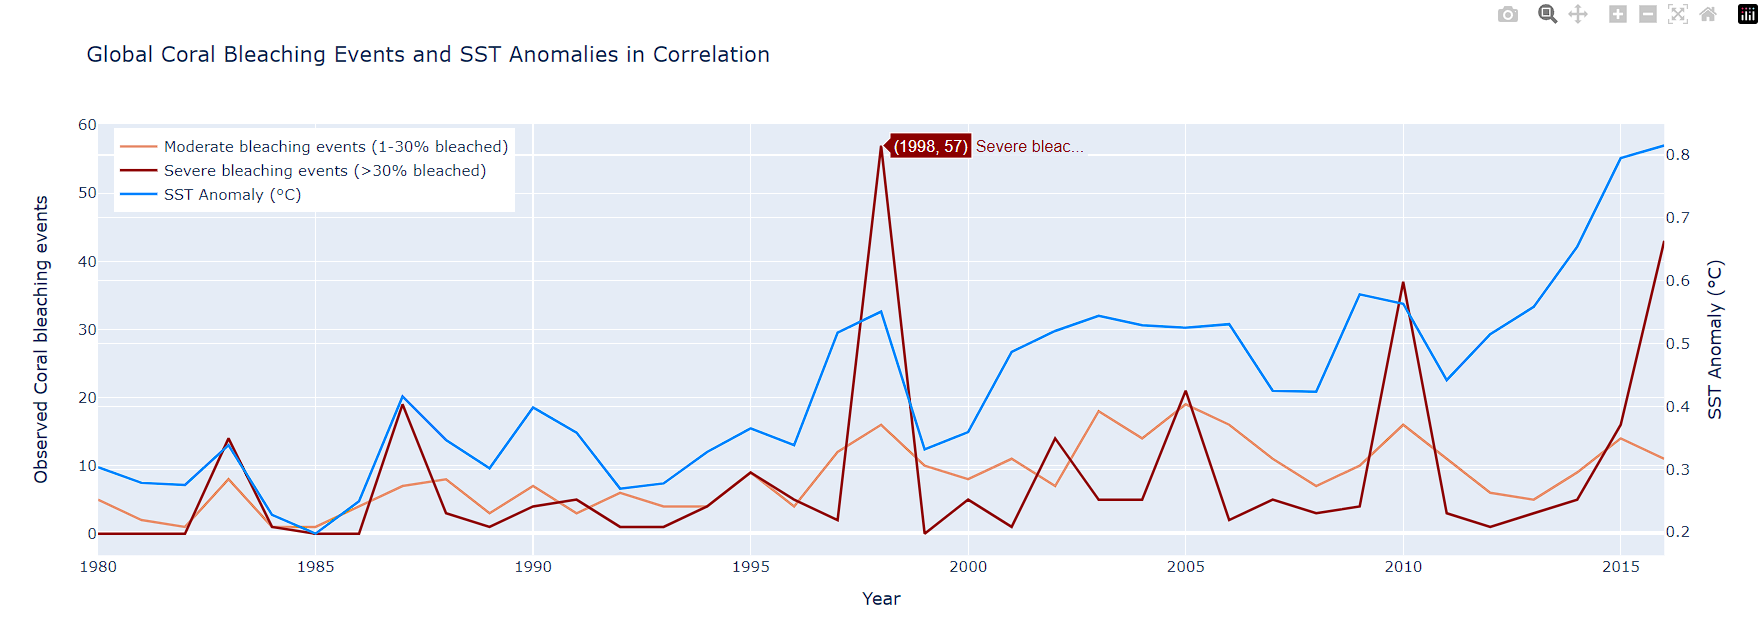
Global Coral Bleaching Events and SST Anomalies in Correlation
Inspiration
In our Enriched Science seminars, we had multiple speakers present their research on the impact of global warming on marine species. These seminars were the most memorable to us and raised awareness within us about the importance of marine ecosystems, which we do not often hear about 🐟
Story
Did you know that over the last three decades, the world has lost half of its reefs because of global warming? Under the waters that cover 70% of our Earth, what else is happening? Our story is about the impacts of global warming, caused by excessive CO2 emissions, on marine ecosystems and habitats.
First, we observed how CO2 emission increases all over the world. Our graphs show that the increase in temperature anomalies is closely related to the decrease in the ocean pH (acidification of the oceans). The following equation explains the relationship between the CO2 in the water and the pH:
CO2(aq) + H2O ↔ H2CO3 (1)
H2CO3 ↔ HCO3- + H+ (2)
HCO3- ↔ CO32- + H+ (3)
The decrease in pH of the oceans endangers fish, which increases the number of threatened fish species.
We also speculated that increasing global CO2 emissions would be closely correlated to increasing sea surface temperature anomalies. Our graph shows a positive correlation between the two values. What impacts does ocean warming have on marine ecosystems?
First, we found that on average, fish species were migrating northwards from their previous habitats, as well as deeper into the water; Coral bleaching events also strongly correlate with global sea surface temperature increase. We often think that the increase in CO2 emissions only impacts humans and land animals, but they also have disastrous consequences on lives in water. This means that it is even more important for us to reduce carbon emissions to save not only ourselves and our land, but also our oceans.
Note however that instead of blaming specific countries for the increase in CO2 emissions, our map shows that all countries have increased their CO2 emissions. Thus, we all need to take action to protect the air as well as the sea species!
Behind the Story: Our Data Analysis
After finding datasets that have sufficient data, we created various meaningful graphs from CO2 emissions, sea surface temperature anomalies, sea pH level, endangered fish species, ocean species migration, and coral bleaching events datasets as shown above. To combine these datasets into meaningful correlation graphs, a lot of data manipulation was needed, such as averaging monthly data into yearly data, deleting years of data that does not correspond to another dataset, and overall reducing large amounts of data in CSV files into manageable amounts. We also worked on three different Google Colaboratory files to facilitate the process.
What are your data sources?
- Annual CO₂ emissions by fossil fuel and industry
- Global Sea Surface Temperature Anomlaies
- What is the 'other carbon dioxide problem'? How are humans driving changes in the chemistry of the ocean, and what might this mean for marine ecosystems in the future?
- Global Ocean acidification - mean seawater pH time series and trend from Multi-Observations Reprocessing
- Number of Threatened Fish Species
- Migration of Ocean Species in the US coastal regions
- Number of coral bleaching events
How did you use ChatGPT?
We mainly used ChatGPT for code assistance. It is accurate most of the time as long as we provide specific inputs. However, the LLM does have its limits: for the gradient global SST graph, it could not successfully generate the result we were aiming for; but overall it was very helpful! We used it for many miscellaneous small tasks (e.g. removing a row, adjusting a legend's position, merging two dataframes, answering questions on what a specific line of code means) and sometimes big tasks (e.g. plotting two data frames using Plotly).
What we learned
We learned how to work together as a team, how to use ChatGPT to our benefit, and the overall difficulties of data journalism. Specifically, it was important for us to properly process the data and determine which correlations are the most meaningful.


Log in or sign up for Devpost to join the conversation.