-
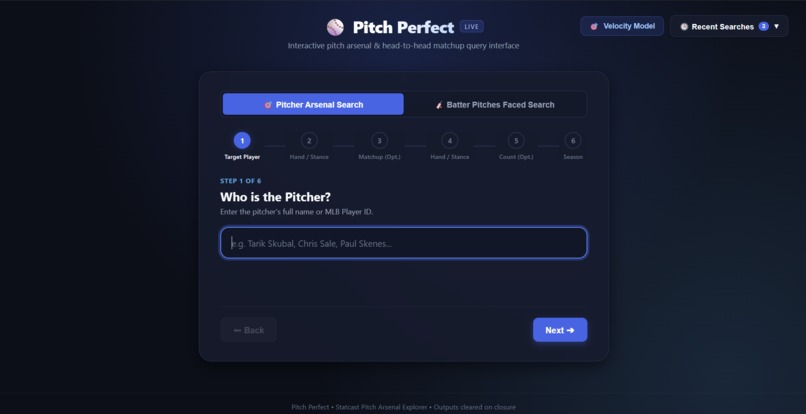
Home Screen
-
-
-
-
-
-
-
-
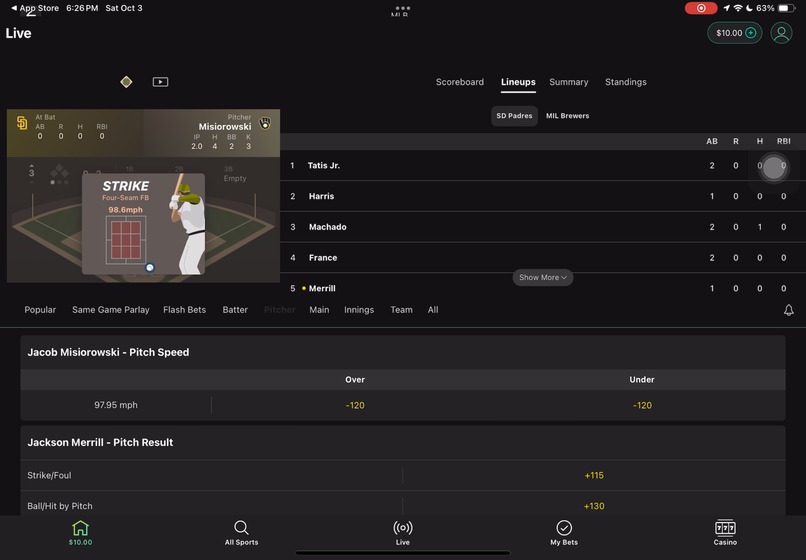
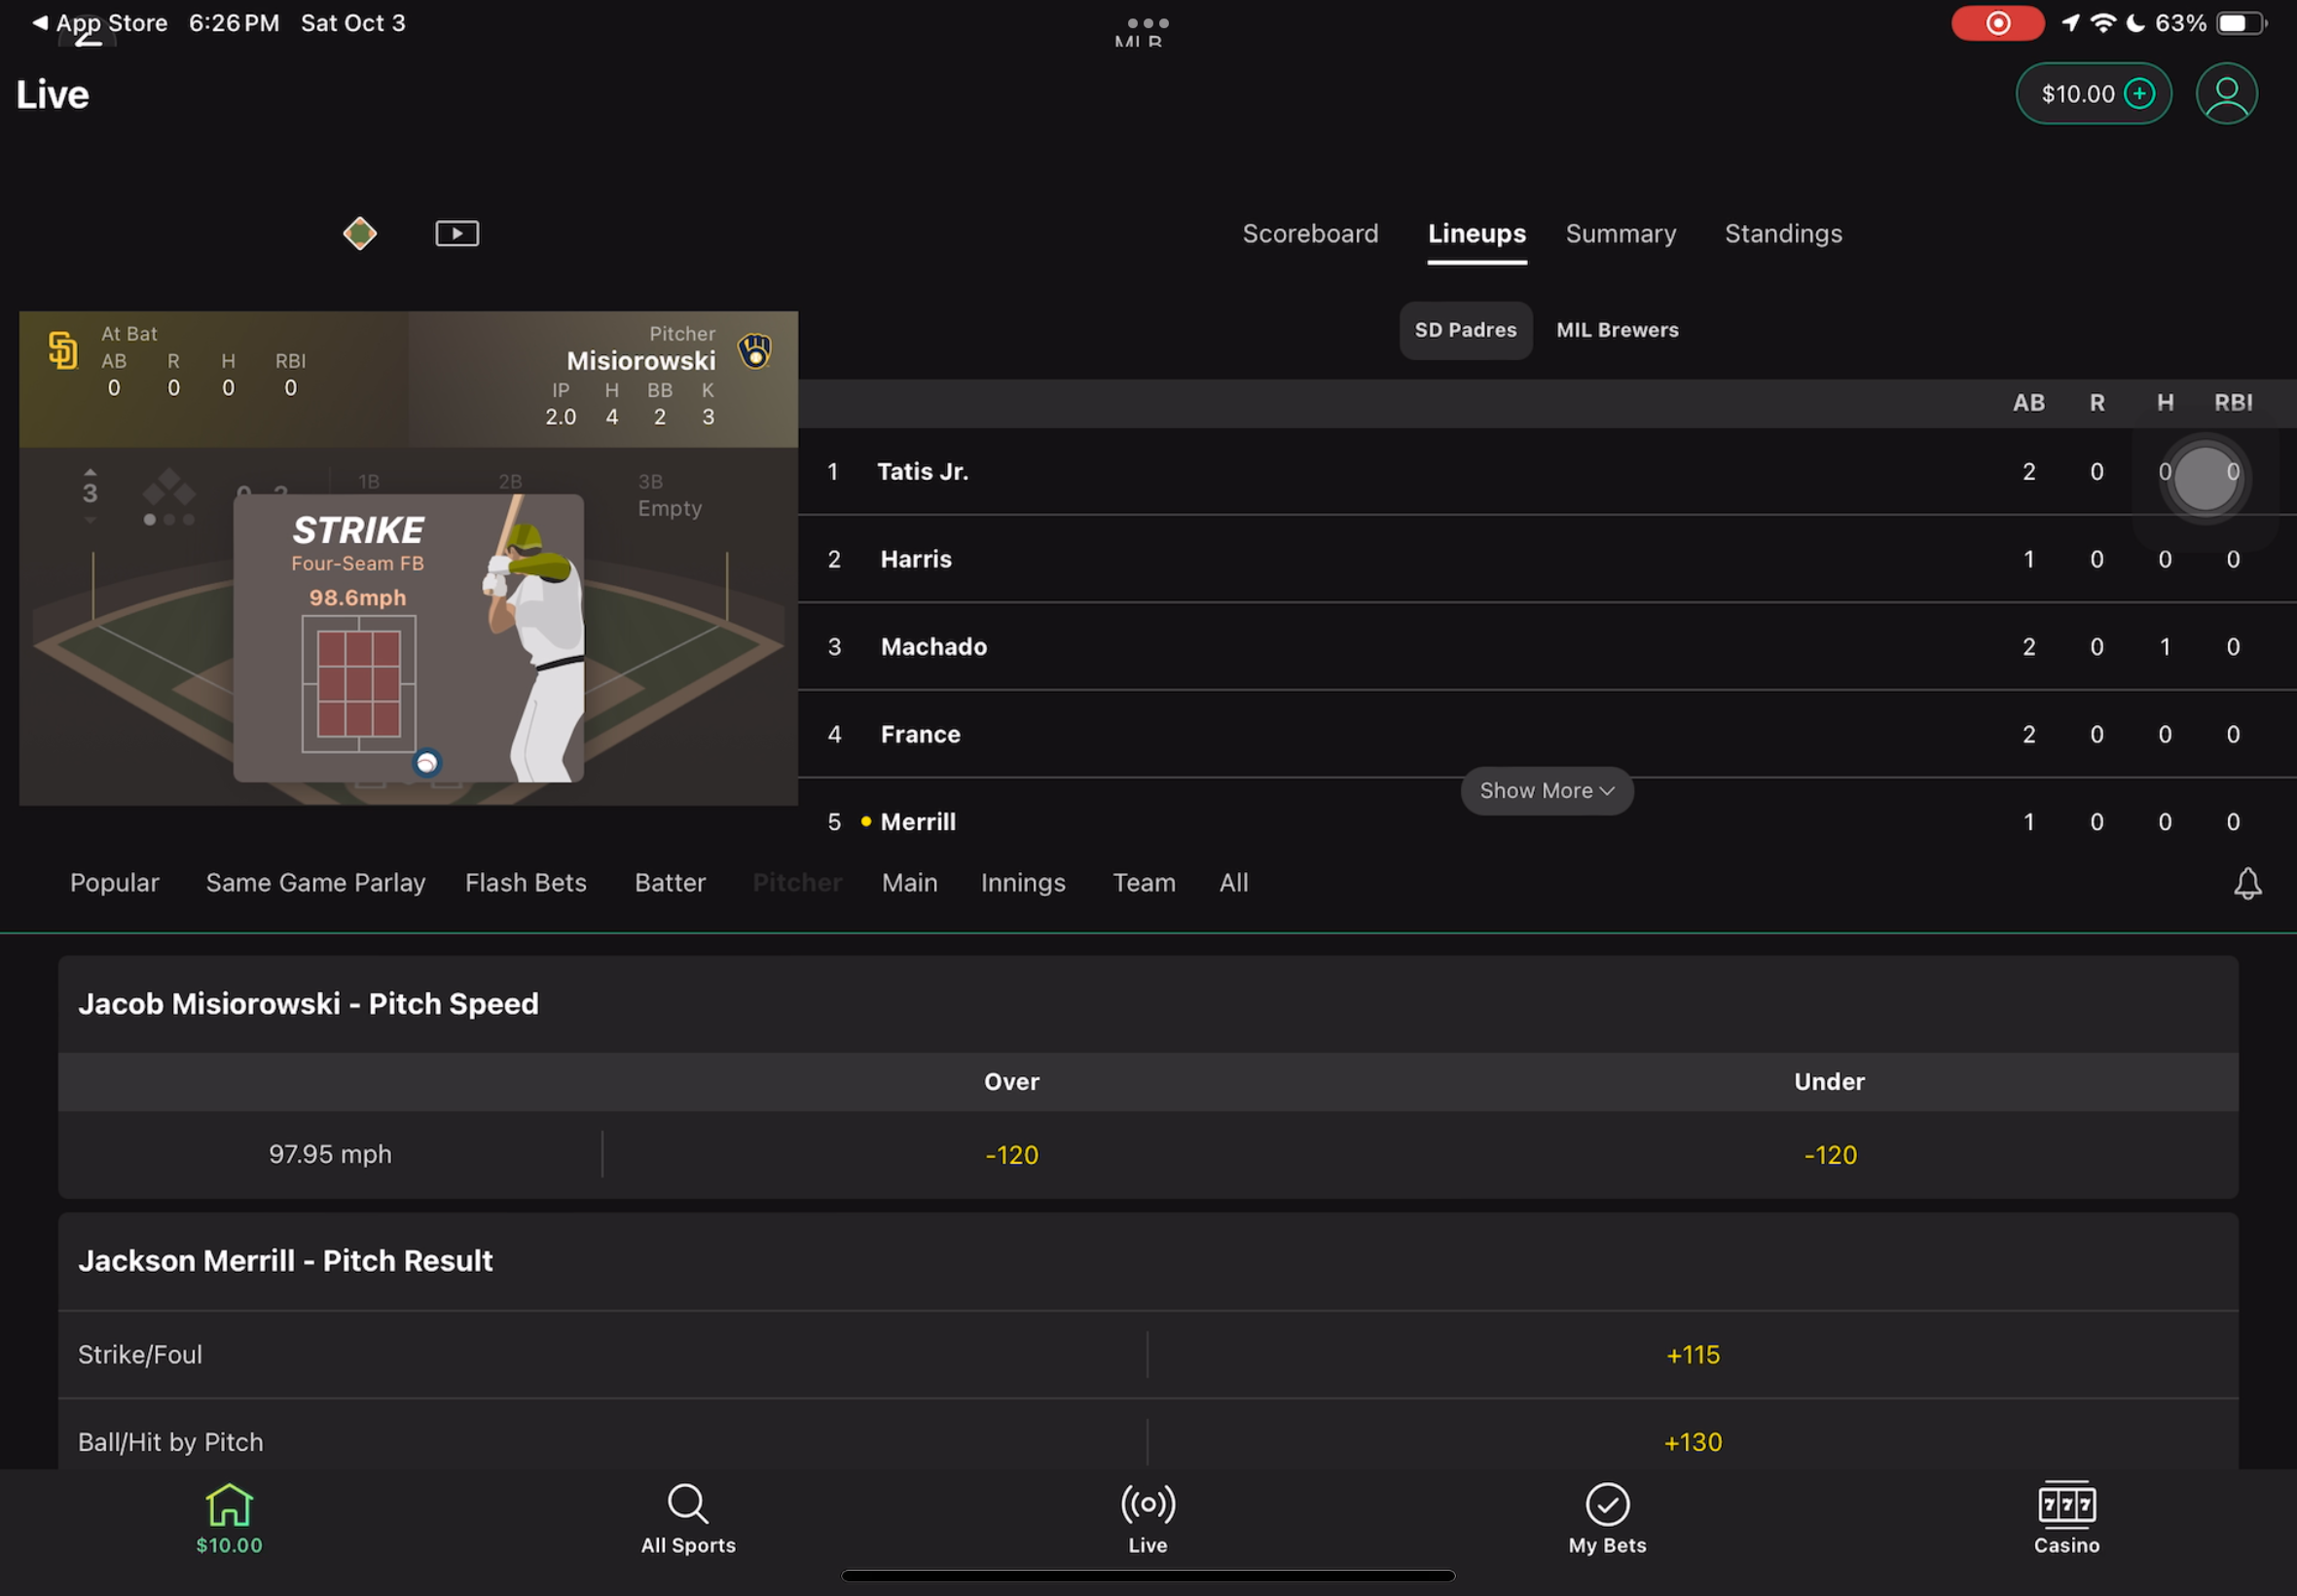
Screen Recording of the Real Time Betlines
-
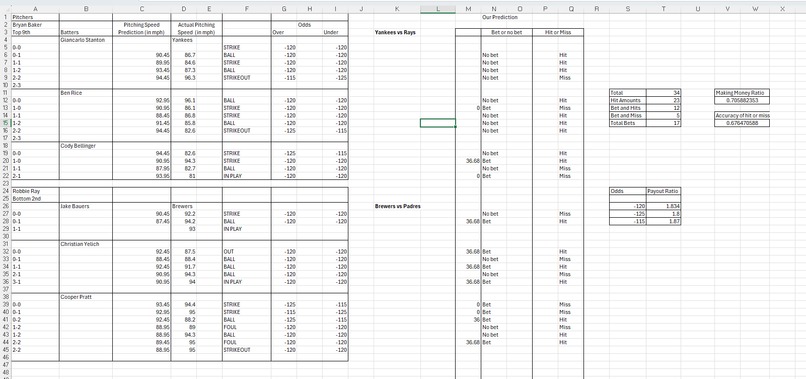
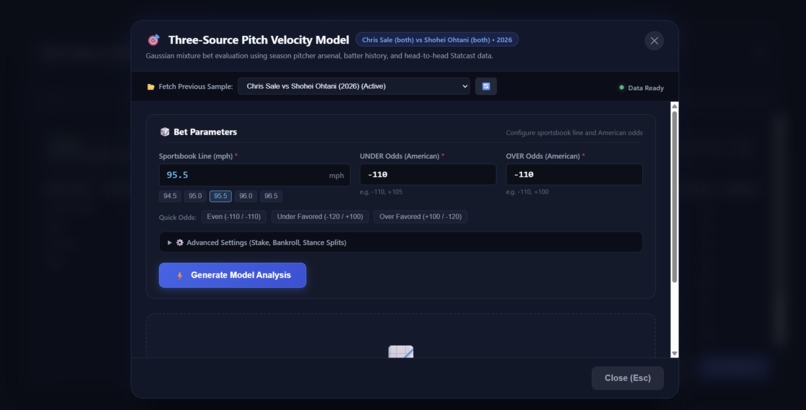
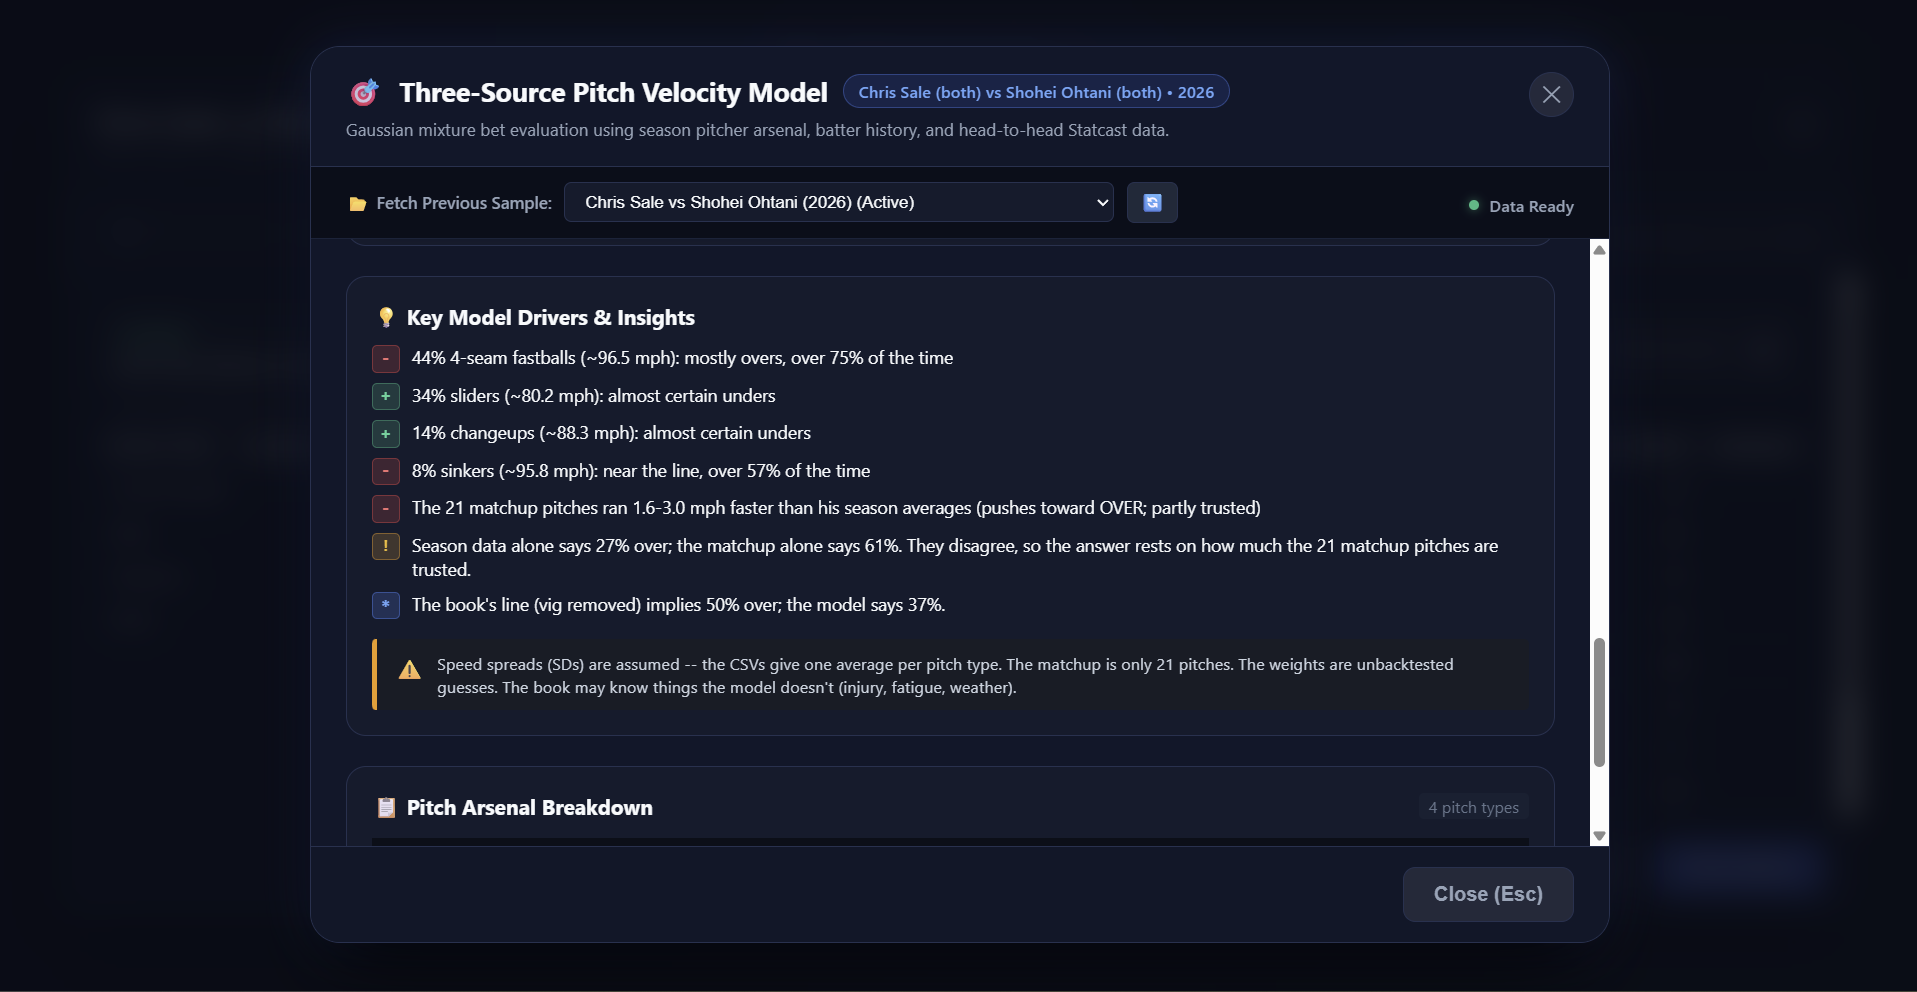
process of the the betting using the model
-
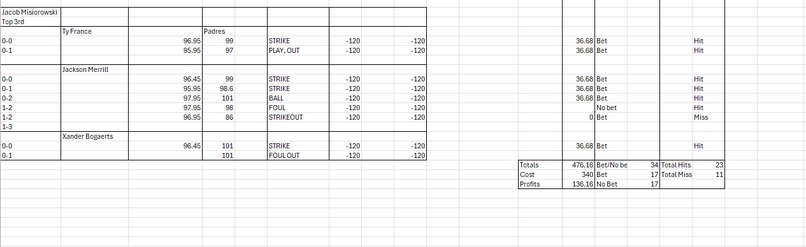
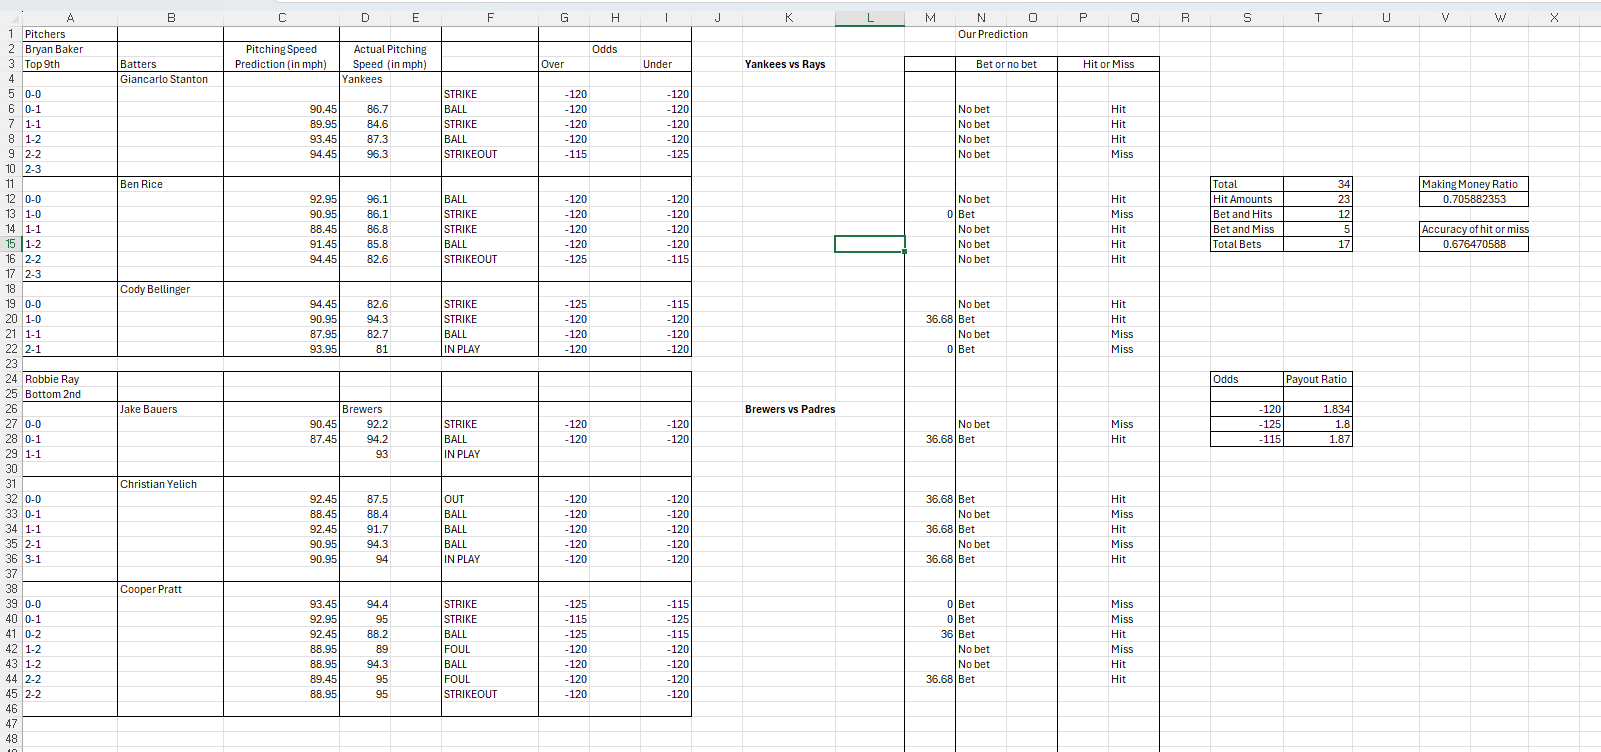
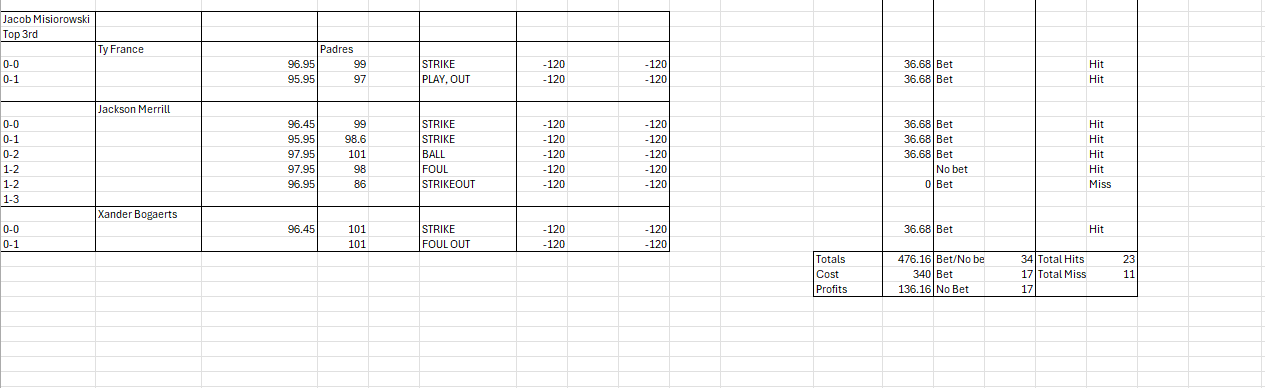
result of the betting using the model
-
-
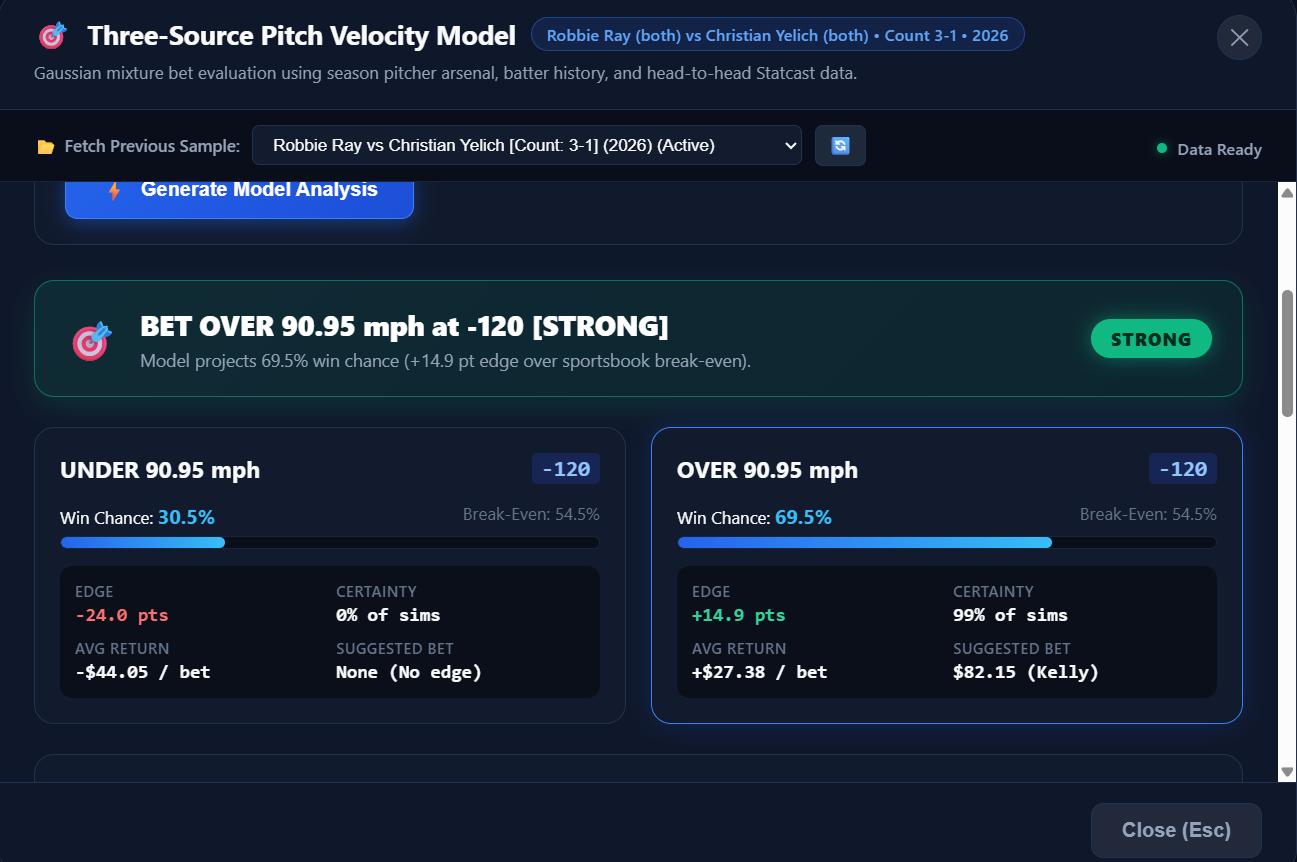
Sportsbooks are built to win. Every line is priced with a built-in house edge, and many bets look far better than they actually are. A growing number of young adults have lost serious money to sports betting, often without understanding the math working against them. We wanted to turn that math around: take on lines set by some of the best mathematicians, engineers, and data scientists in the industry, and build a tool that shows when a bet has a real edge and, just as importantly, when it doesn't. That tool became Pitch Perfect.
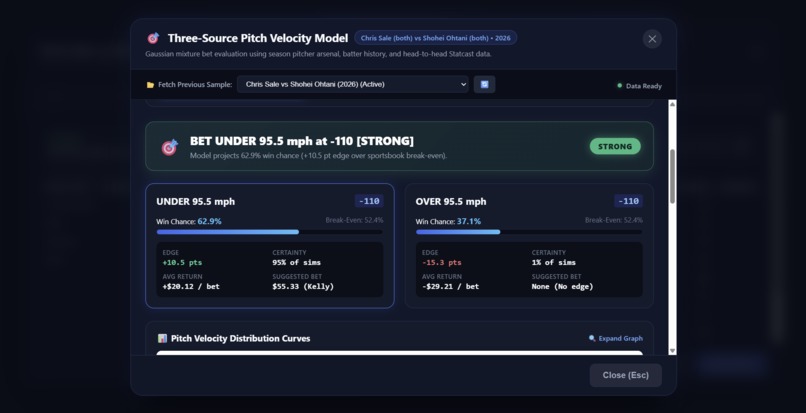
Pitch Perfect analyzes bet365's real-time pitch-speed lines, which let bettors wager on whether the next pitch in an MLB game will be over or under a given velocity. It estimates the probability of each outcome, compares it with the odds the sportsbook offers, and tells you whether the bet is worth making and which side is more likely to pay off.
Baseball is one of the most data-rich sports in the world, and pitch speed turns out to be highly predictable from a pitcher's history and situation. For example, Max Scherzer throws a fastball 86% of the time in a 3-0 count, but only about 30% of the time at 2-2. Since a fastball and a slider can differ by 10+ mph, knowing which pitch is coming tells you a lot about how fast it will be.
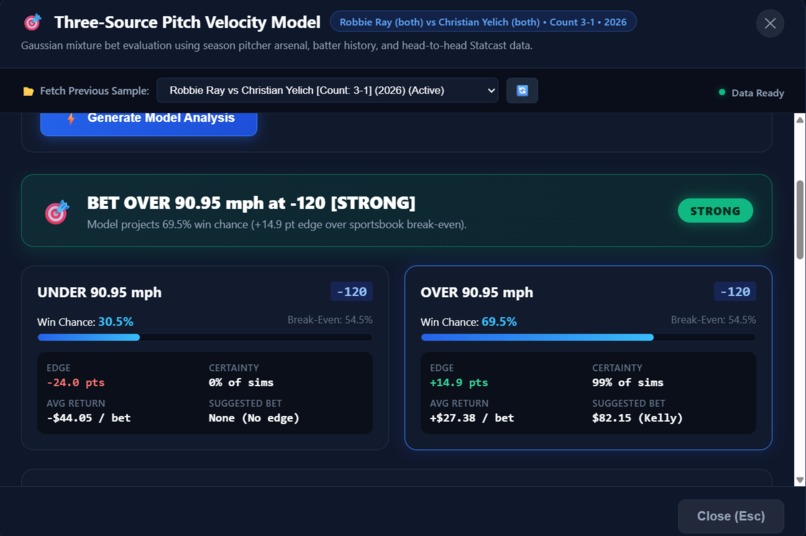
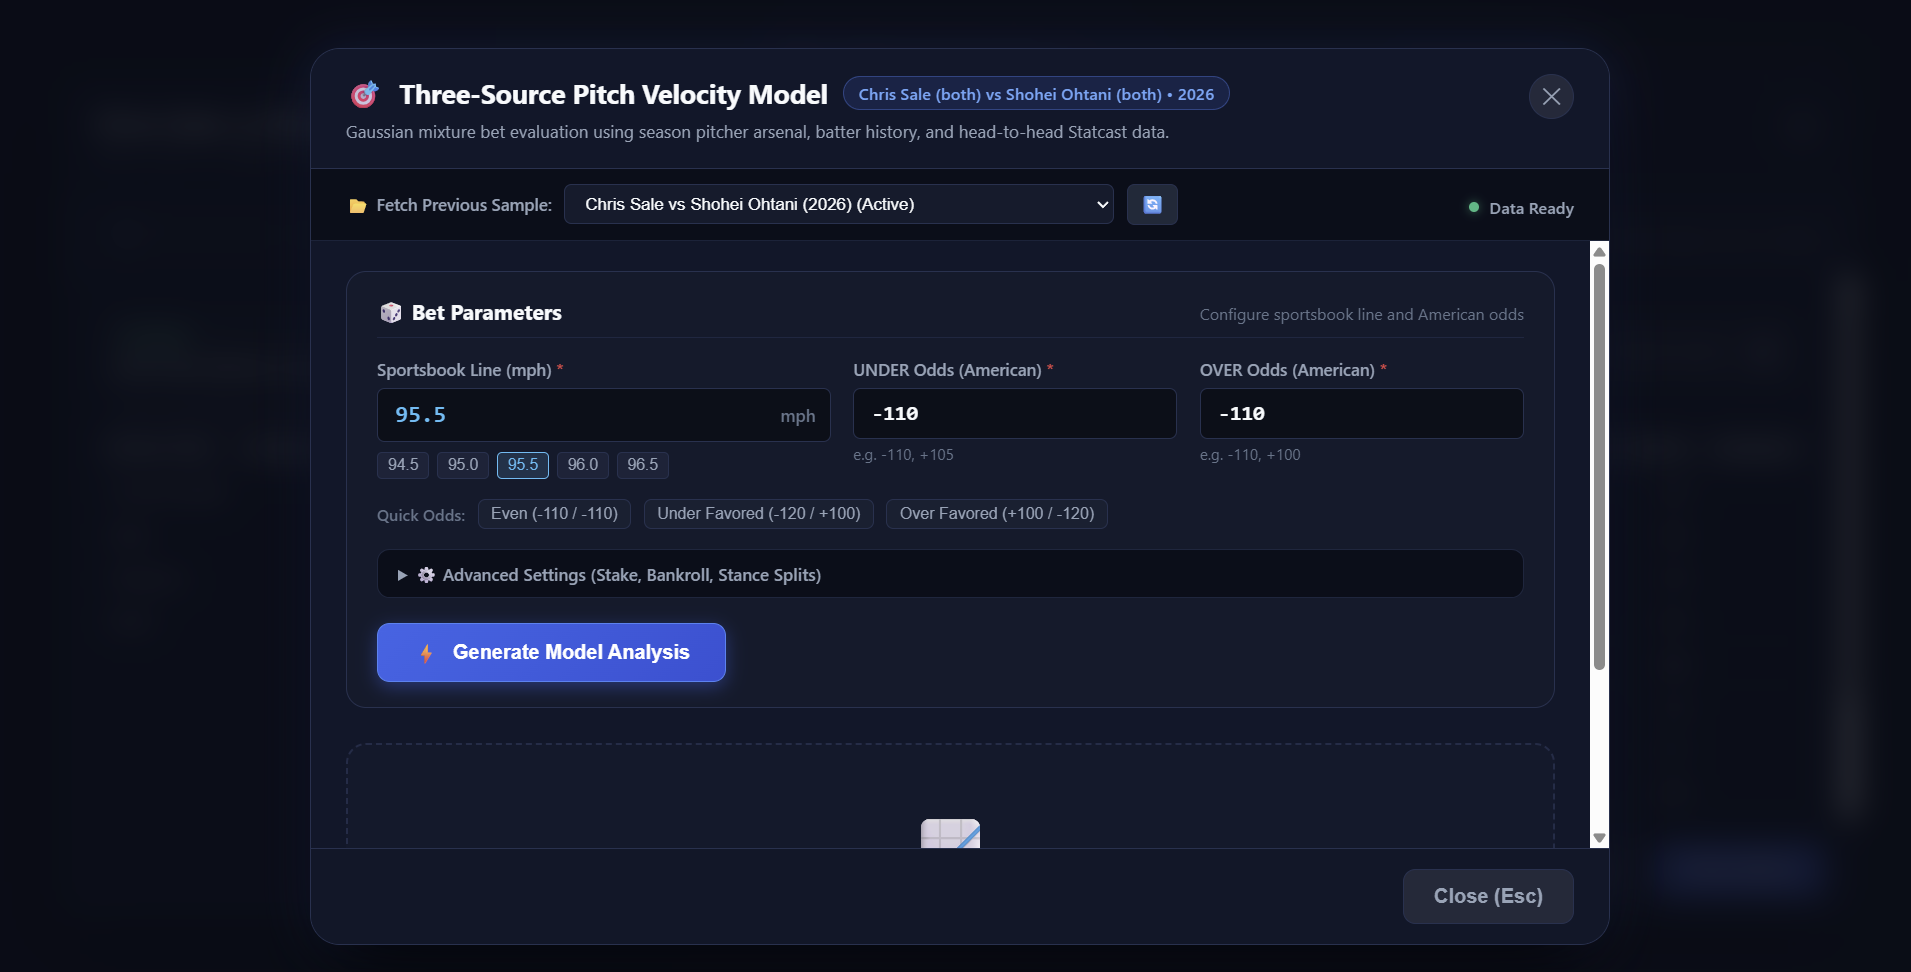
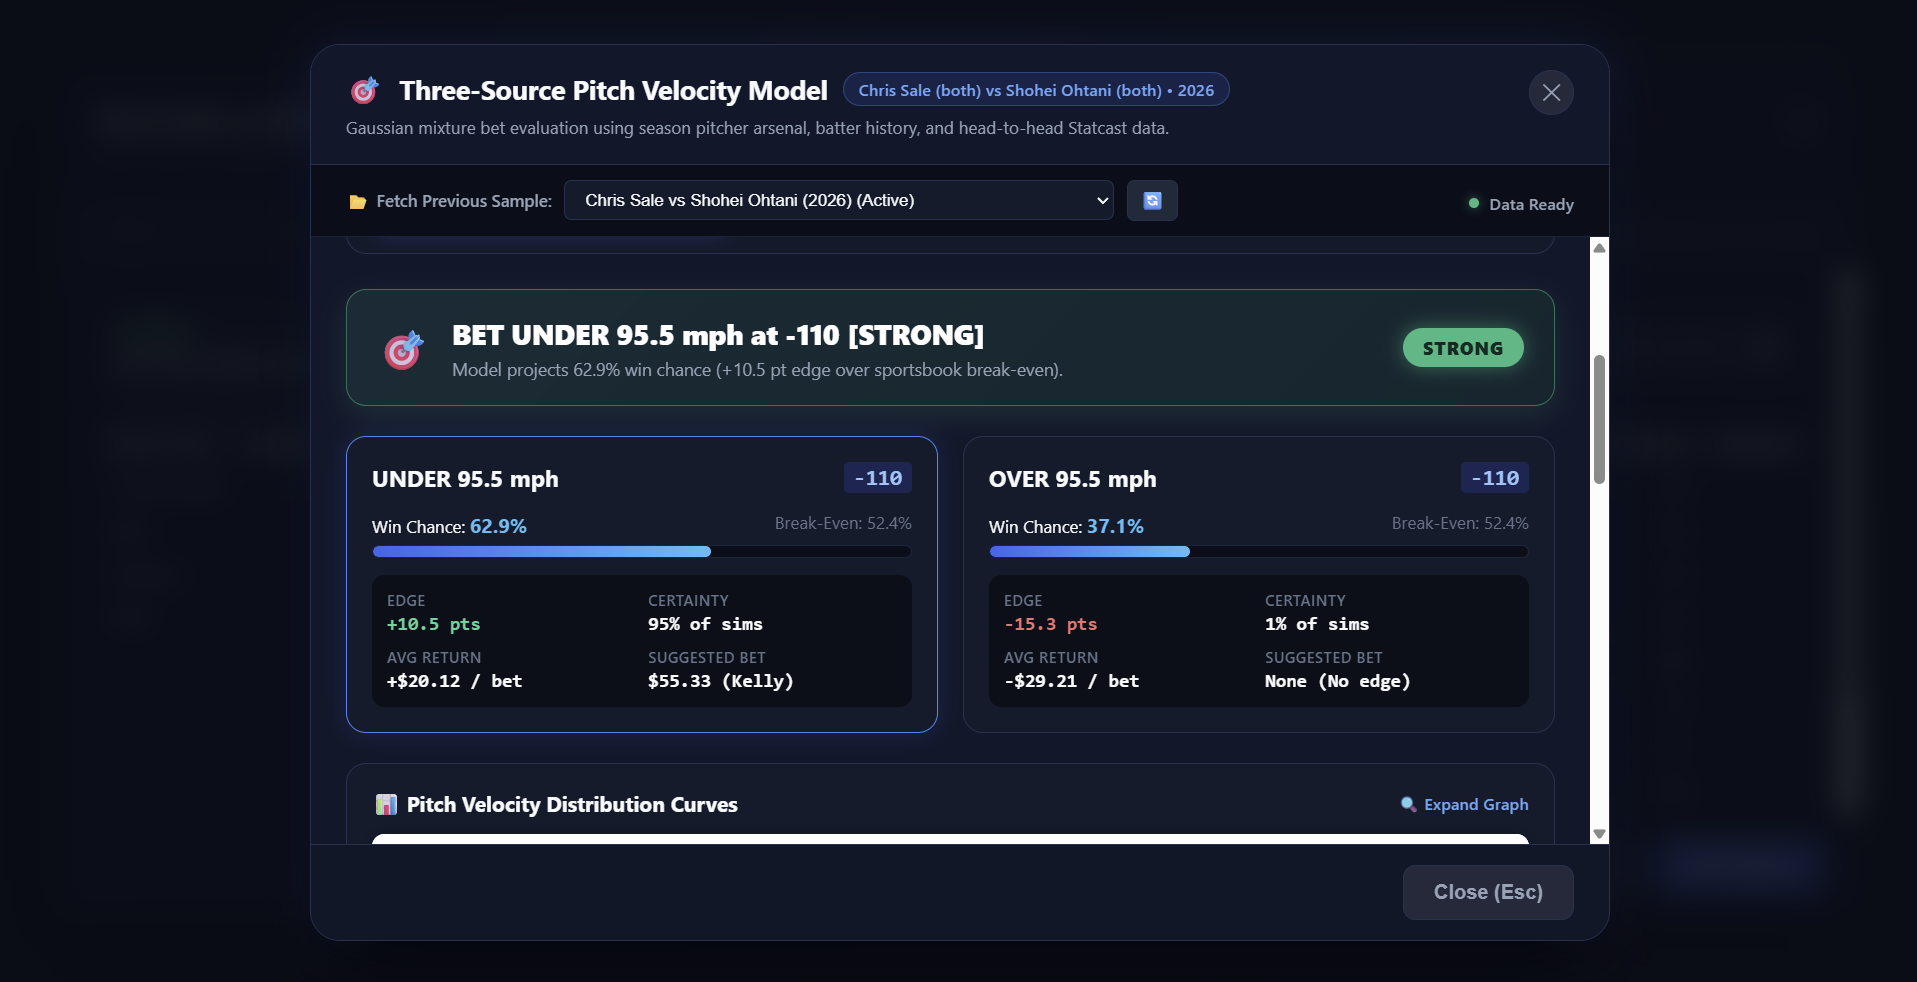
The program converts the sportsbook's odds into the win rate needed just to break even, compares that with our model's probability, and gives each side a verdict: SAFE, MEDIUM, or NOT WORTH IT. When the edge isn't there, it says so.
The project had two parts: an algorithm that predicts the speed of the next pitch, and a data pipeline that pulls the stats it needs from Baseball Savant.
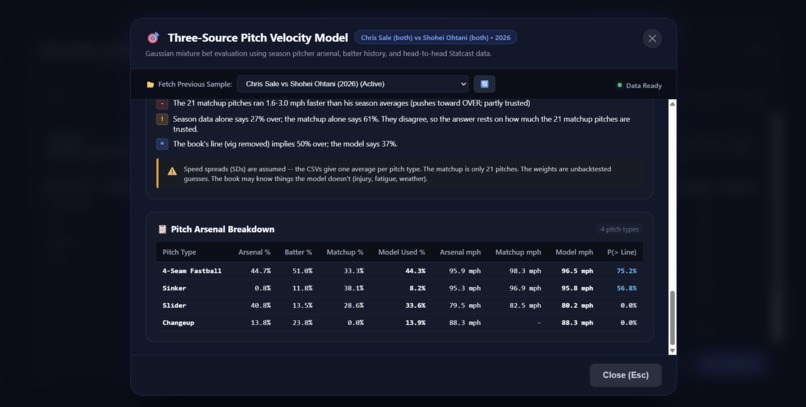
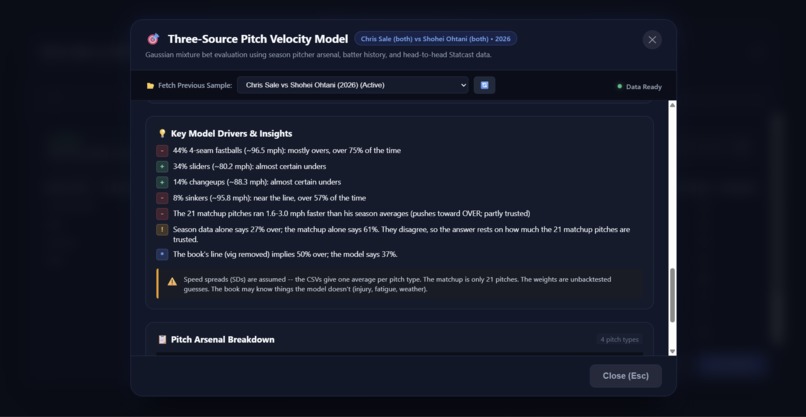
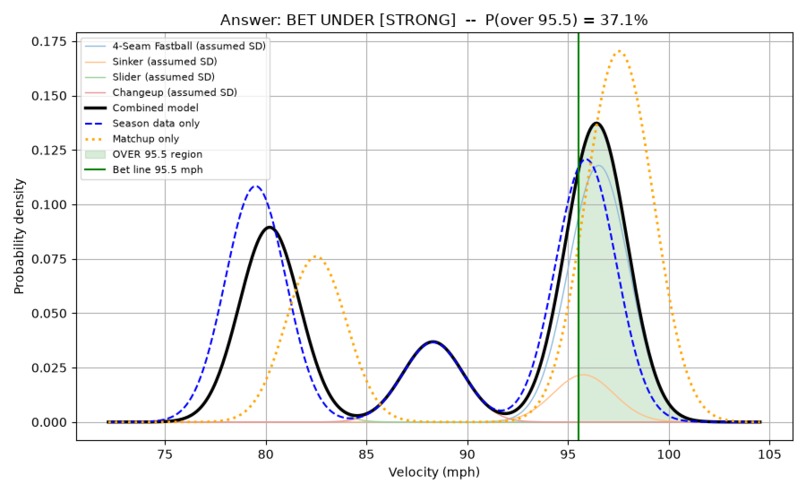
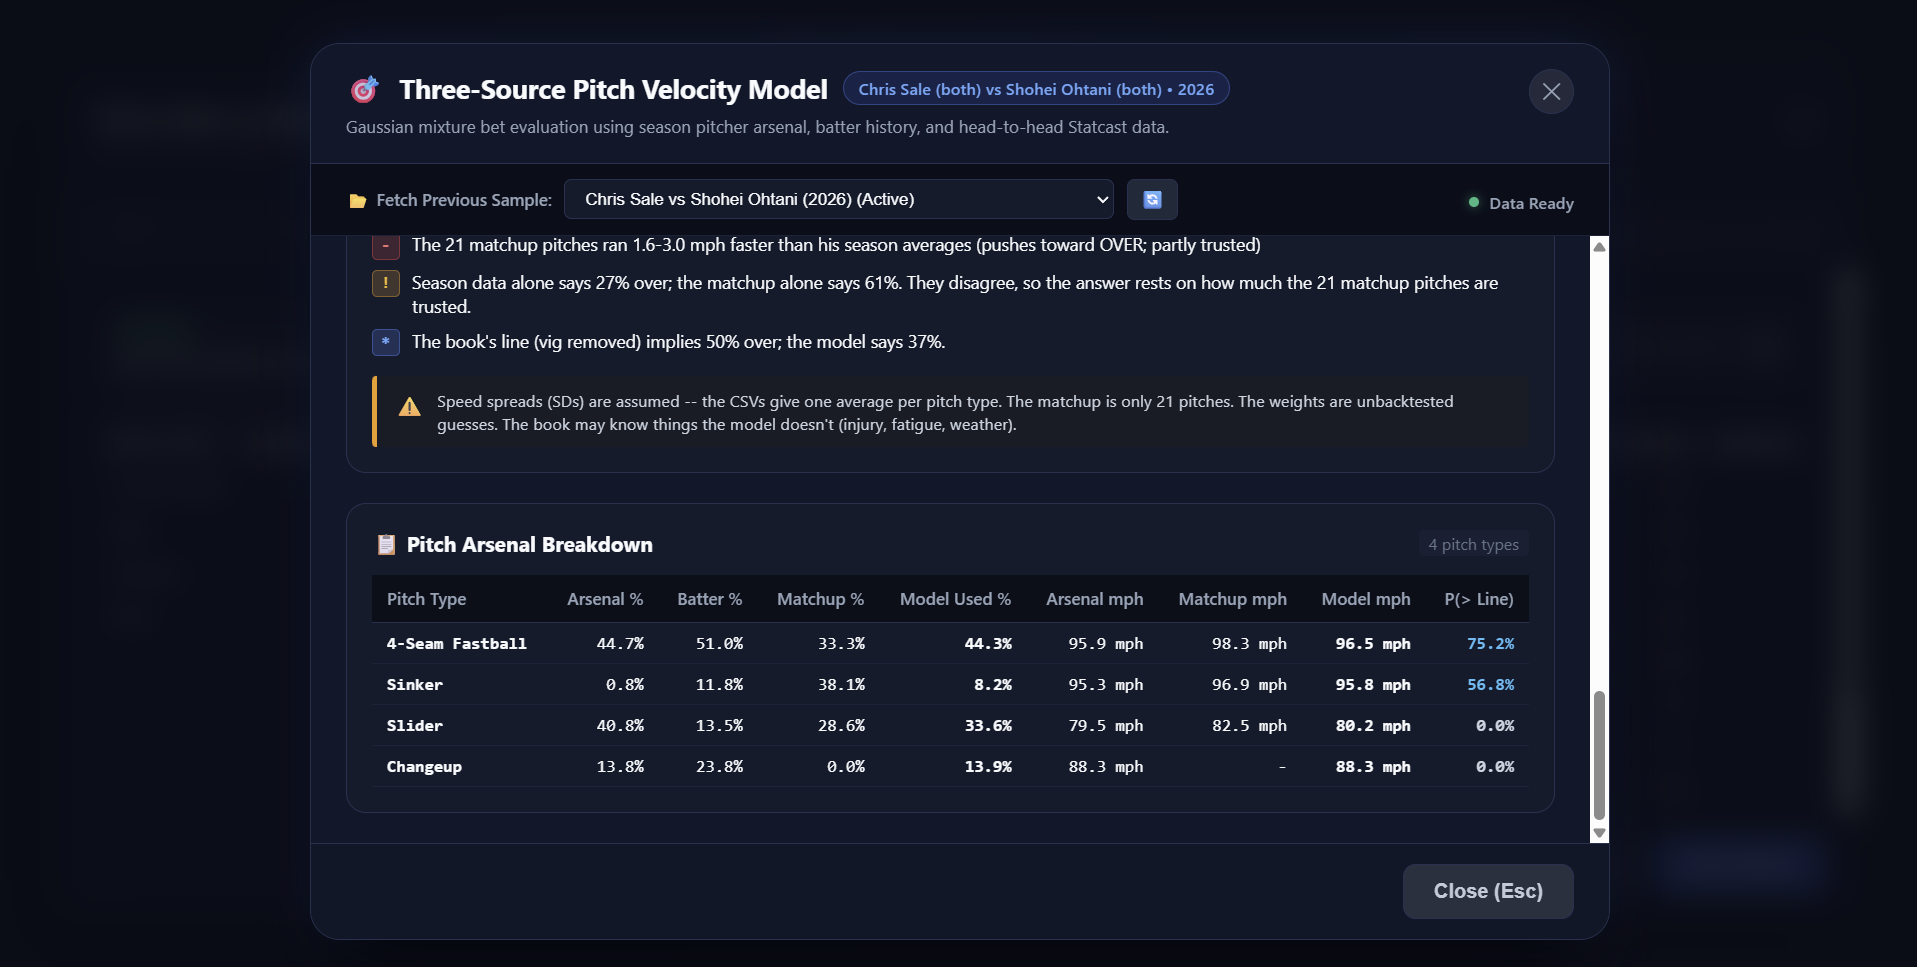
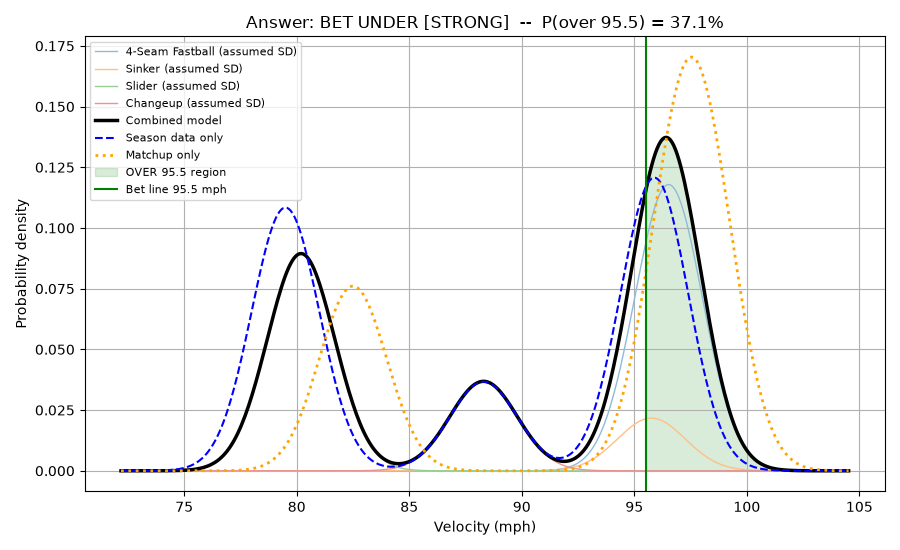
The algorithm starts with a pitcher's arsenal: how often they throw each pitch type and how fast each one is, adjusted for the count. A key insight was that pitch speed doesn't follow a single bell curve. A pitcher who throws 97 mph fastballs and 82 mph sliders almost never throws 88, so the real distribution has separate humps with an empty gap in between. We modeled it as a mixture, one distribution per pitch type, which captures that gap. A single bell curve would put most of its probability exactly where pitches never land, and would steer bettors to the wrong side of the line.
We then layered in matchup data. Pitchers attack different batters differently, so we adjusted the pitch mix based on how pitchers approach the specific batter and how this pitcher has pitched in this matchup. Because some matchup samples are small- sometimes only a couple dozen pitches- the program also measures its own uncertainty by resampling the data thousands of times, and only calls a bet SAFE if it still beats the break-even odds under pessimistic assumptions.
Beating lines set by a professional sportsbook was the hardest part. Early versions lost consistently, and it took many rounds of refining the model before it started finding real edges. In our testing, the system won 70% of its bets and made over $137 in profit.
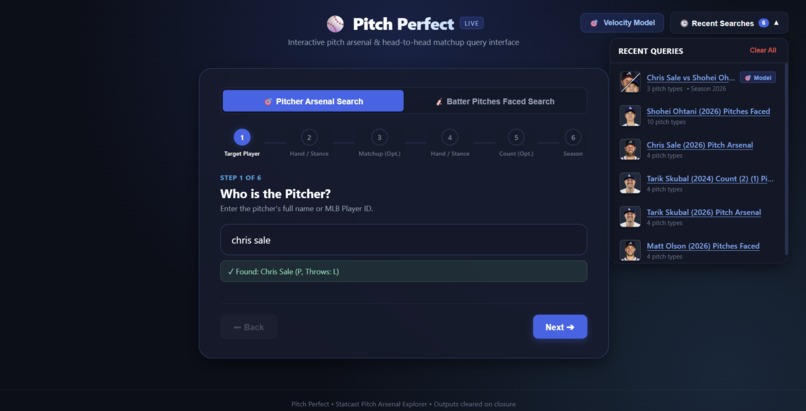
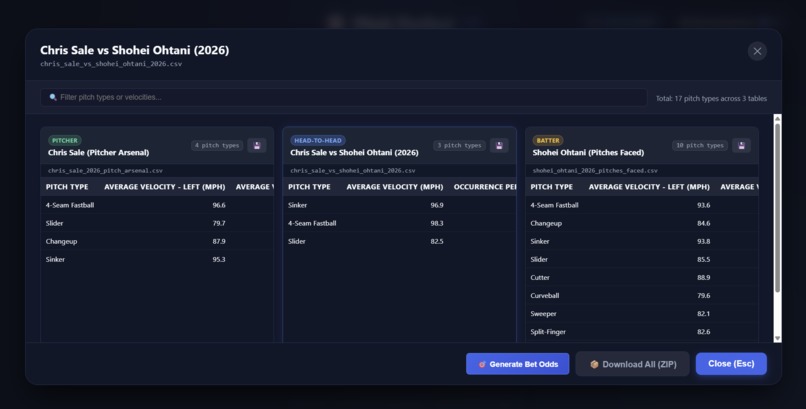
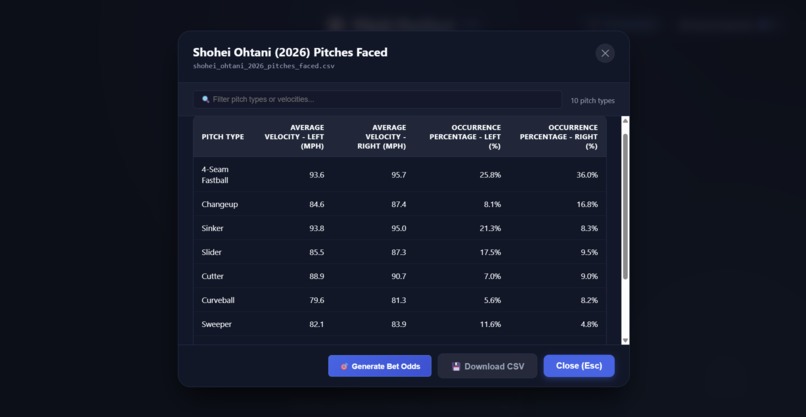
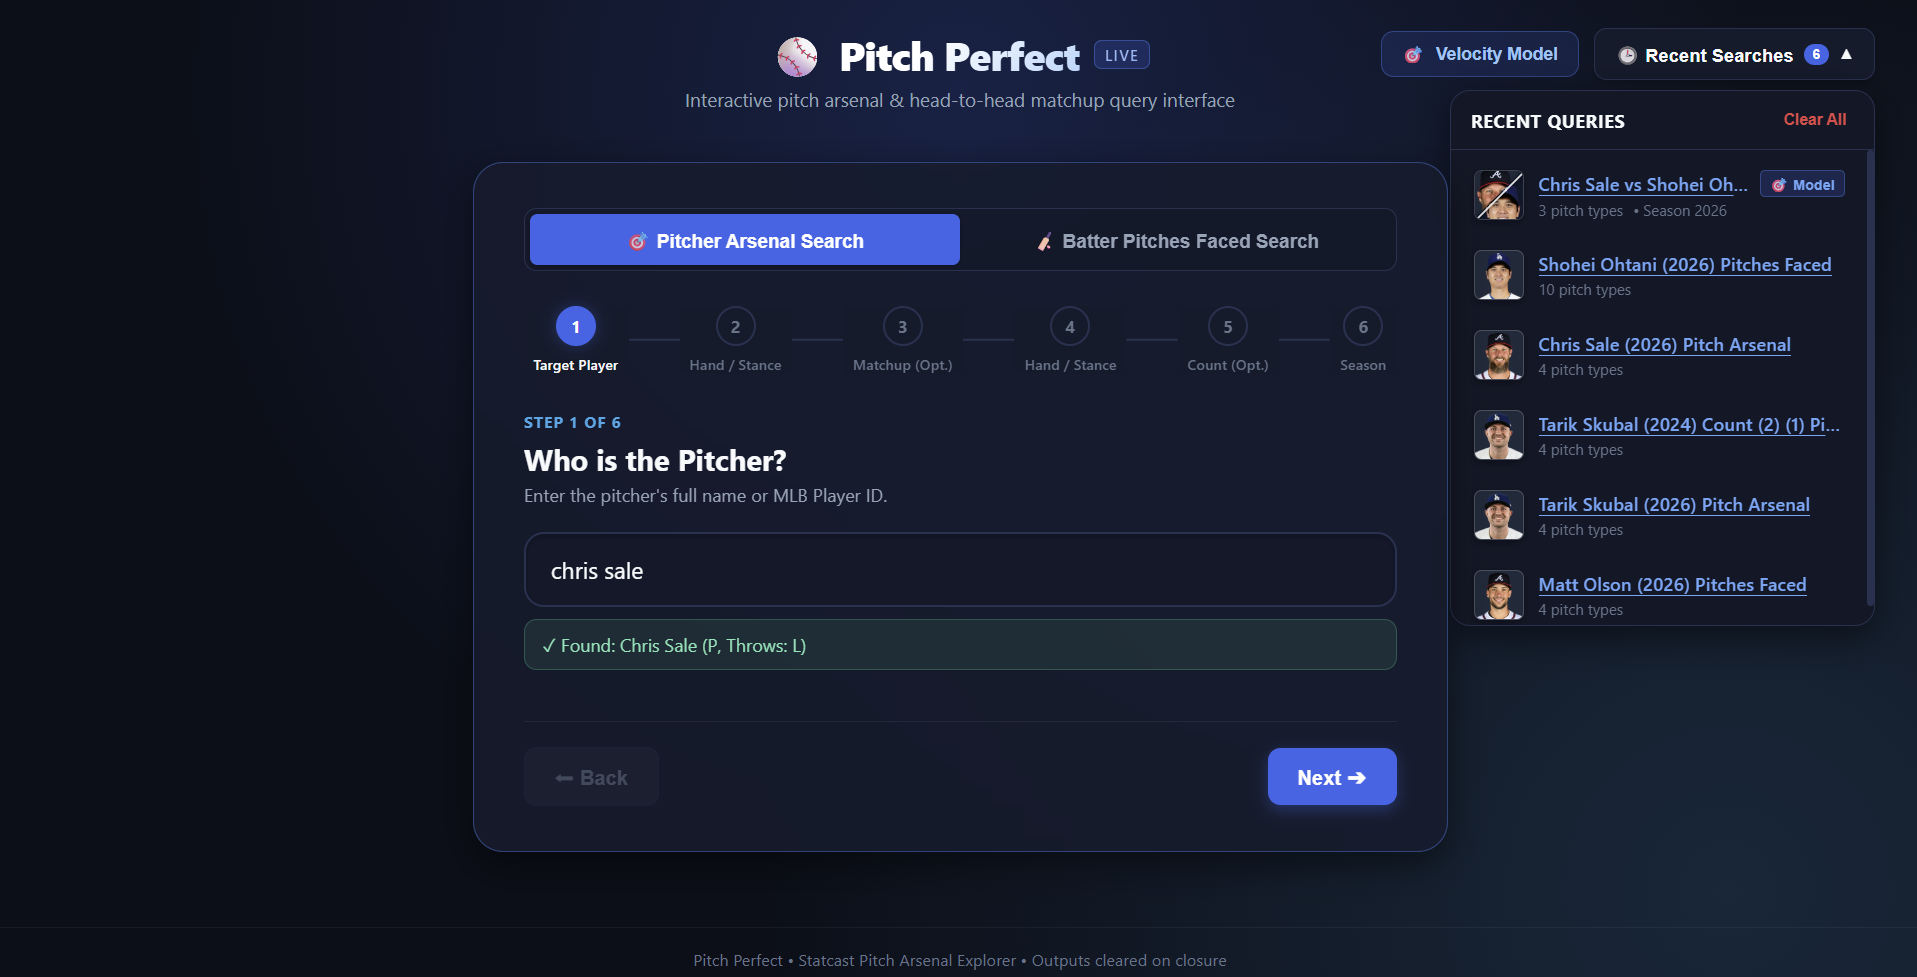
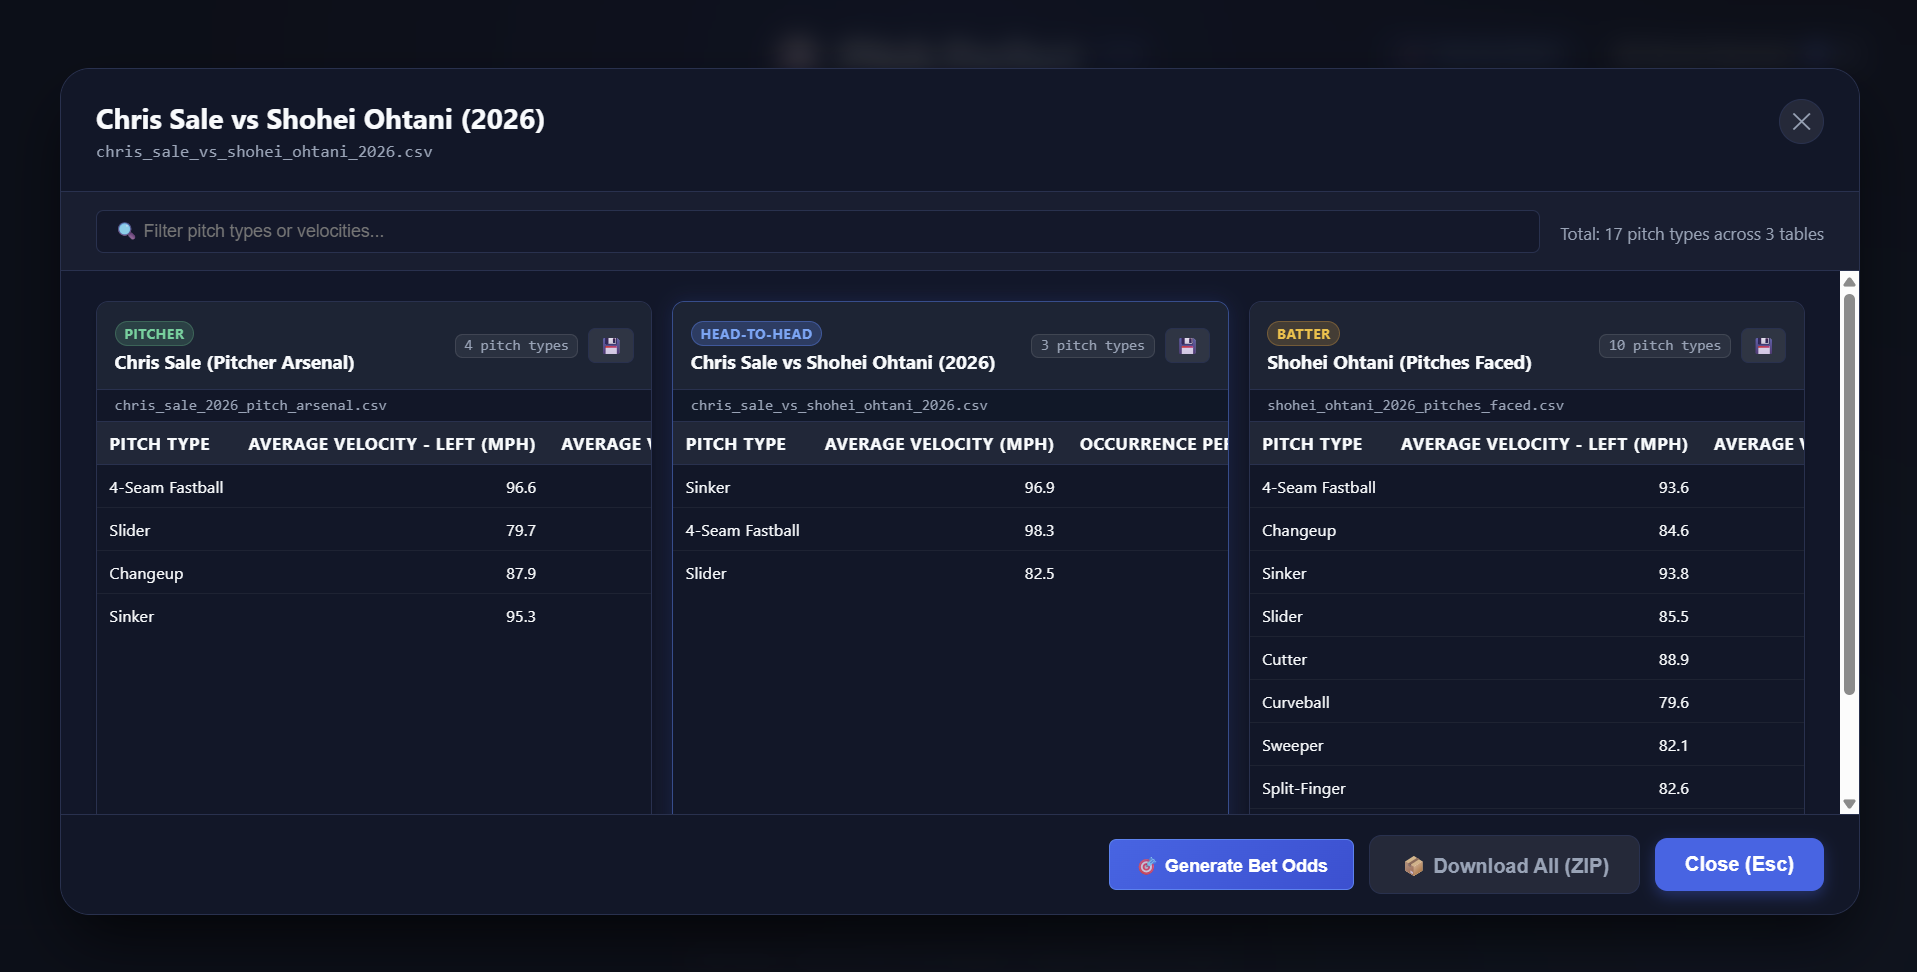
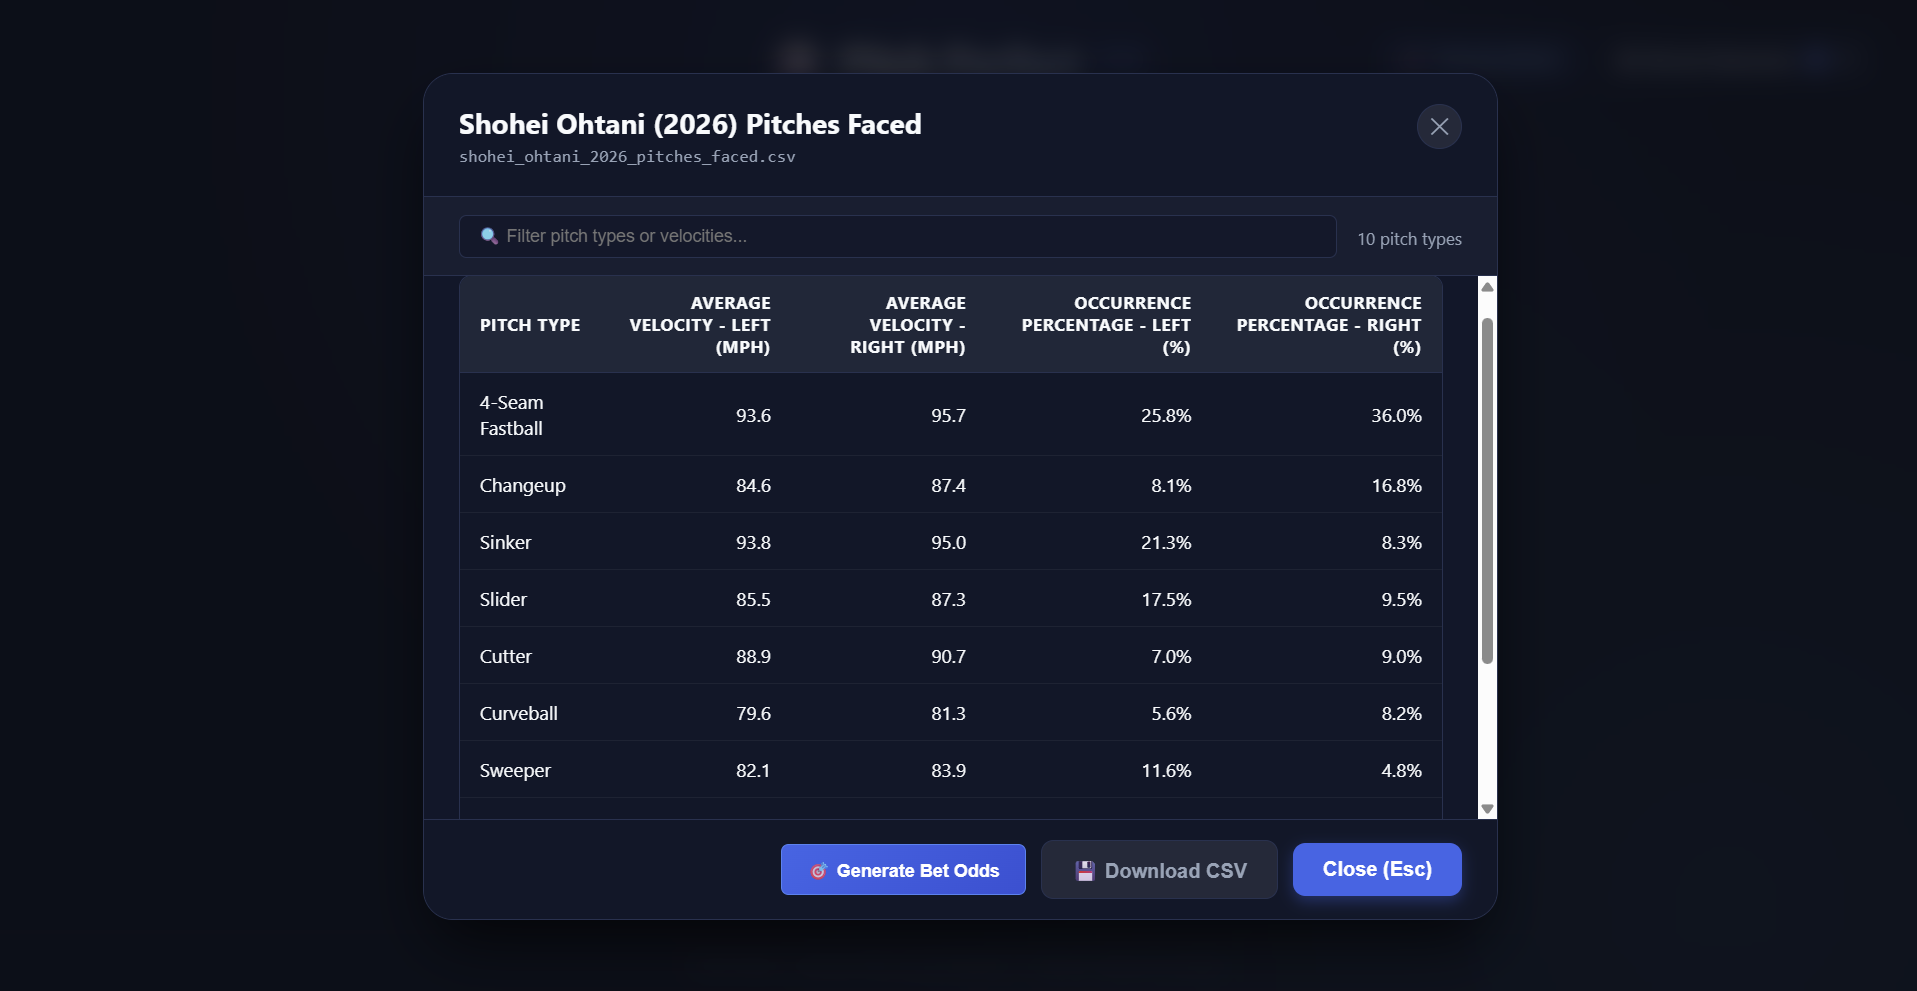
On the data side, we built a scraping pipeline that pulls pitch-level Statcast data from Baseball Savant using Requests and Beautiful Soup, with automatic retries and backoff so a flaky connection doesn't break a search. Players are looked up through the MLB Player Search API, which confirms each player's position and handedness as you type. Scraped results sync automatically into the betting model's inputs: a head-to-head matchup file, the pitcher's arsenal, and the batter's profile against pitchers of the same hand.
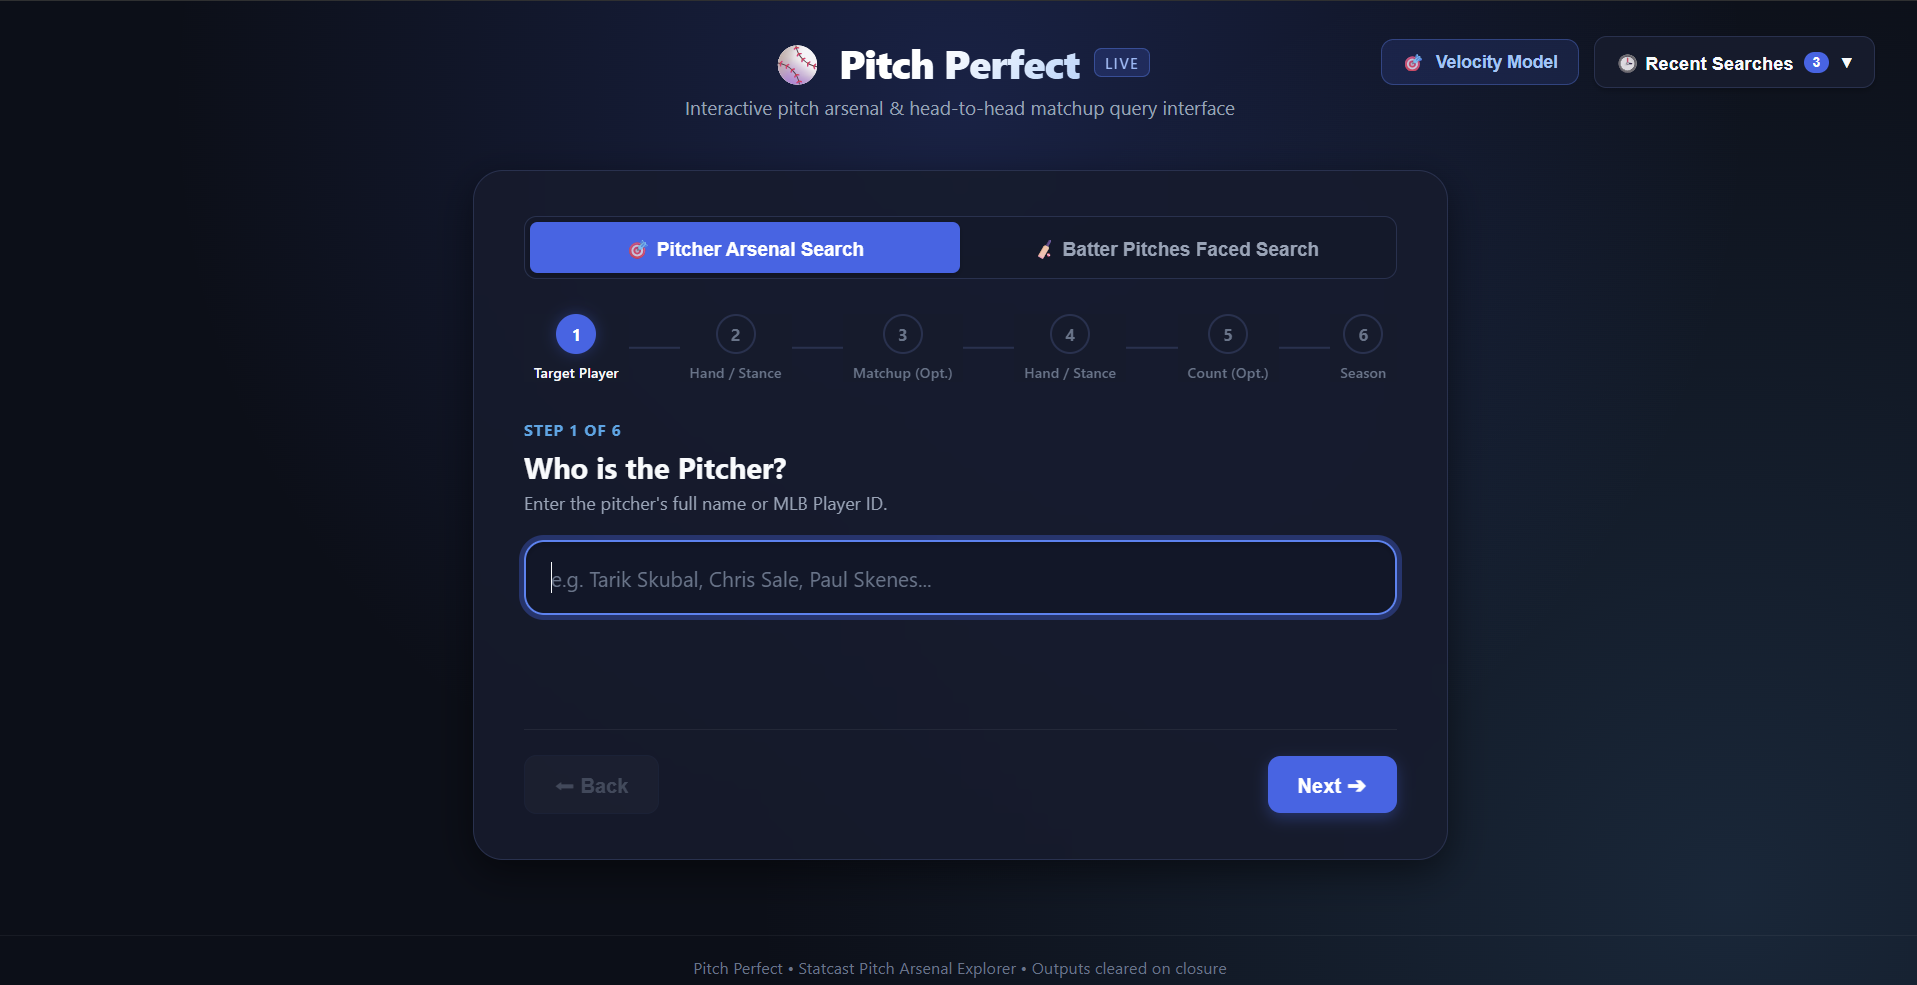
To make all of this easy to use, we wrapped it in a Flask web app with a six-step guided wizard: pick the pitcher, their throwing hand, the batter, the batting stance, and the ball-strike count, then run the analysis. Results open in an interactive table you can search, sort, and download as CSV, and recent searches can be reloaded in one click. For power users, the same queries run from an interactive terminal console or as single command-line calls. We prototyped the model in MATLAB, moved it to Python, and backed the whole system with 102 automated tests.
To get a fair test, we tracked two MLB games played on October 3rd, comparing the sportsbook's lines and odds against our model's predictions. Our system flagged 17 plays as profitable, and it won 12 of them, a 71% win rate. At $20 per bet, that came to $136 in profit. Showing a strong edge over the house.
Despite its edge over the house, Pitch Perfect is still far from the model we imagined. Time constraints forced us to leave out a lot of important data. One major next step is grouping batters into types based on how they hit, which would give us far more data on the pitches thrown against each type, especially for matchups where the head-to-head history is only a few dozen pitches. We also want to factor in what the current model ignores: coaching and game-strategy decisions, the stadium, and weather conditions like temperature and altitude, all of which can affect pitch velocity.
On the interface side, we plan to preload team rosters so users can pick players by browsing a team instead of searching by name, making the whole process faster and more intuitive.
Every new data source makes the model sharper, and there's no shortage of data in baseball. The potential for Pitch Perfect is limitless.
We set out to take on a system designed by some of the most talented mathematicians, engineers, and data scientists in the world, and we won. After many rounds of losing and refining, Pitch Perfect beat the sportsbook's lines, winning 70% of its bets in our testing and finishing with more than $137 in profit. The house always has the edge, until you understand the math better than it expects you to.

Log in or sign up for Devpost to join the conversation.