-

General View
-

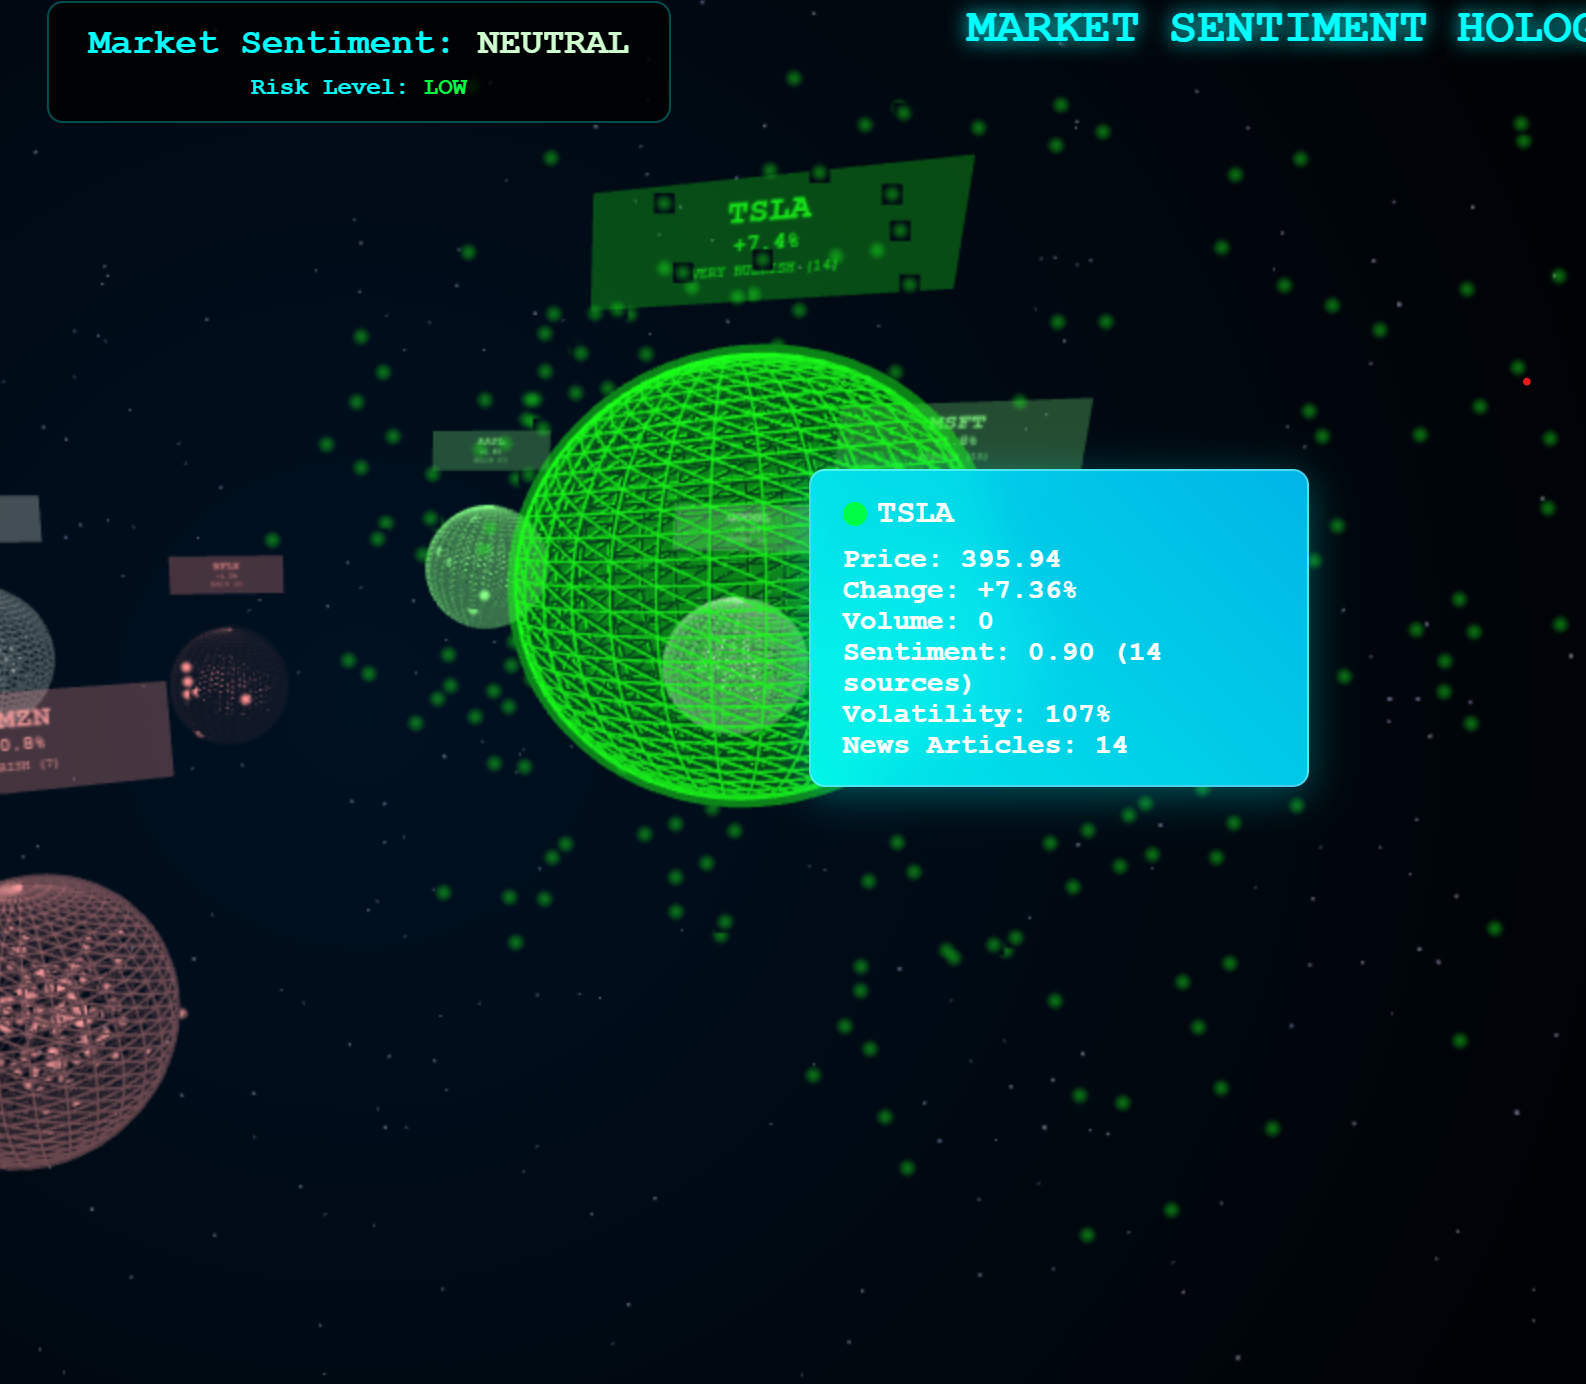
Features when Hovered
-

Taskbar


Inspiration
Seeing stock prices wasn't enough for us and we wanted to dive deeper by visualizing the nuances of stocks that tend to not be noticeable at first glance.
What it does
Stockly gathers real time data on stocks including price, percent change, and volatility. Additionally, it scrapes the internet for recent news articles about the highlighted stock. Using a rigorous algorithm, we computel a sentiment score to reflect the web's opinion of the stock. Furnished through an interactive galaxy UI, the website displays properties of the stock through features such as pulse rate, size, color, and more.
How we built it
We utilized the HTML, CSS, Javascript stack to design our website. With the Finnhub API, we were able to extract real time data about each stock. We also used Python to create a news article webscrape for stocks. We then combined this data and calculated a sentiment score, which reflects how the public currently views the stock.
Challenges we ran into
A lot of the API functions were not free so we were unable to constantly update the website as often as we desired. Additionally, because the market is currently closed, all volume measurements were 0, interfering with our idea of having the number of pulsing particles reflect the volume.
Accomplishments that we're proud of
We are proud of creating a python script that integrates webscraping data into an interactive galaxy UI. Additionally, we're proud of how effectively we visualized stock data-- each property of the stock is able to be visually enunciated through its individual graphic sphere. We also worked hard to ensure our website was interactive and accessible by including features such as zooming in, collapsing sidebars, and informative labels.
What we learned
We learned that it is possible to implement python code into a javascript-based backend. We also learned how to properly adjust styles and visual elements with the collection of data. This was a core feature of our product.
What's next for placeholder
We would like to access intra-daily data of stocks that was unfortunately untestable due to the time frame of the hackathon. We also plan to represent the particles by volume of articles pertaining to a stock, but this feature was unable to implemented given our constraints due to the paywall behind Finnhub's API. Finally, more features could be implemented in our website such as toolbars displaying "hot" stocks, insider data, and the ability to visualize other financial instruments beside stocks (i.e. crypto, bonds).
Built With
- api
- claude
- css
- cursor
- html
- javascript
- python


Log in or sign up for Devpost to join the conversation.