-
-
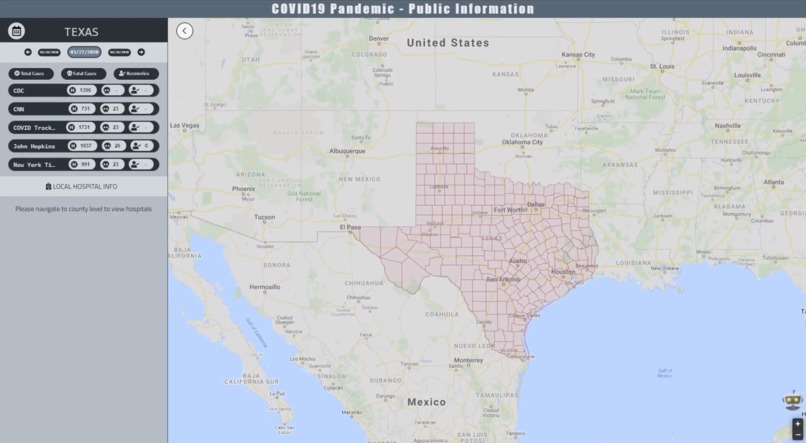
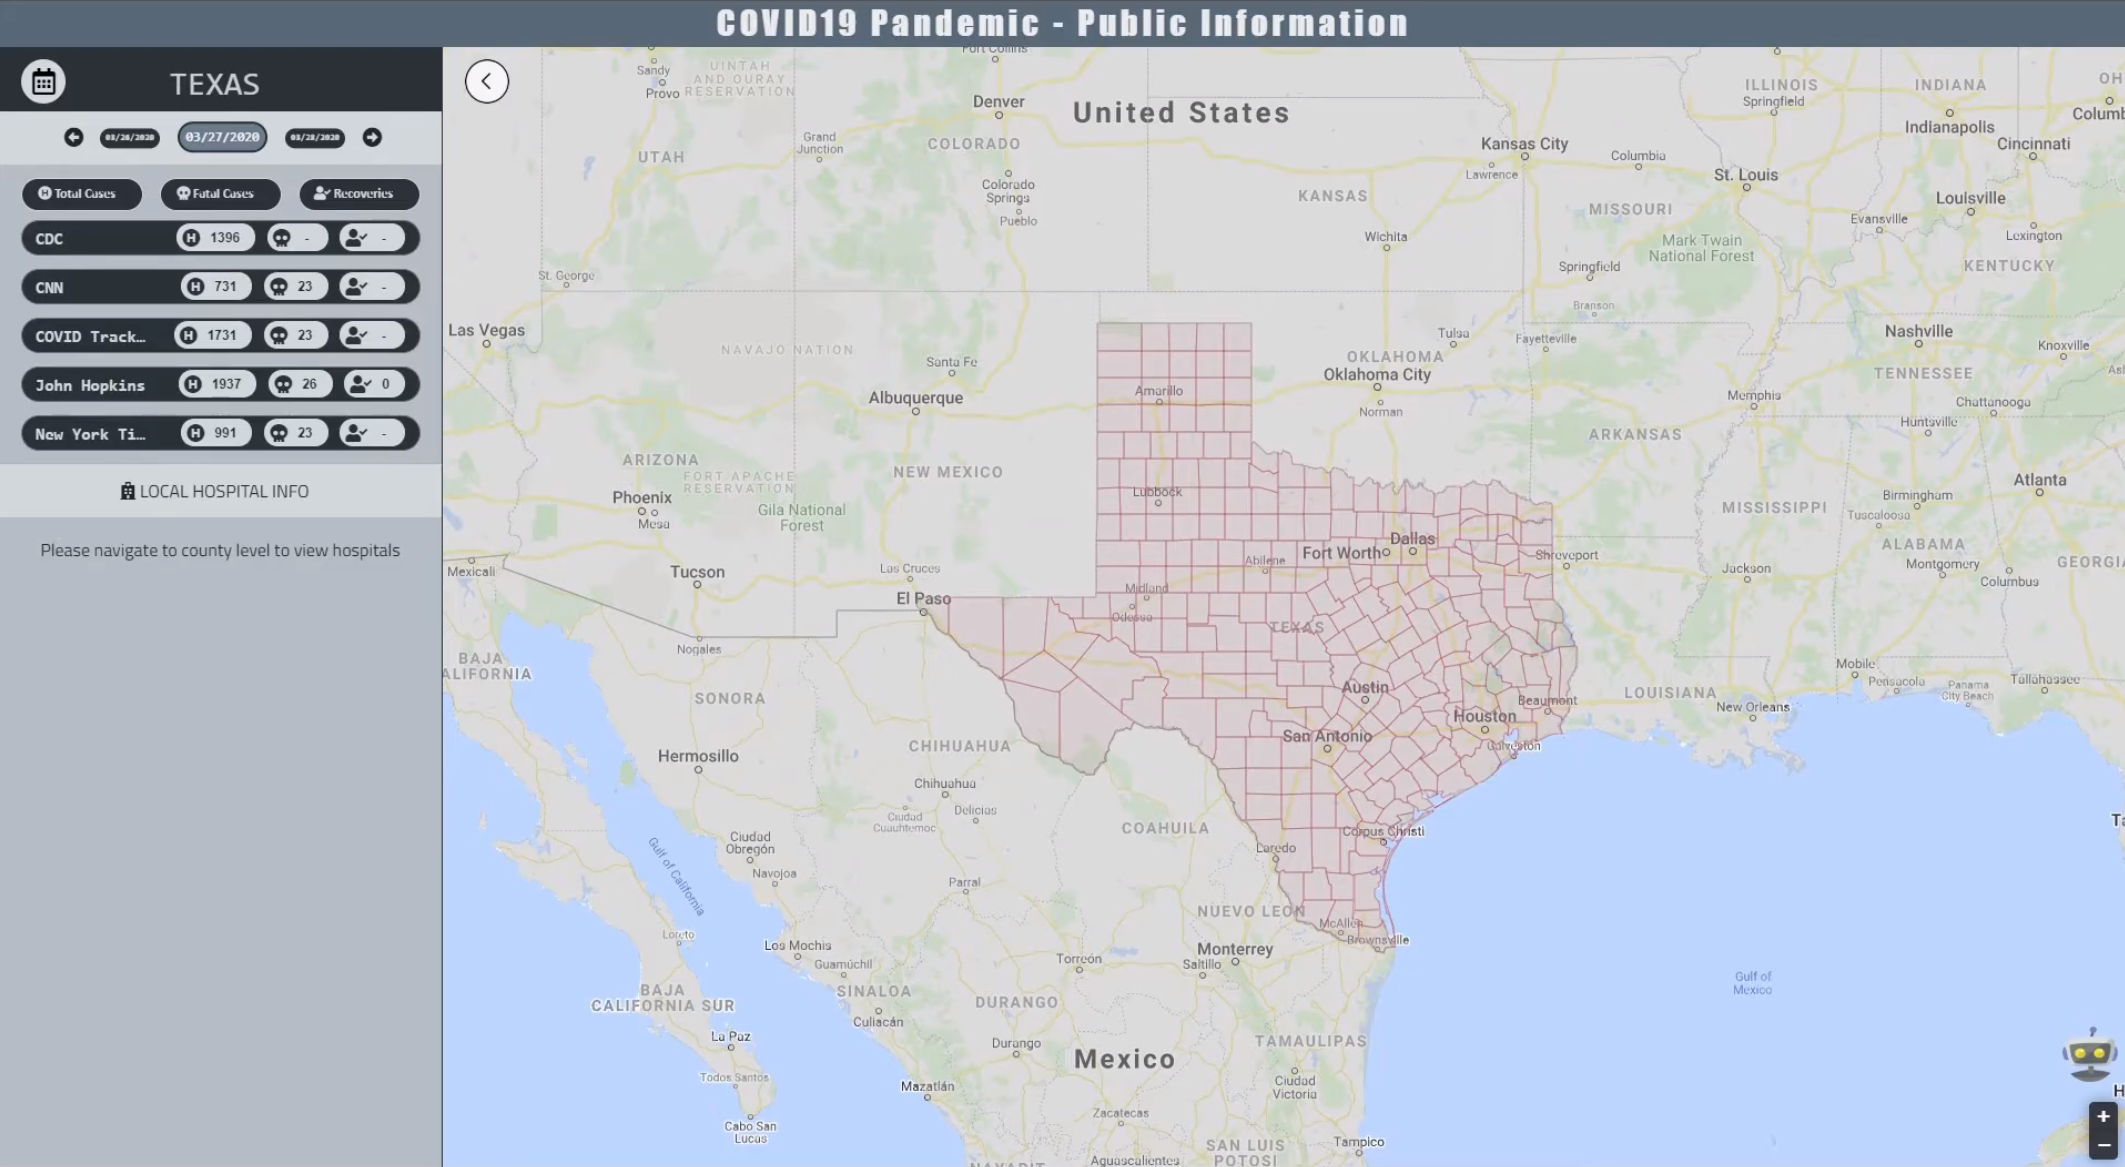
Basic view
-
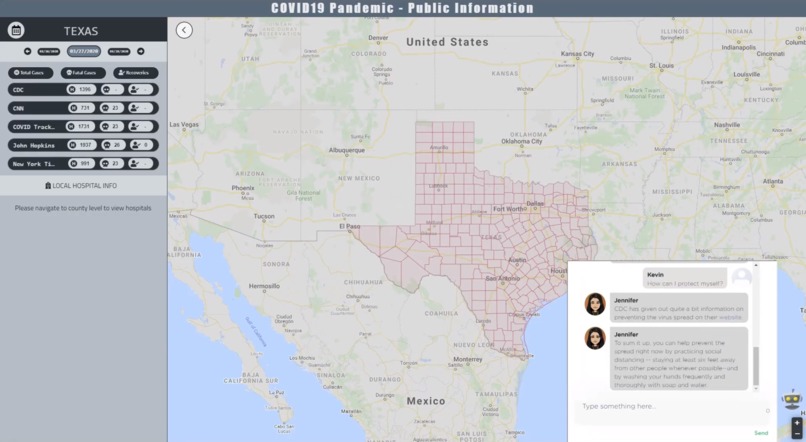
Chatbot integration.
-
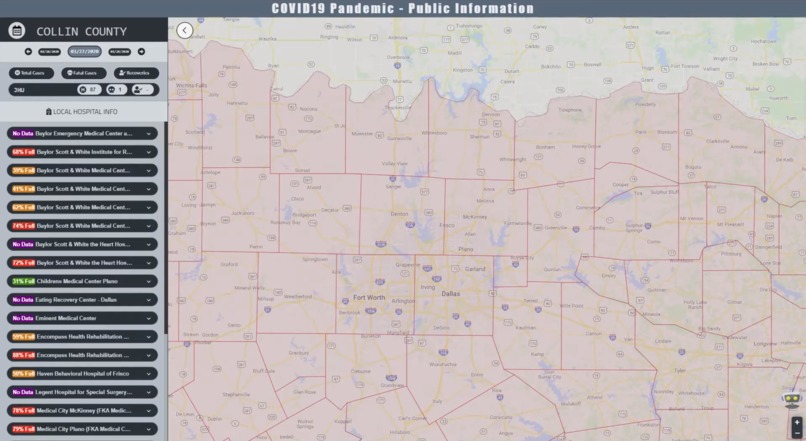
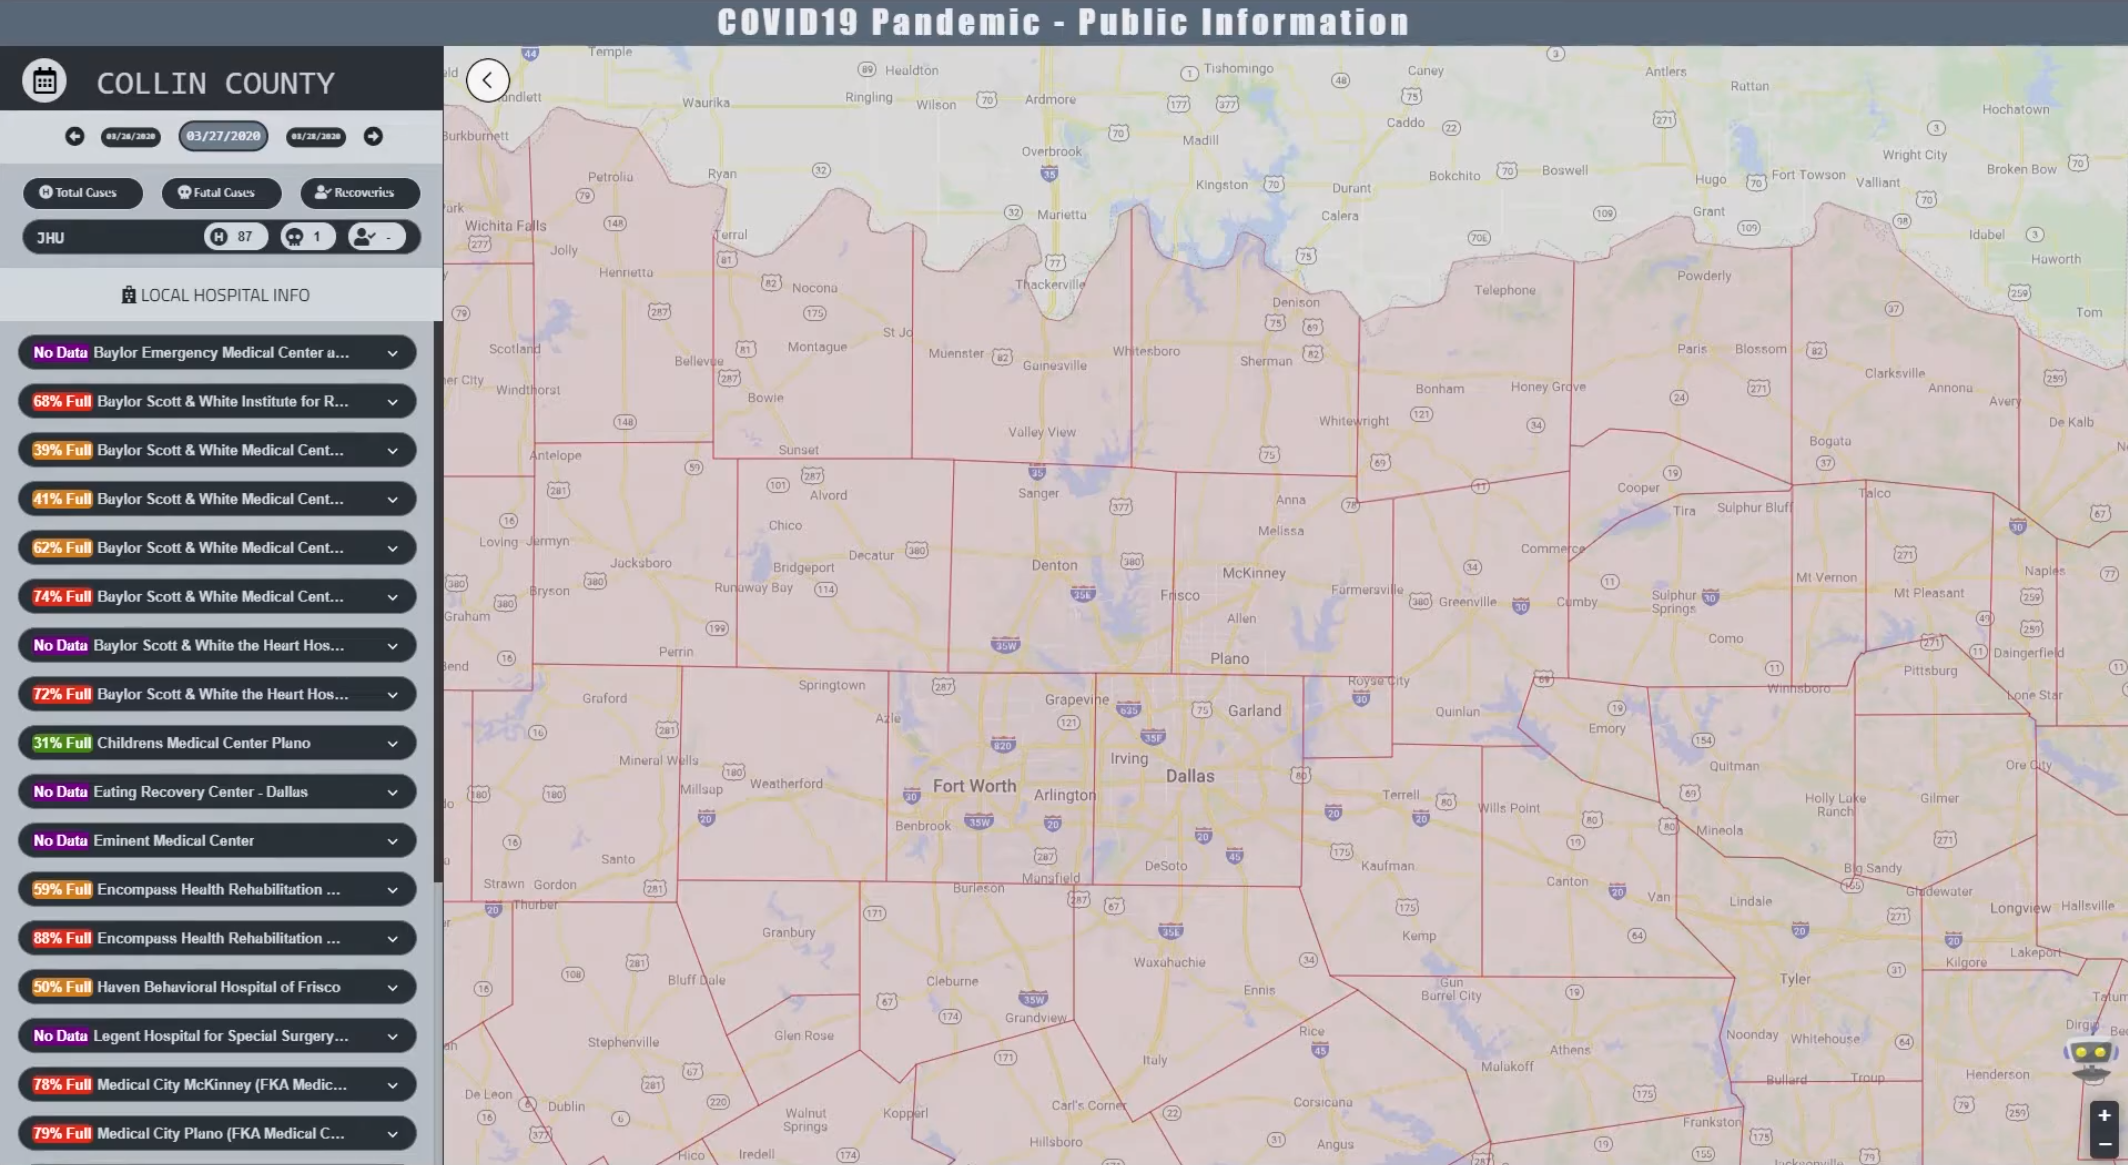
List of Hospitals
-
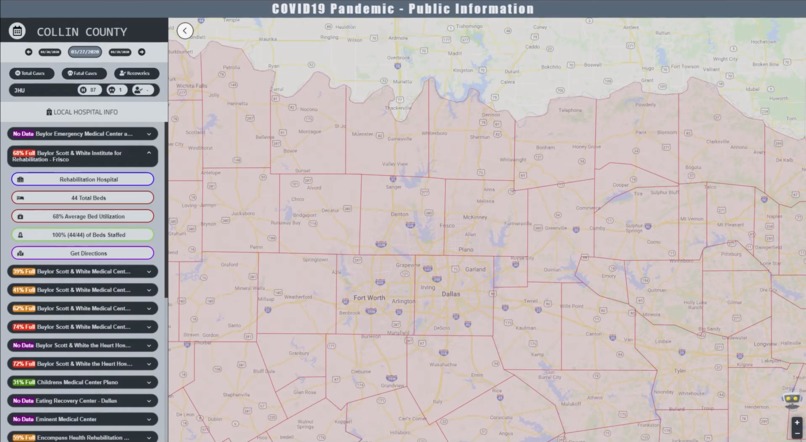
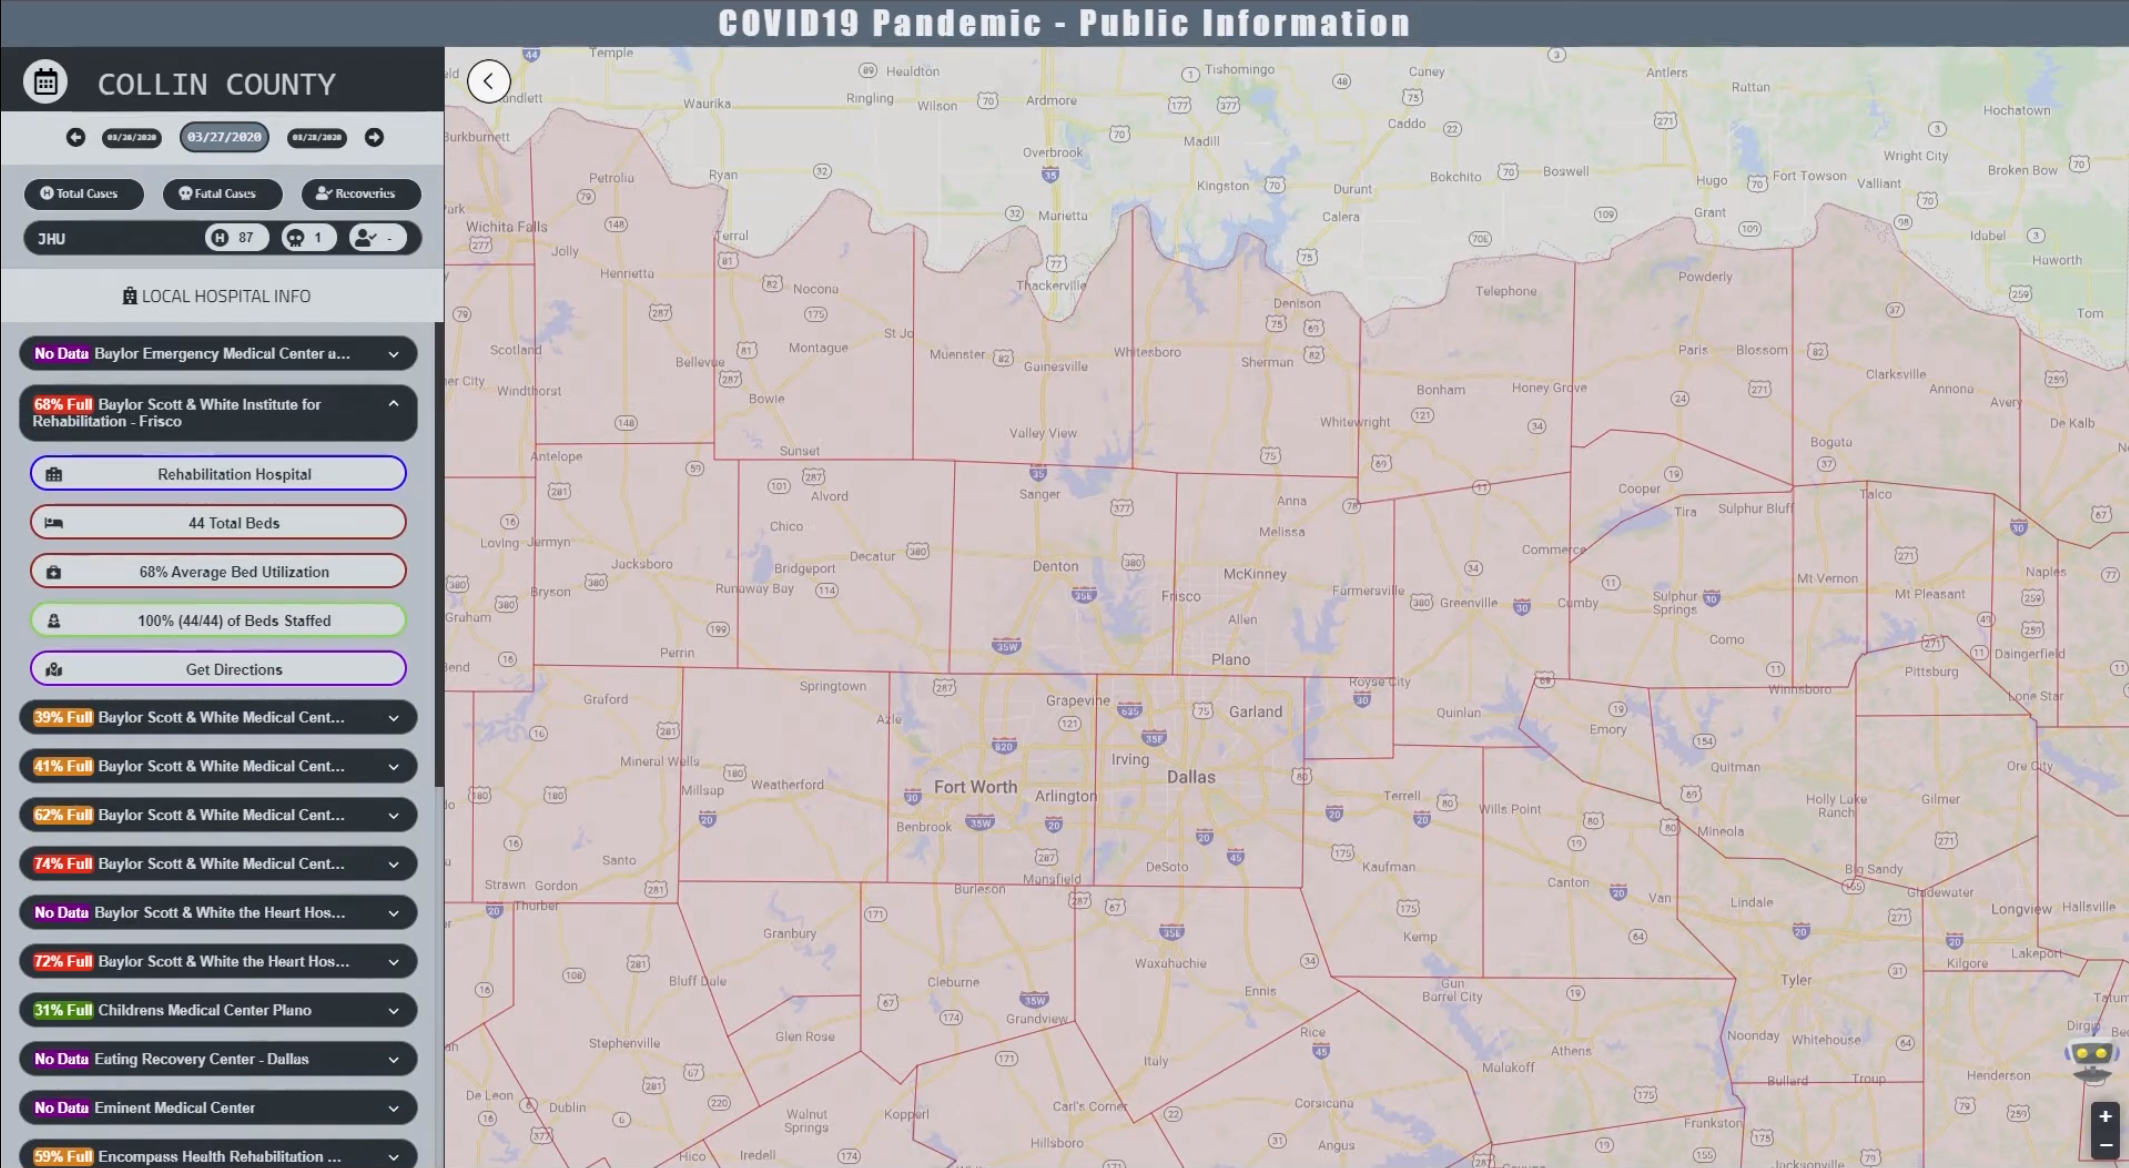
Hospital Information

Inspiration
With COVID19 being such a prominent part of our lives now, several of us from our team grew concerned about how it would impact those most vulnerable in our families. This uncertainty was further fueled by a lack of consensus of the numbers being reported from different sources, from WHO to local news networks. This project is about helping people understand what different sources are saying and reporting with respect to the important COVID19 numbers: total cases, deaths, and recoveries as they are relevant to them, as an individual. It's about giving people the tools to be informed and cast away at least some of their doubts with this knowledge.
What it does
Our project helps people to see how COVID19 is affecting areas they are interested in and helps them to cross-reference that information across various sources to look for consensus at different levels. Our data currently includes country-level, state-level, and county-level statistics.
How we built it
Our team has collected and prepared data that we used to render the dashboard mostly through DOM manipulation, jQuery, d3.js and leaflet.js. For collecting the data we have Python scraper scripts which run three times a day to collect data from five different and credible sources.
Challenges we ran into
Processing the data and converting that data into UI elements that are intuitively understandable has been challenging. There have also been many challenges in creating a responsive UI that users can easily navigate, and even now we continue to iterate on our work. With respect to the data, updating the data collection scripts regularly in accordance with changes in the five data sources has kept us on our toes. As the situation evolves many places also change what and how they report, so a lot of our work needs amending from time to time.
Accomplishments that we're proud of
Being able to integrate different sources of COVID19 data with an interactive map, and using GIS data to tie it all together has been a great accomplishment for us. We have also taken care that when we collect data from our five different credible sources we preserve a unified format that is easy to digest (our dataset).
What we learned
From this experience our different members have further expanded their web development and data preparation and presentation toolboxes. Our members have also gained more knowledge about dynamic web-page scraping, in addition to automatic data collection and processing hacks that are reusable and applicable to a wide spectrum of projects. Overall, it has been a very enriching experience for our team.
What's next
Our research lab is actively developing this project to add more novel features. Next we will work on integrating social media data to see how people are obeying (or disobeying) shelter in place orders and perform other interesting social network analyses! We will also help combat misinformation using a compiled list of fact-checks that can be integrated as question-answer pairs with our chat-bot.


Log in or sign up for Devpost to join the conversation.