-
Overview
-
Fridge and Generator Detail
-
Capability
-
Data
-
Docs
Inspiration
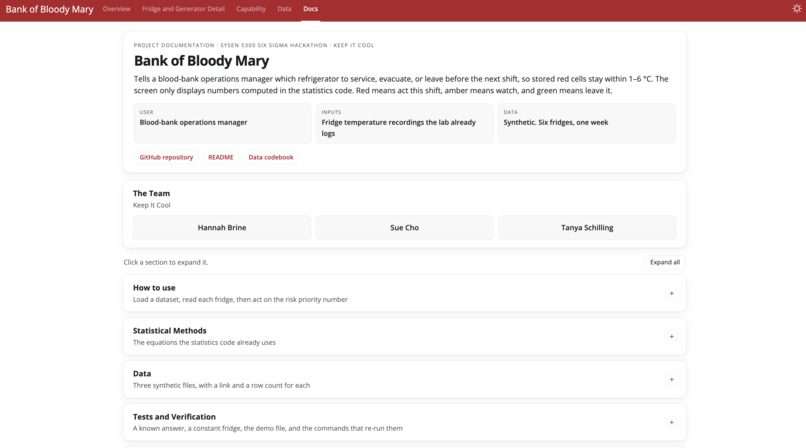
A blood bank loses valuable donated blood units when a refrigerator drifts out of its 1–6 °C range. By the time a reading crosses that line, the bags may already be compromised. This app will show an operations manager which fridges need immediate attention, which to keep an eye on, and which are stable.
What it does
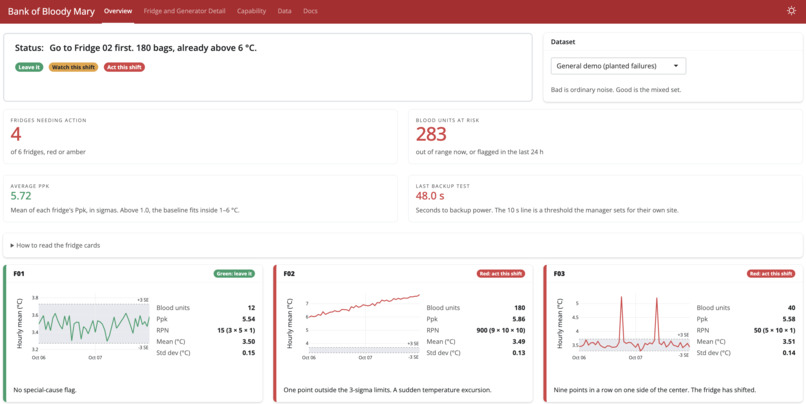
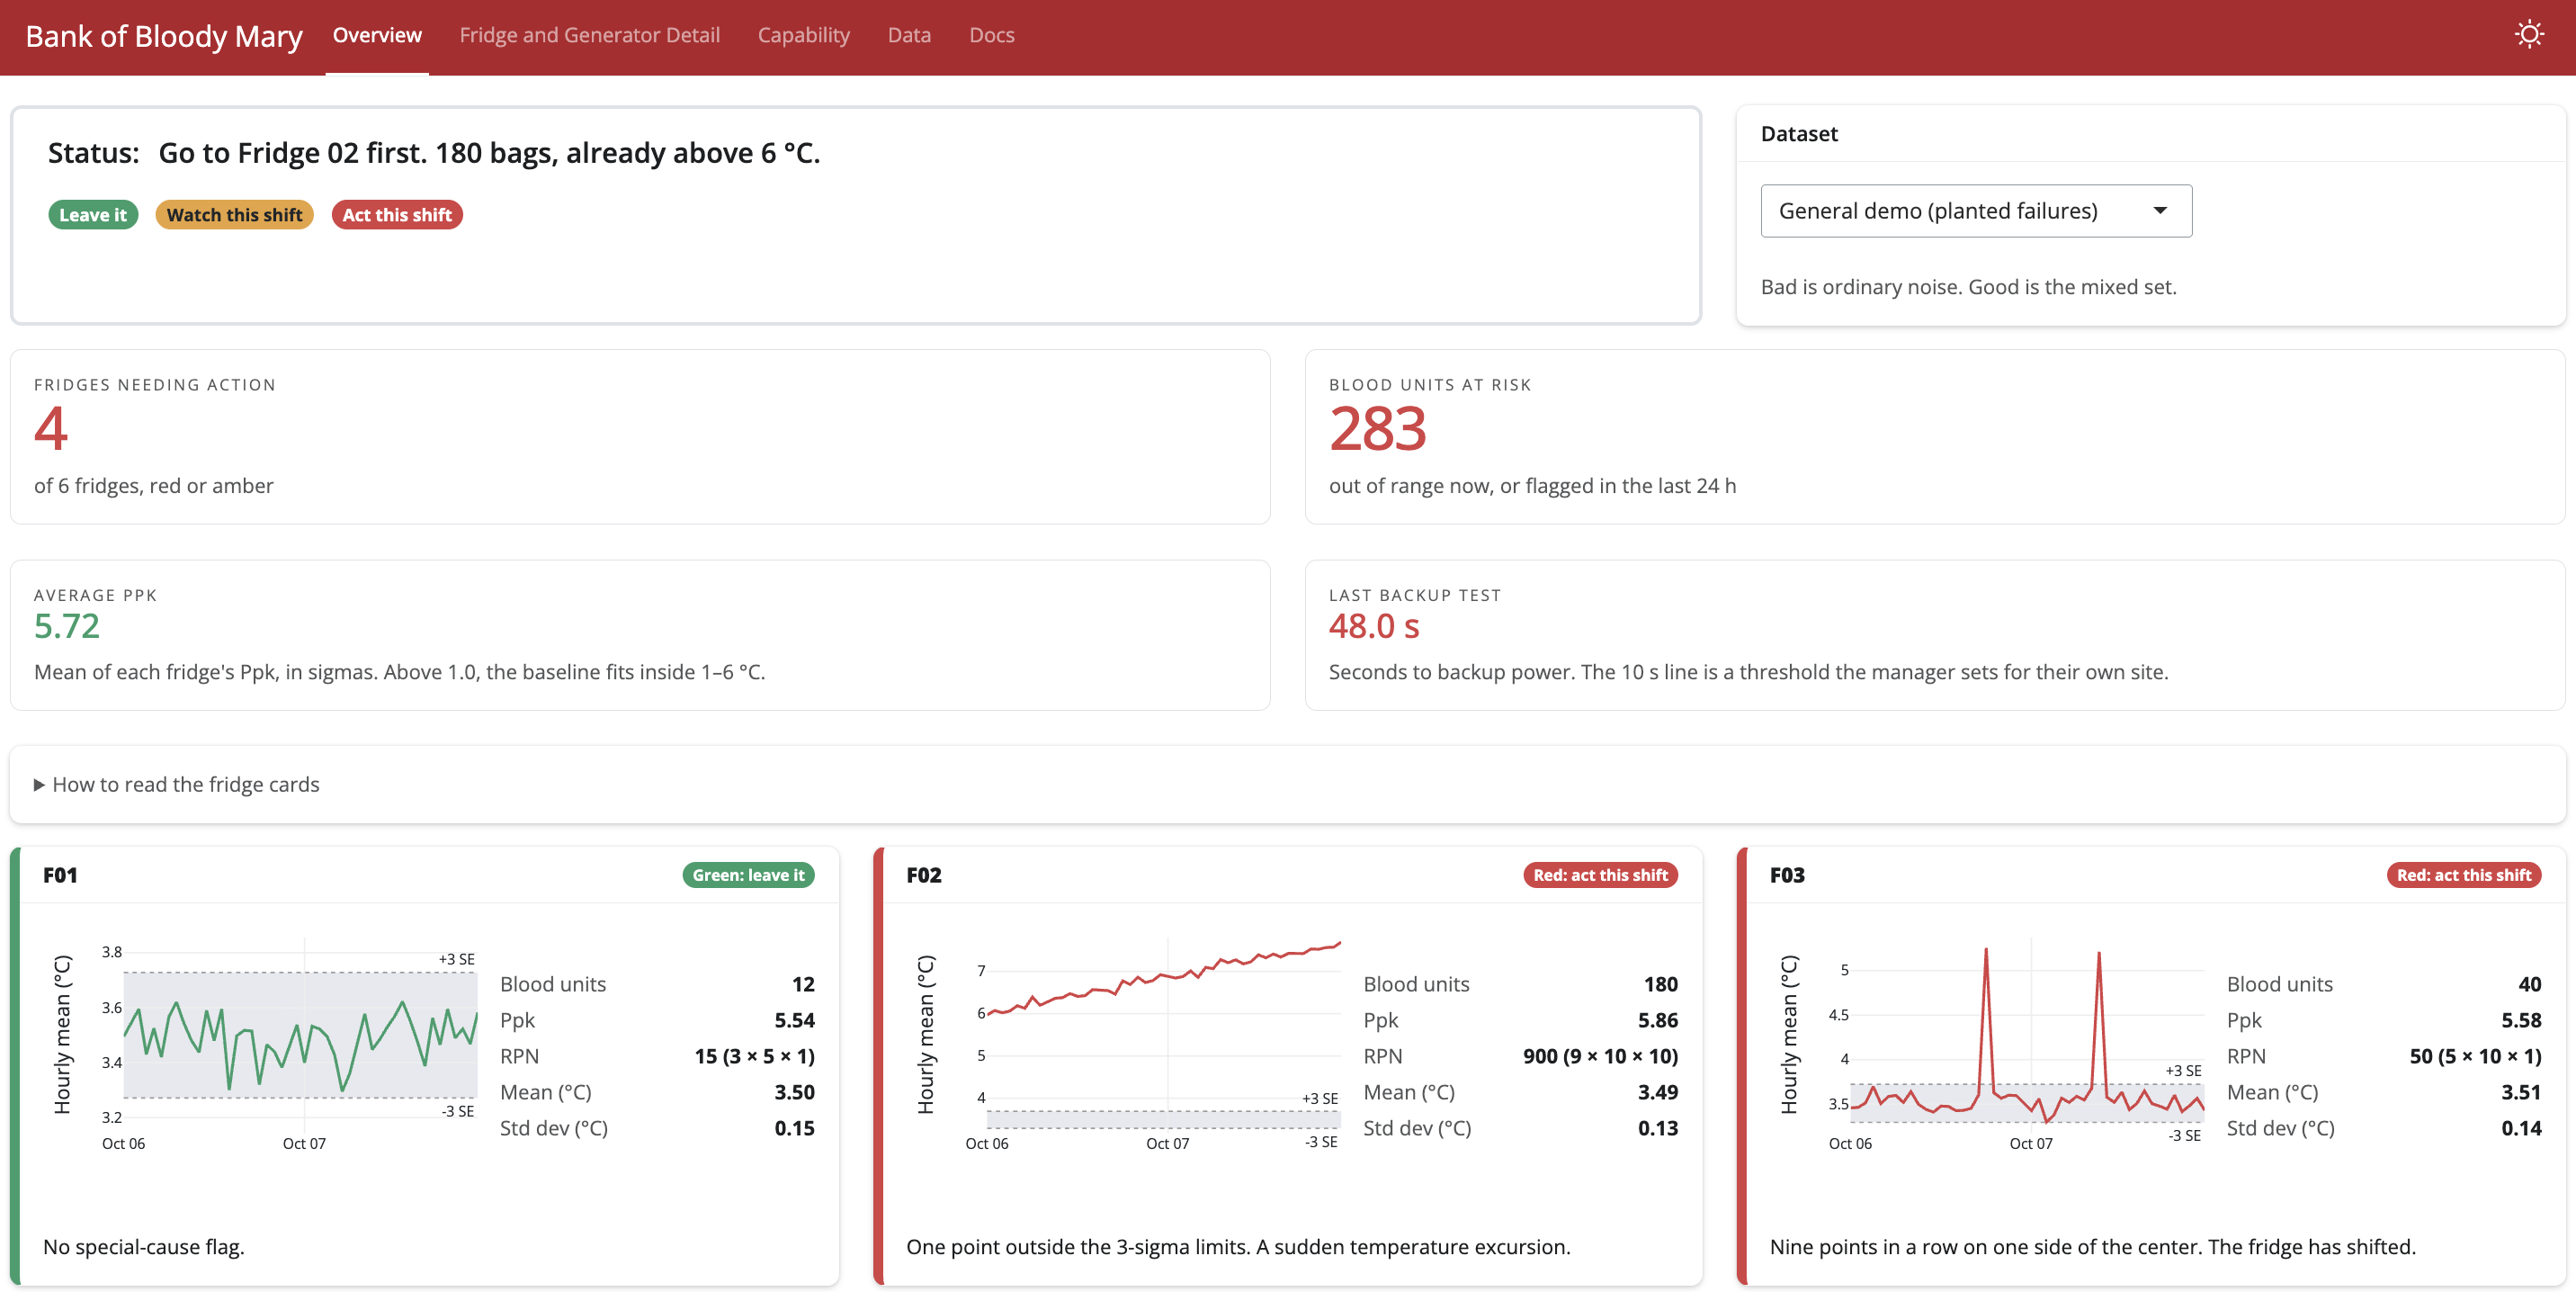
The Bank of Bloody Mary (our spooky example blood bank) is a dashboard that shows the temperature charts over time for each of the six fridges. The Overview tab shows fridge cards are sorted by a risk priority number. Each card has a red, amber or green action badge that determines status. The page also shows fridges needing action, blood units at risk, average Ppk and the last backup-generator transfer time.
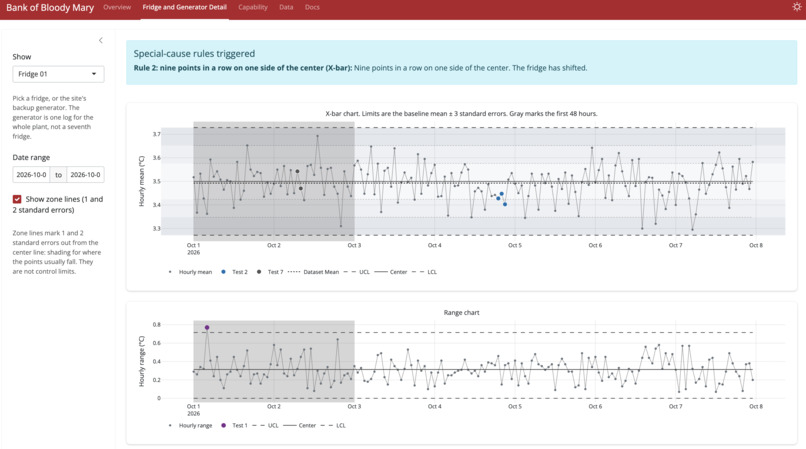
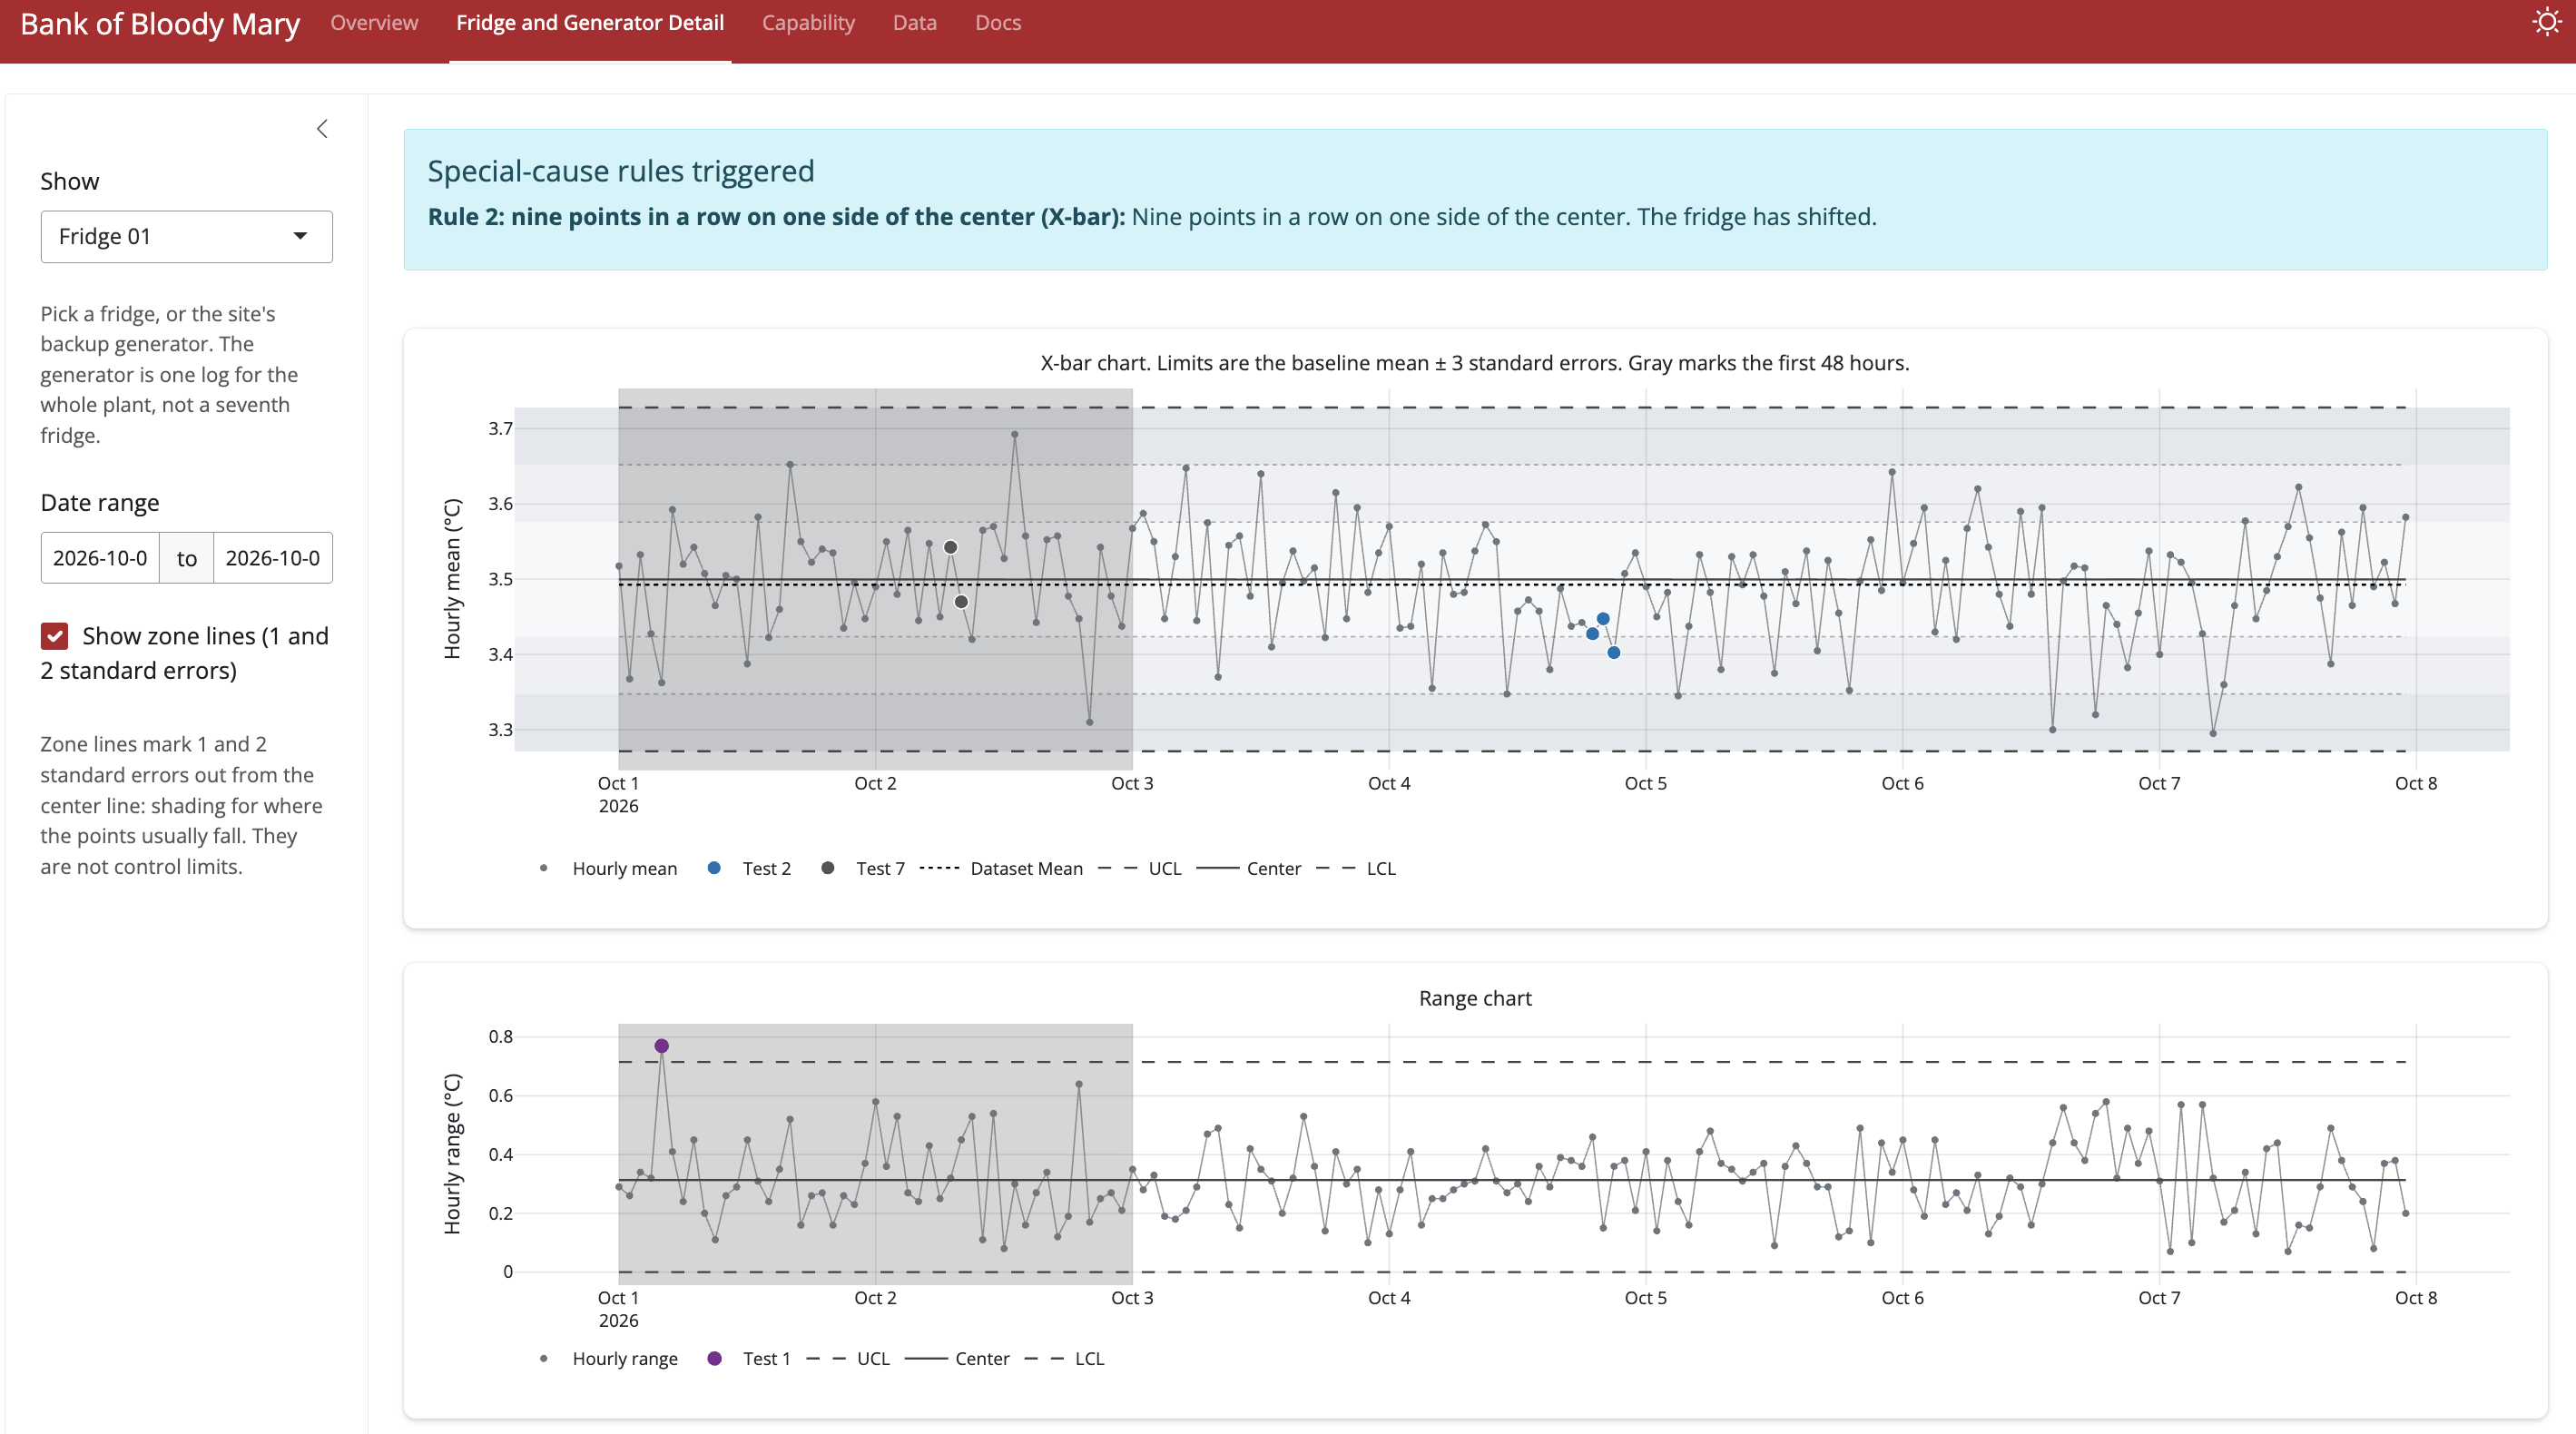
The Fridge and Generator Detail tab has deeper information on each fridge. These charts include the hourly X-bar, range and standard deviation charts. If a fridge is drifting from stable, this tab explains the eight special-cause tests and violations table.
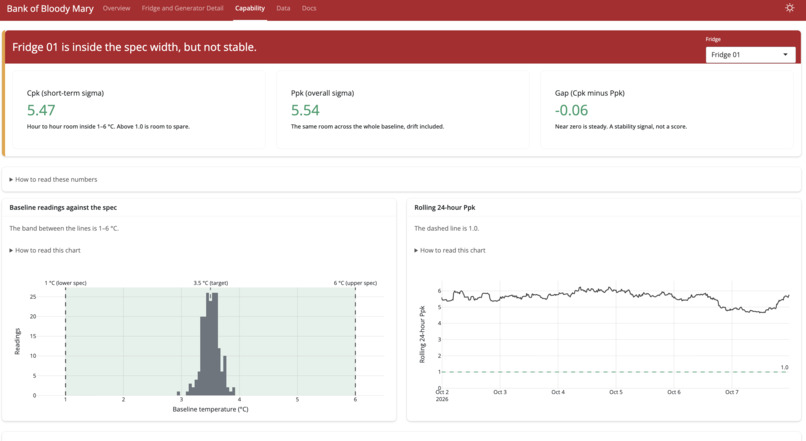
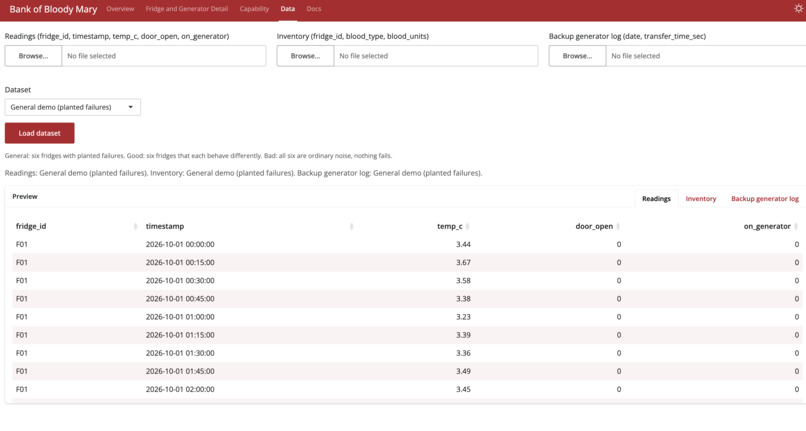
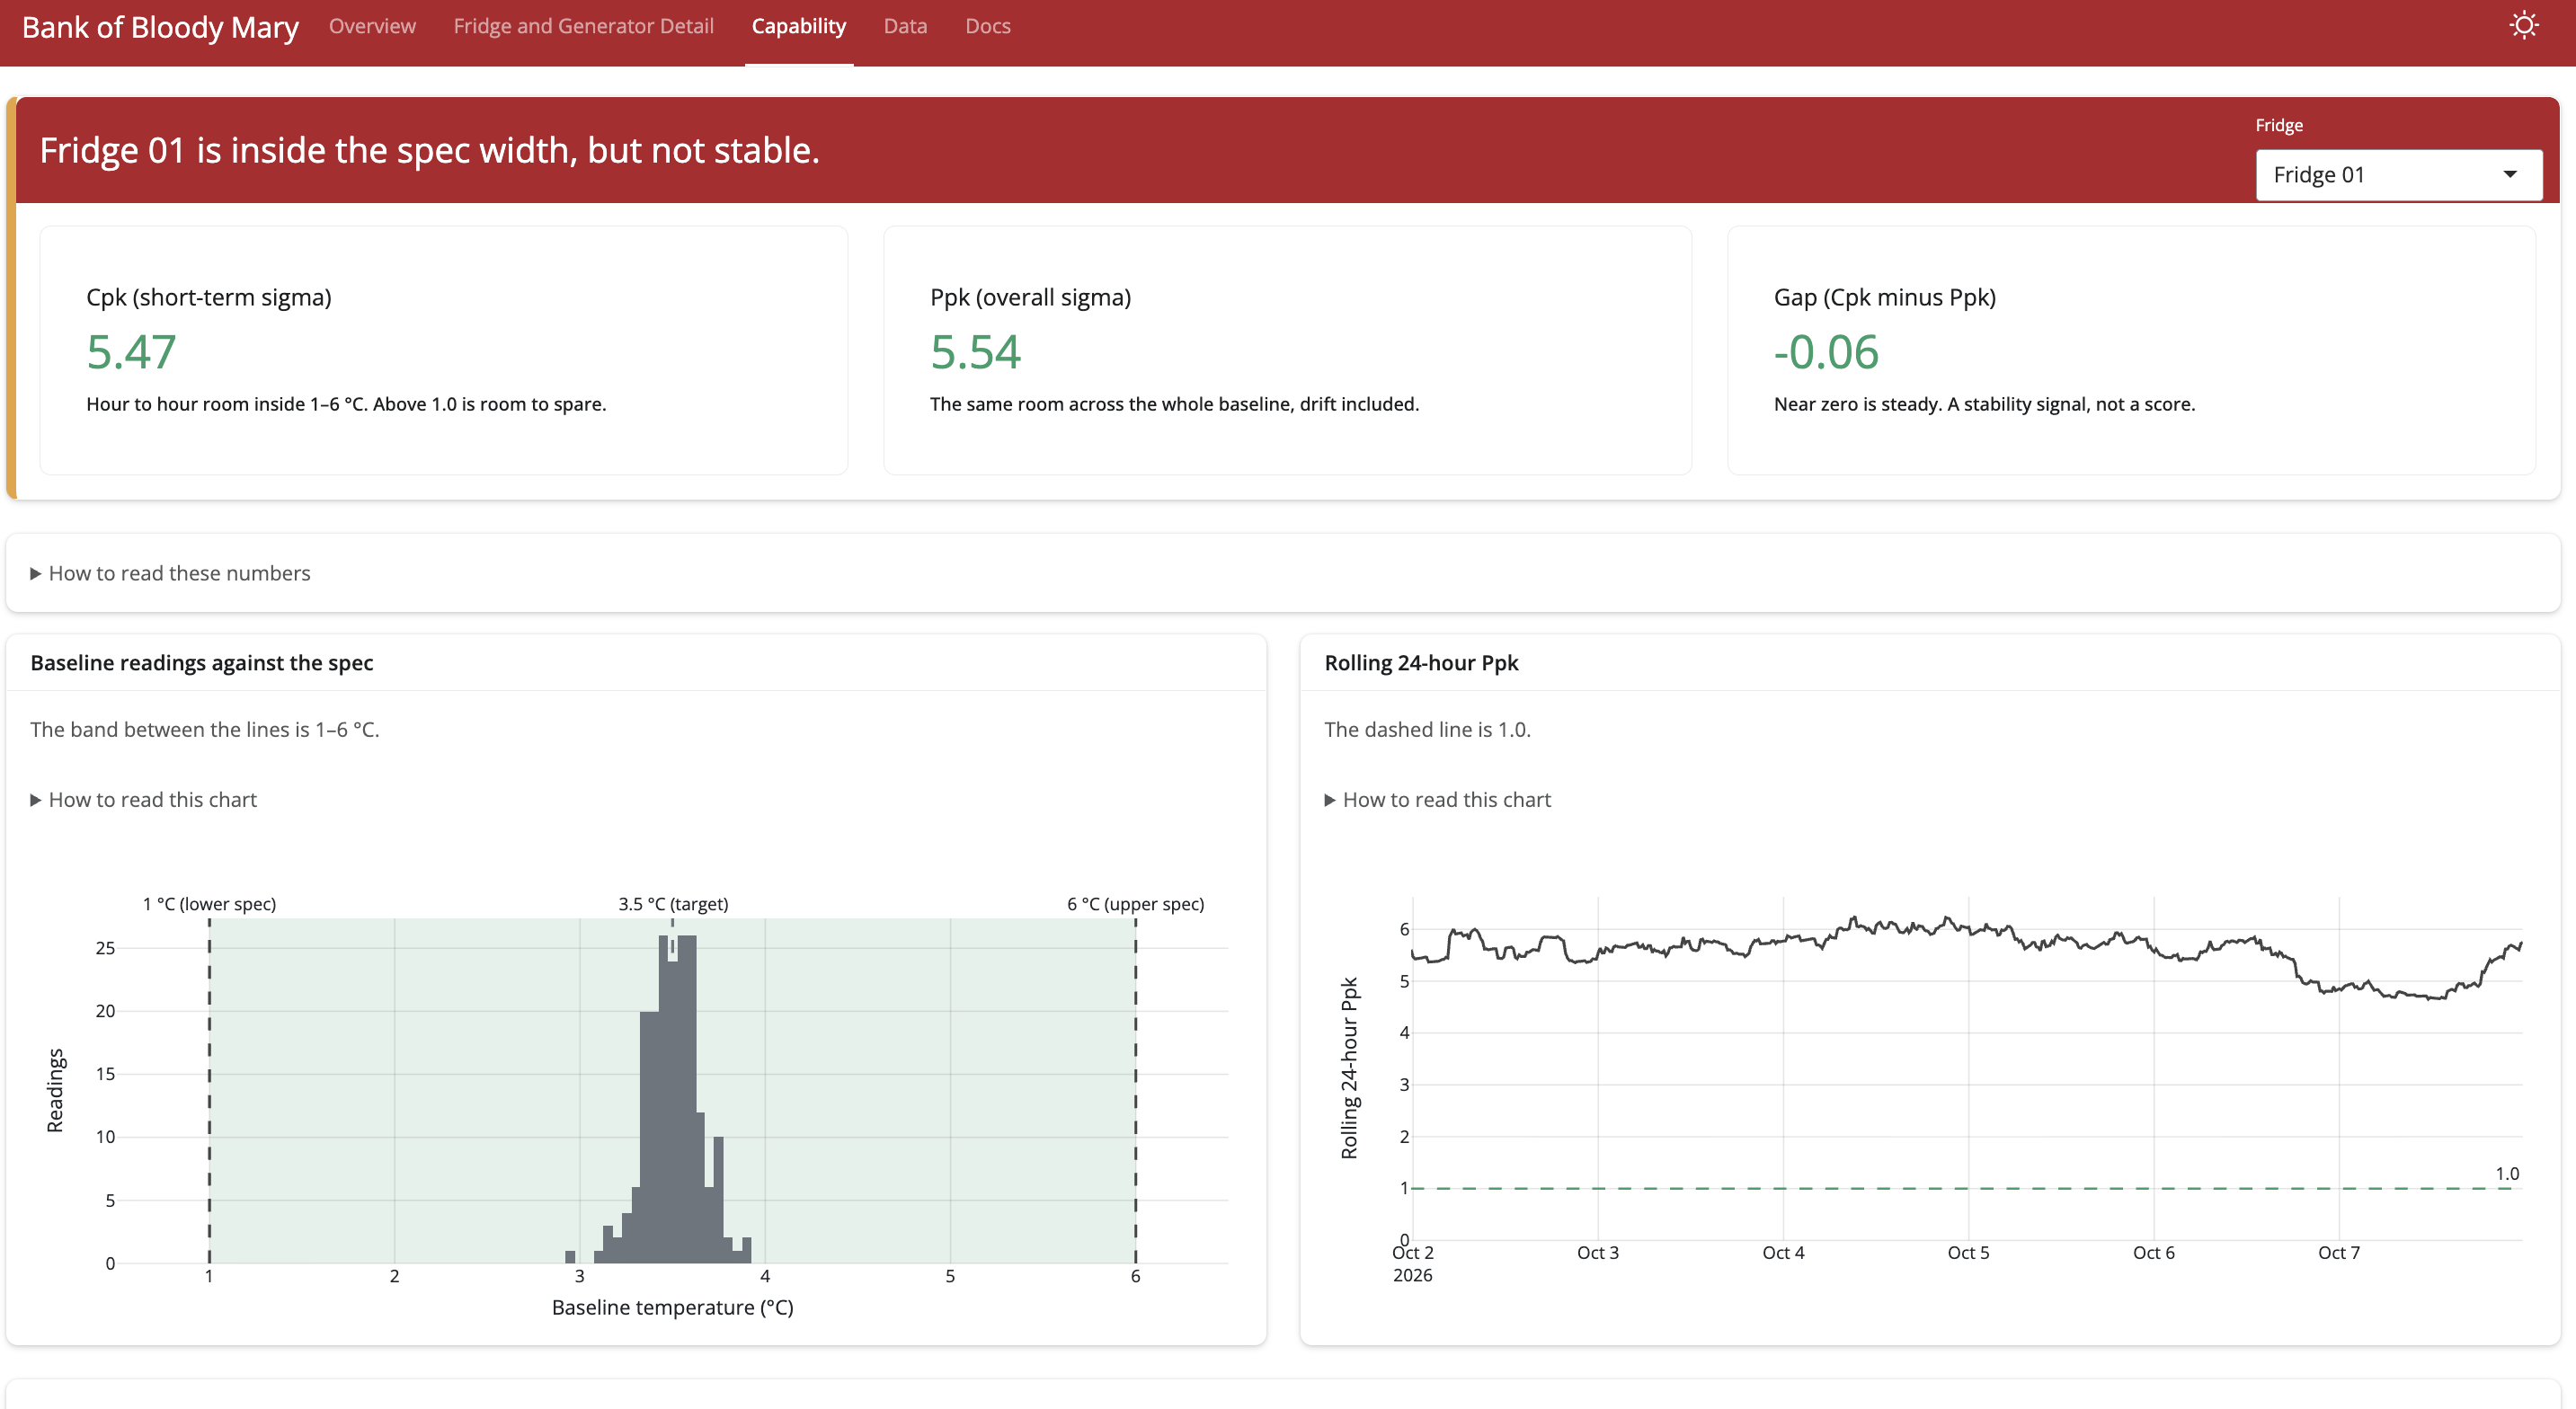
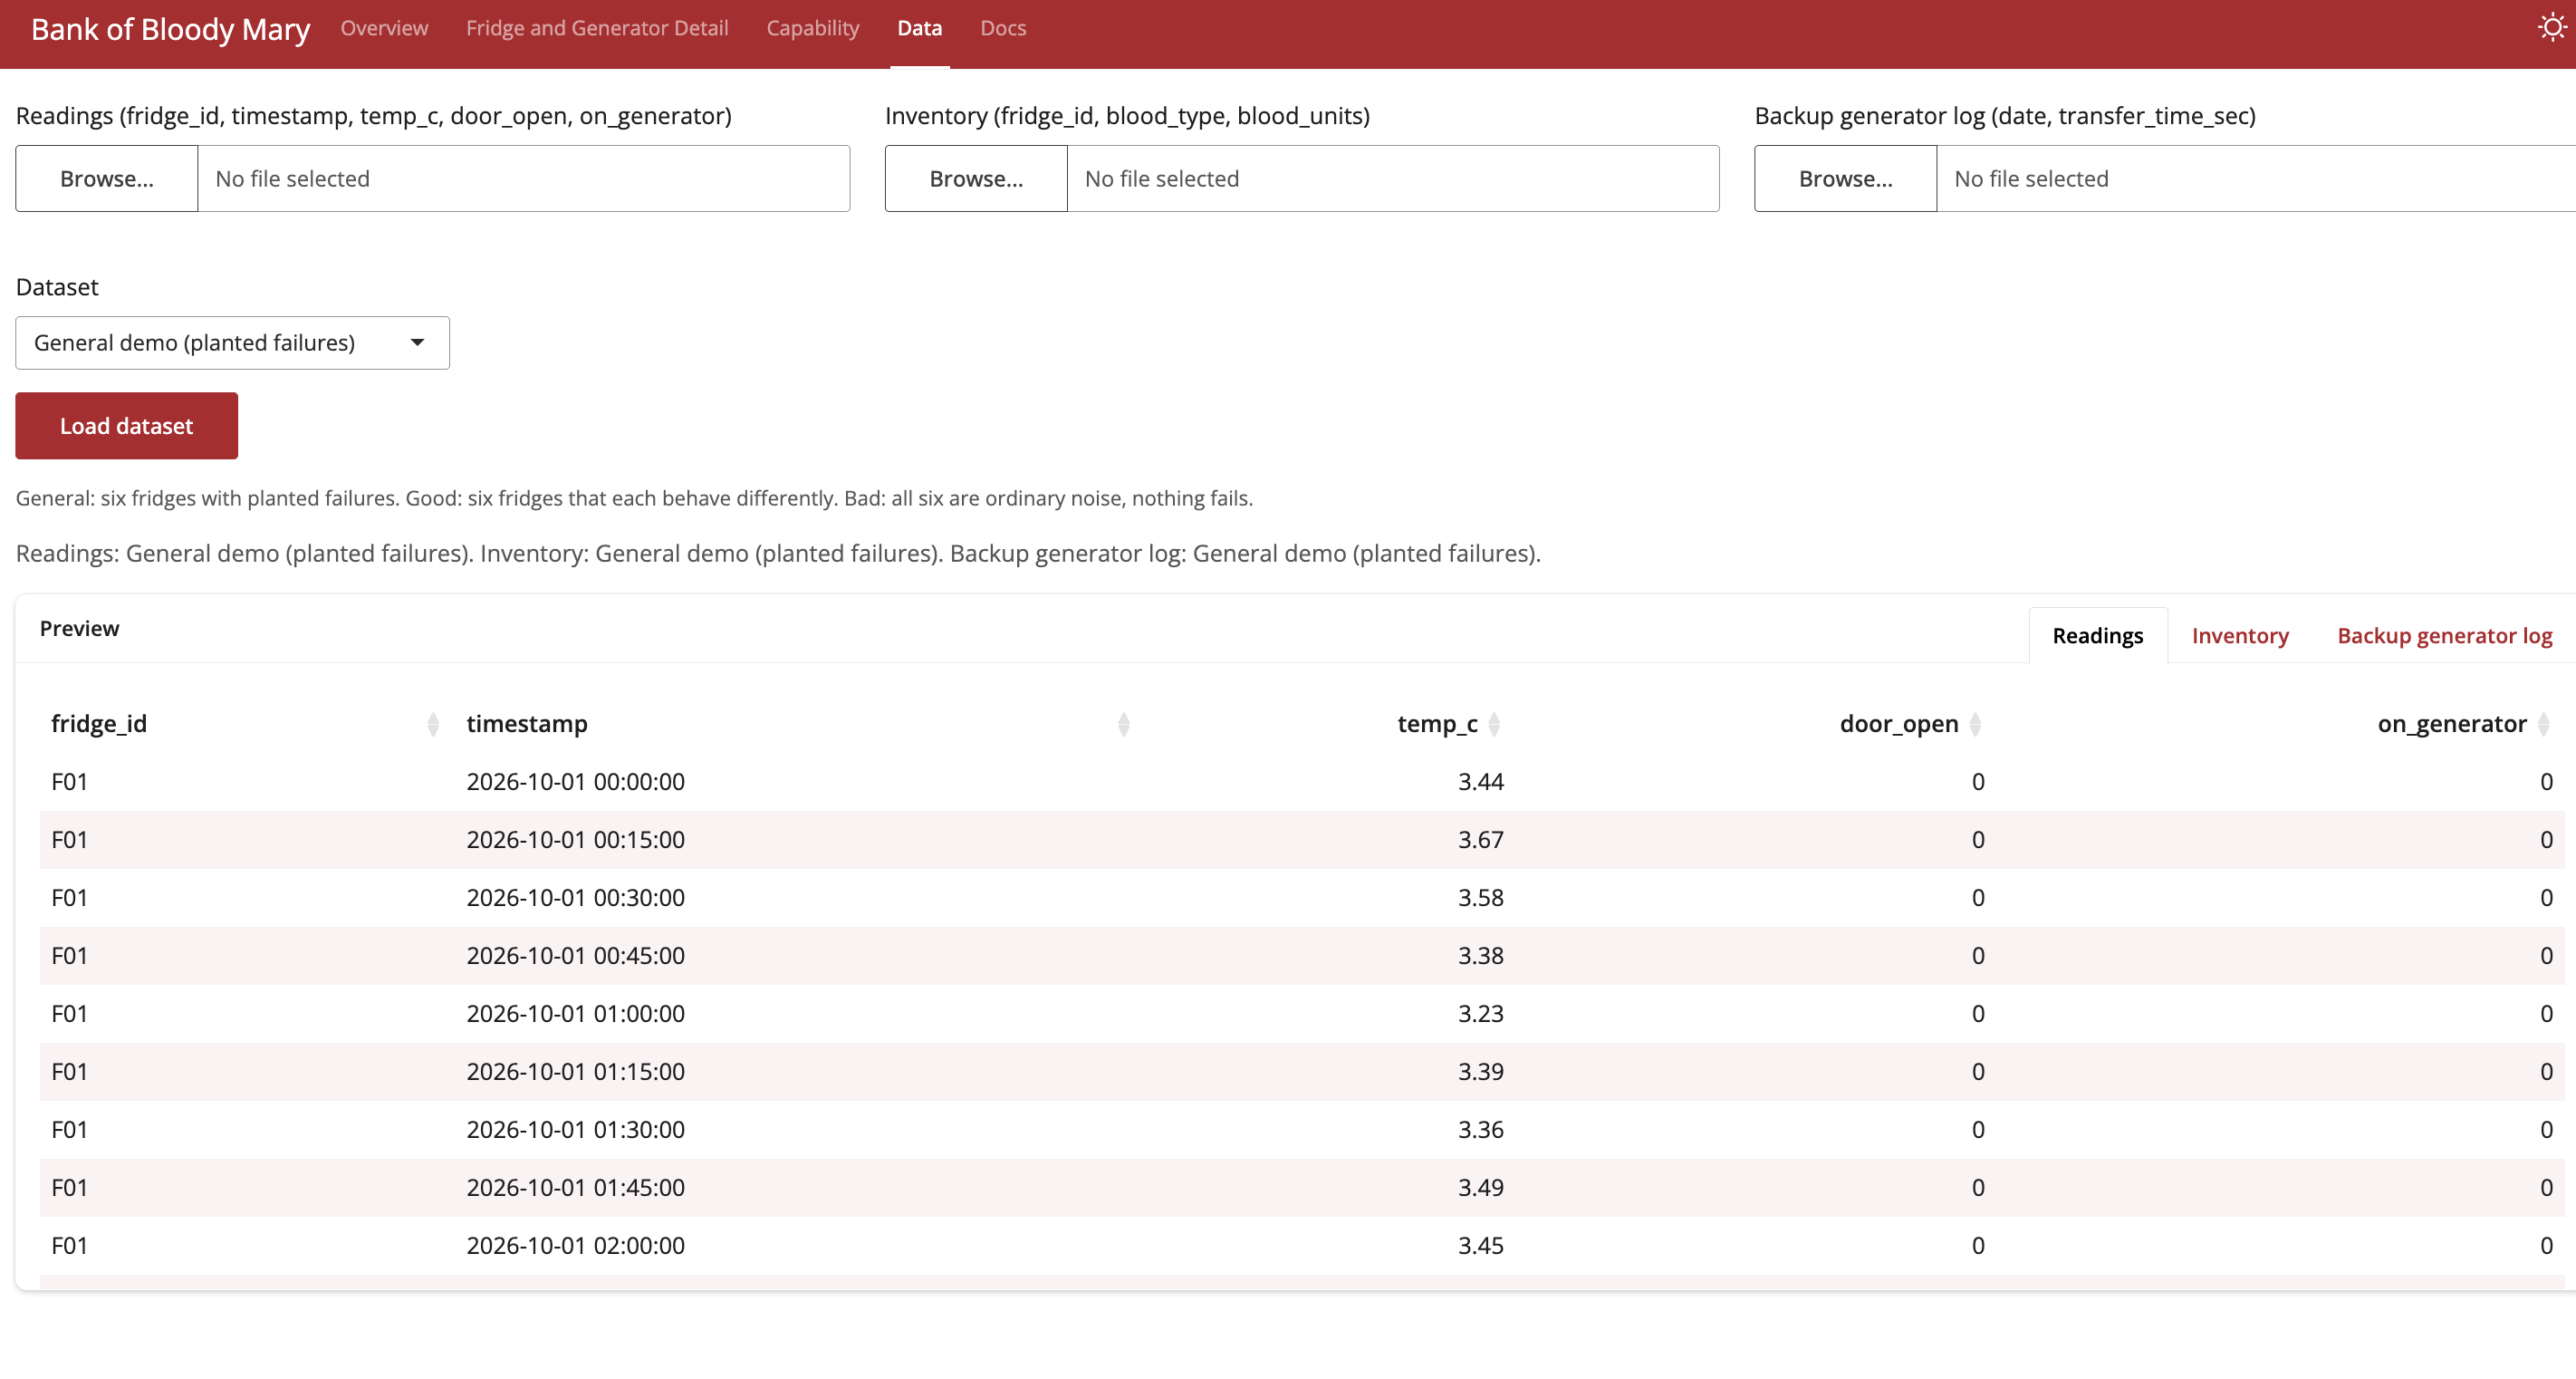
The last two tabs, Capability and Data, are the deepest dives with specific values and charts like Cpk, Ppk, moving range charts, and dataset swaps.
How we built it
The statistics are based on temperature logs over time and blood type rarity. Since we have enough data, the constants like d2 and d3 are computed from the dataset. The computations happen in the background, and Shiny pulls the data to feed into charts on the app interface. The goal was for the dashboard to be both a quick-glance resource and a deep dive resource.
Challenges we ran into
With lower-powered agents, it was difficult to generate datasets that triggered exactly the rules we wanted or didn't want to violate. Linking the datasets throughout the app interface also proved difficult as initially the Data tab was isolated from Overview. Formatting the app interface was the largest effort. Making sure that all the charts scaled nicely, that all information was explained in plain English, and that the data's story was consistent throughout the app were the largest effort.
Accomplishments that we're proud of
Given the goal of the app is to be primarily at-a-glance, we are proud of the easy-to-read charts with important statistics nearby. We are also proud of the Status card that tells the operations manager what to do immediately, allowing no wasted time if there is a catastrophic issue.
What we learned
We learned that generating datasets to only trigger certain rules was difficult with the given tools. Formatting the app interface also took more time than expected as some merged changes removed features unexpectedly. Overall, we learned to be more specific with telling the Agent exactly what we wanted to see, eliminating improvisation on the agent's part.
What's next for the Bank of Bloody Mary
We would want to expand the available demo datasets to emphasize all the rule checks are performing adequately. A more detailed Status card that can be clicked on and expanded would also be useful. This expanded card would give a to do list for fridge maintenance to the operations manager, instead of the technicians fixings a fridge and waiting for the app to refresh and state the next broken fridge.

Log in or sign up for Devpost to join the conversation.