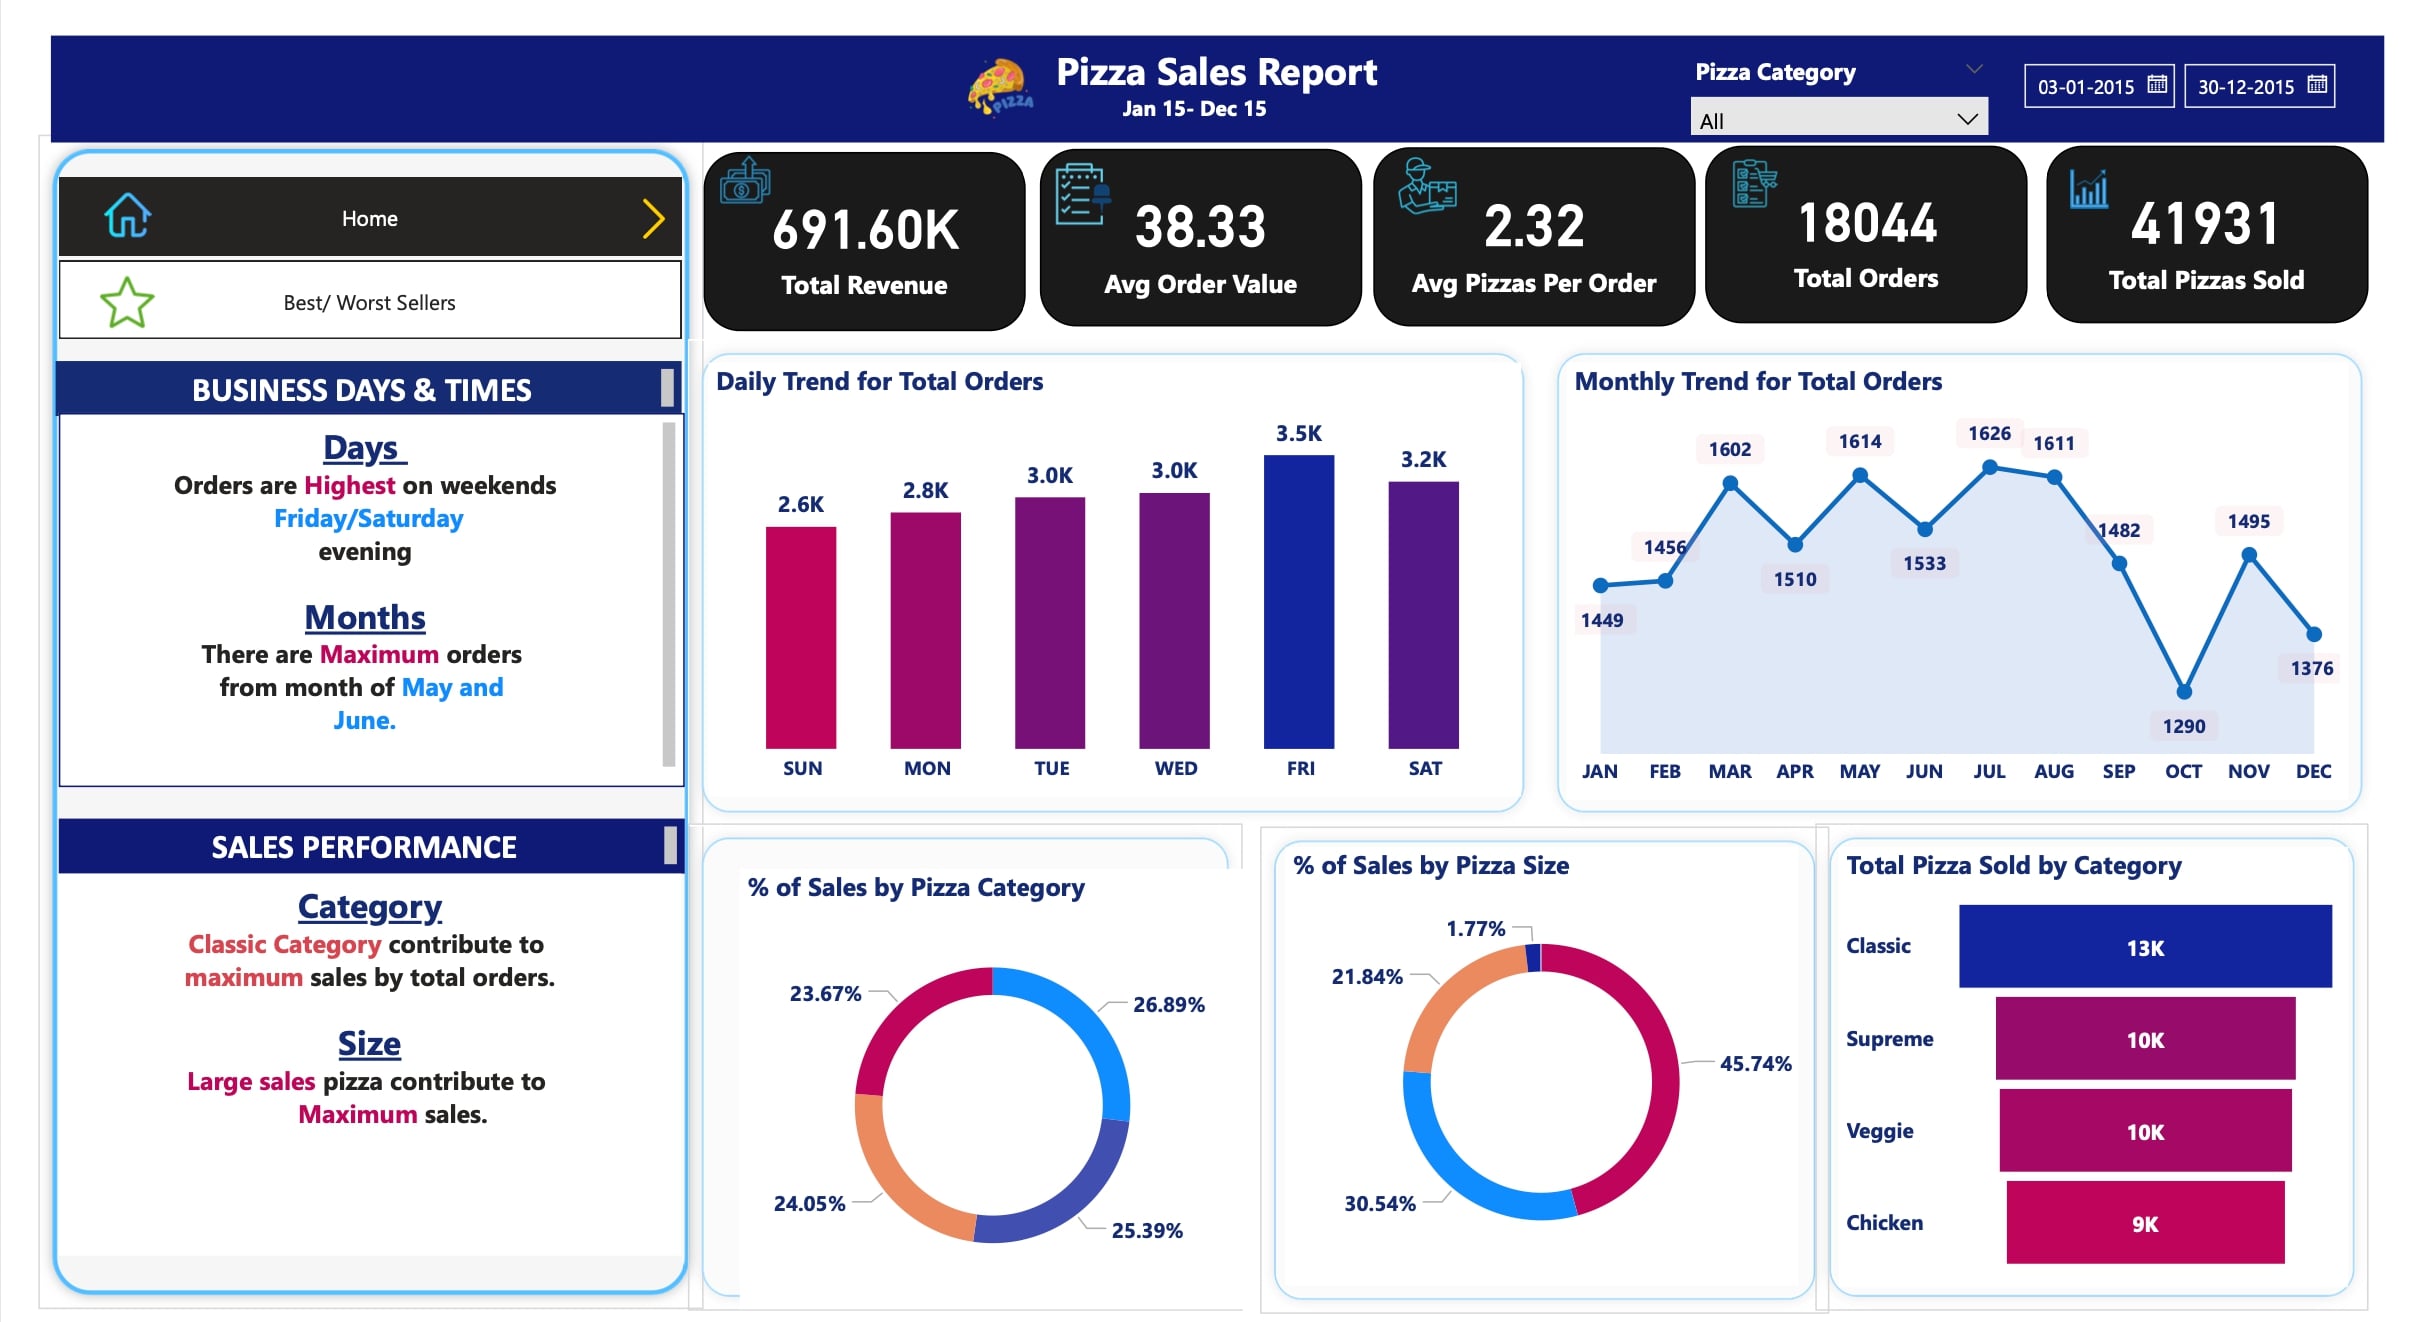
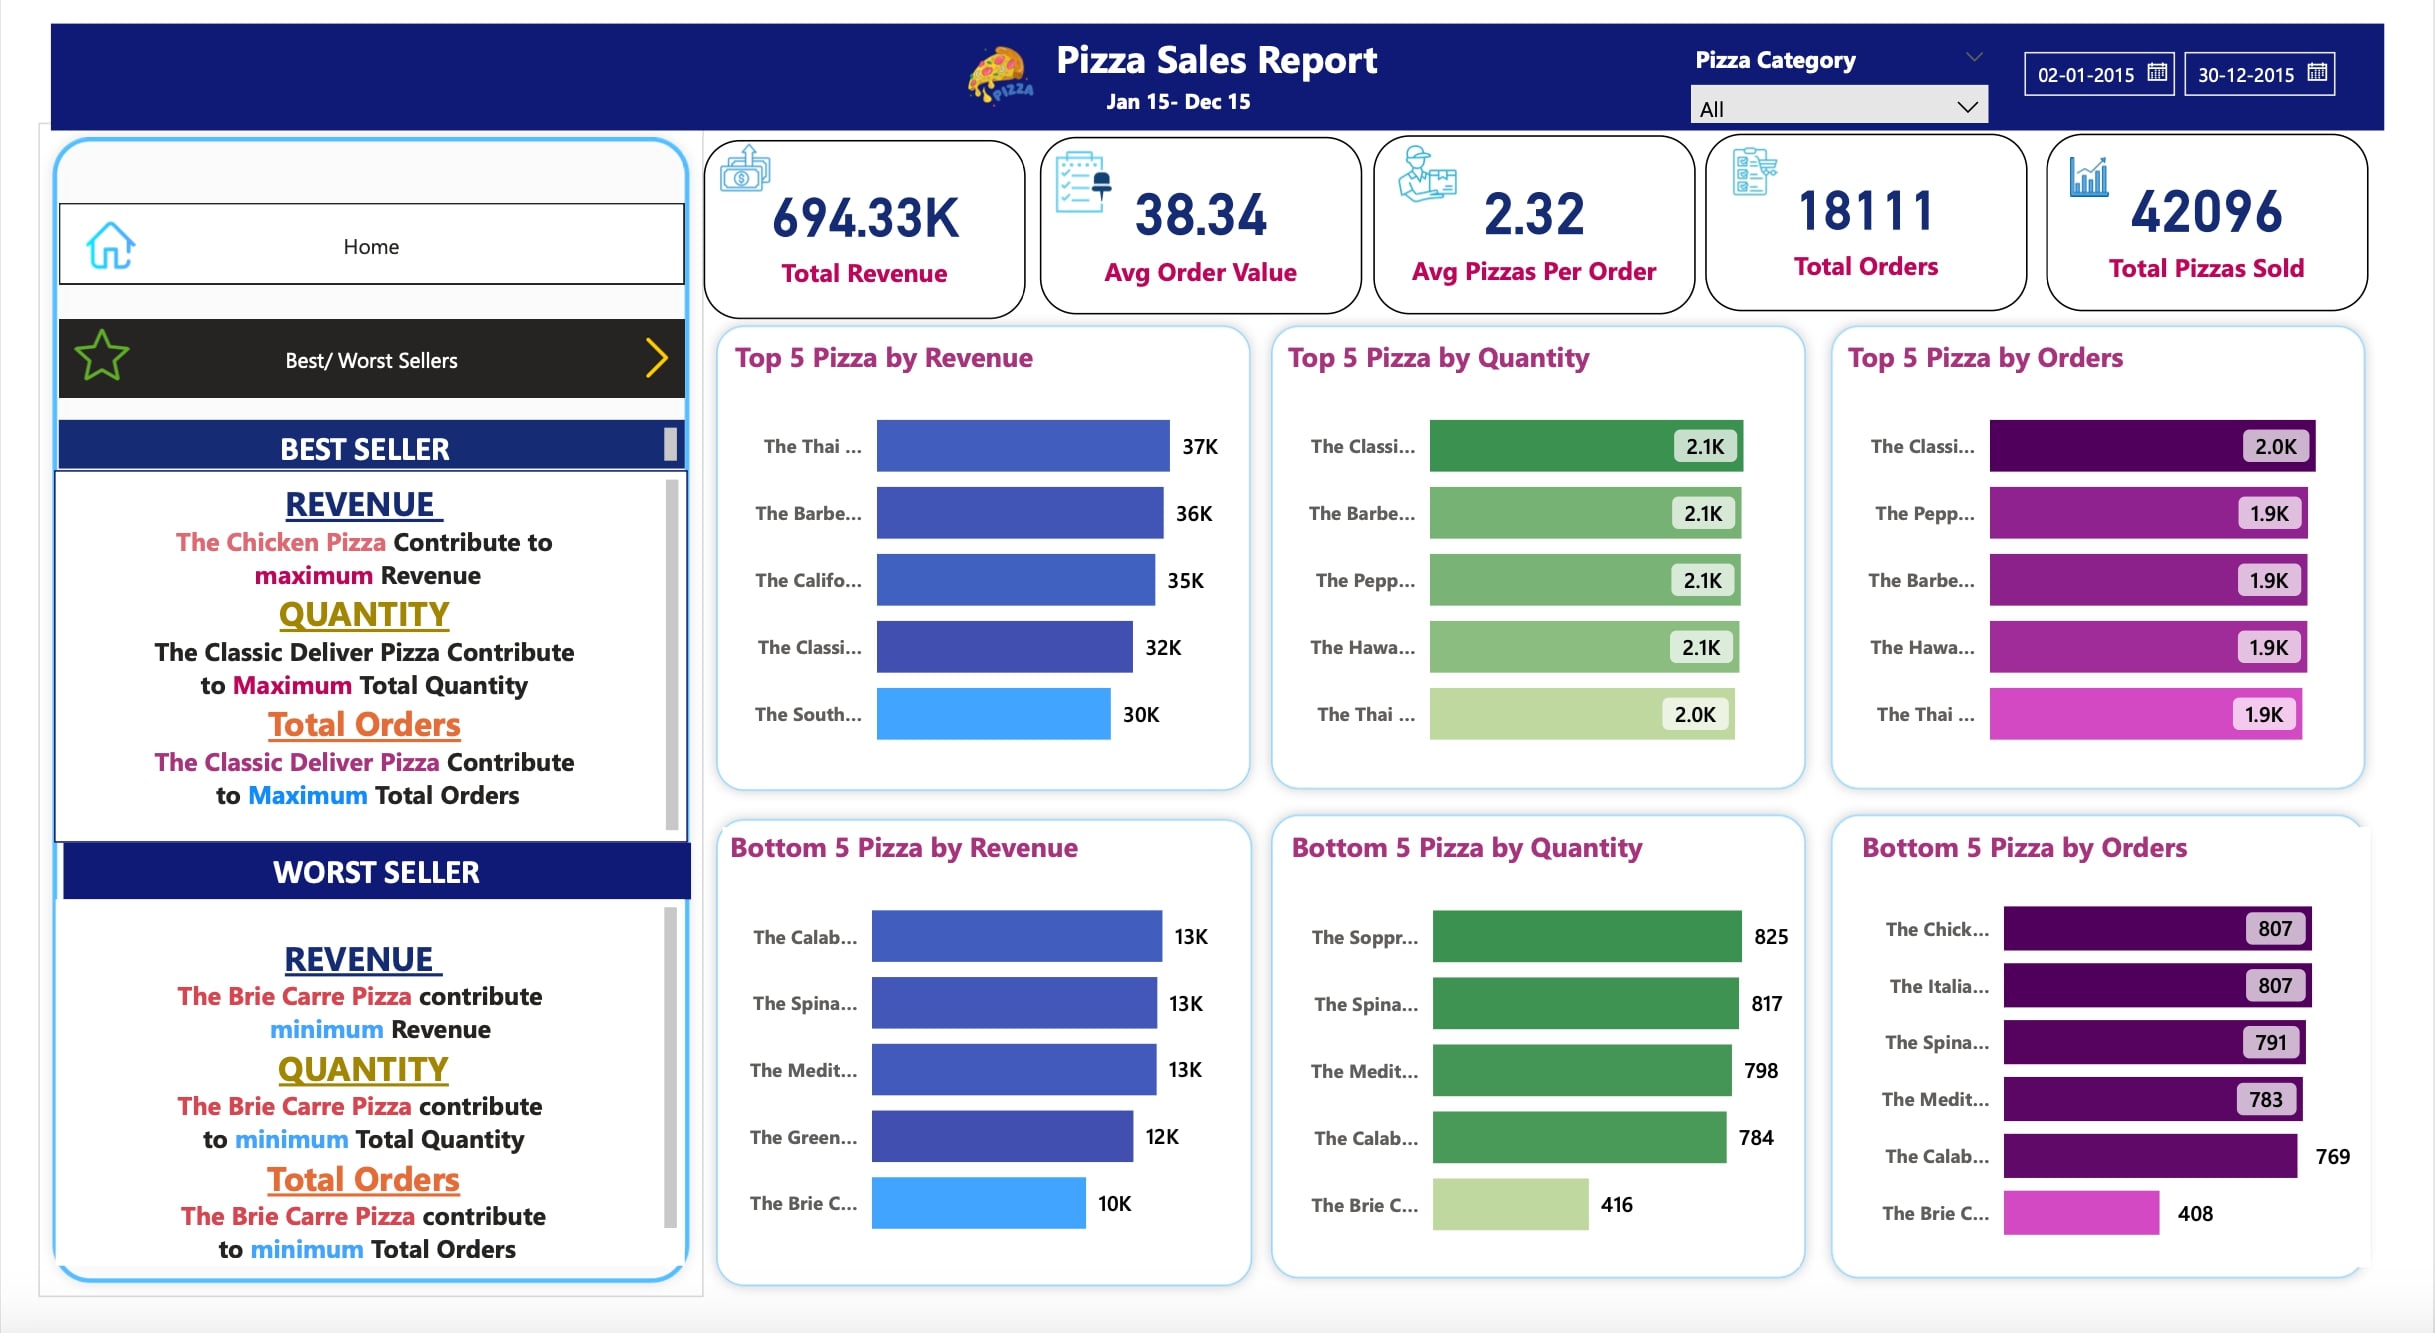
This is a Pizza Sales Analysis Dashboard. The dataset was from Jan'15 till Dec'15.
🛠 Tools used - -> Flat CSV file -> Power BI Desktop -> Power BI Service
Steps involved - Data Importing ➡ Data Cleaning ➡ Data Modeling ➡ Building Visuals ➡ Generating insights.
Following are the insights which were drawn -
1️⃣ Total Revenue - INR 817.86K, Total Orders - 21350, Total Pizza Sold - 49574, Average Order Value - INR 38.31, and Average Pizza Per Order - 2.32.
2️⃣ Orders are highest on weekends, Friday and Saturday evenings. There are maximum orders for the month of January and July.
3️⃣ Classic Category contributes to maximum sales & orders. Large size pizza contributes to maximum sales.
4️⃣ The Thai Chicken Pizza contributes to maximum Revenue. The Classic Deluxe Pizza contributes to maximum Total Quantities. The Classic Deluxe Pizza contributes to maximum Revenue.
5️⃣ The Brie Carrie Pizza contributes to minimum Revenue. The Brie Carrie Pizza contributes to minimum Total Quantities. The Brie Carrie Pizza contributes to minimum Revenue.

Log in or sign up for Devpost to join the conversation.