-
-
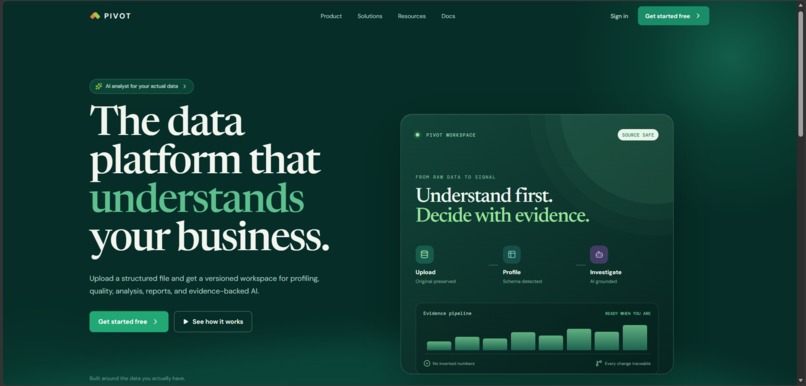
Home/Landing Page
-
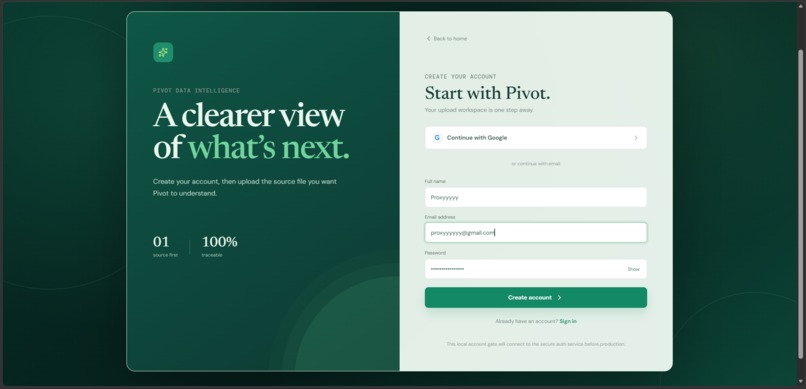
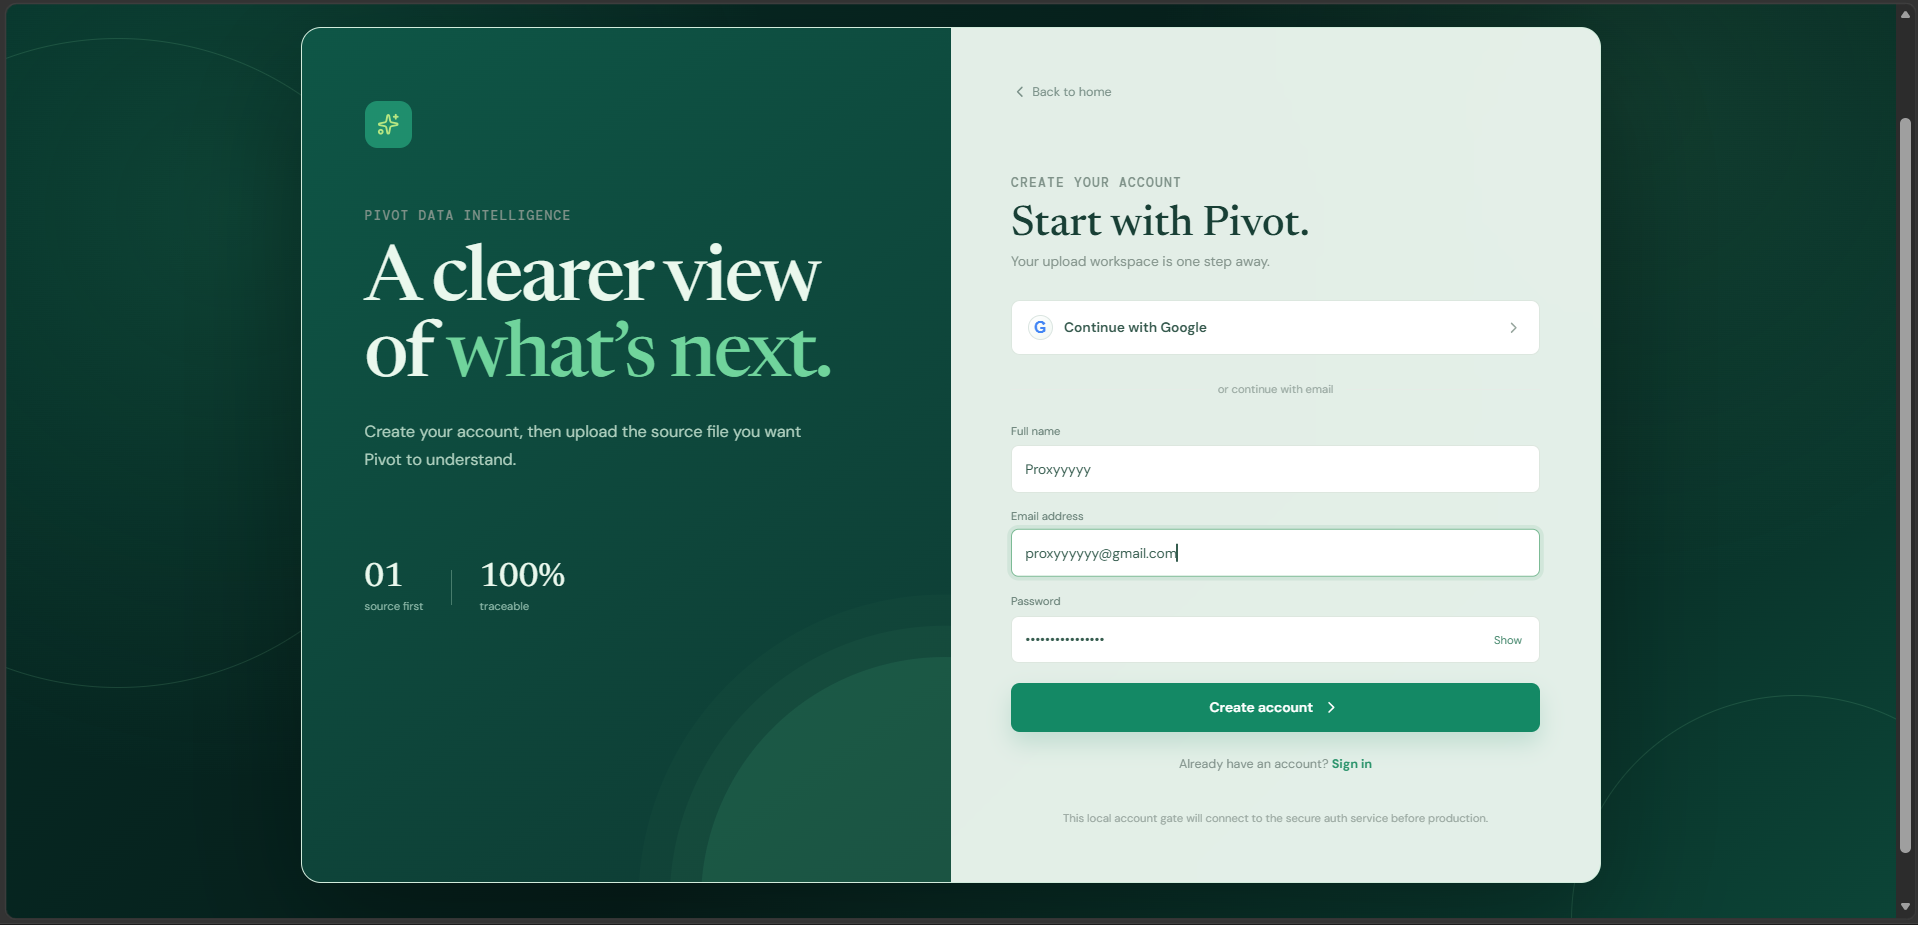
Sign up/Login Page
-
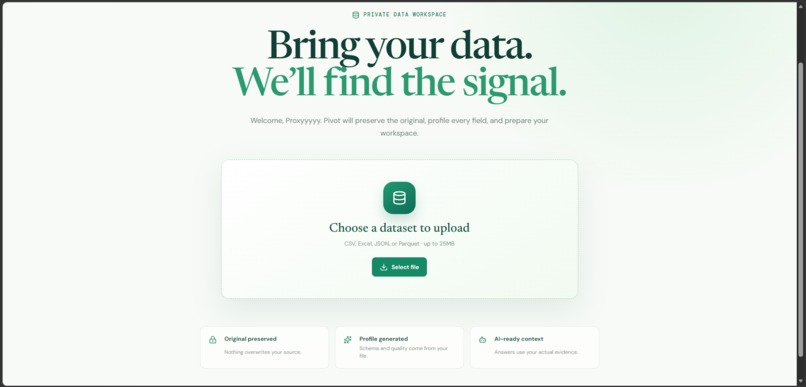
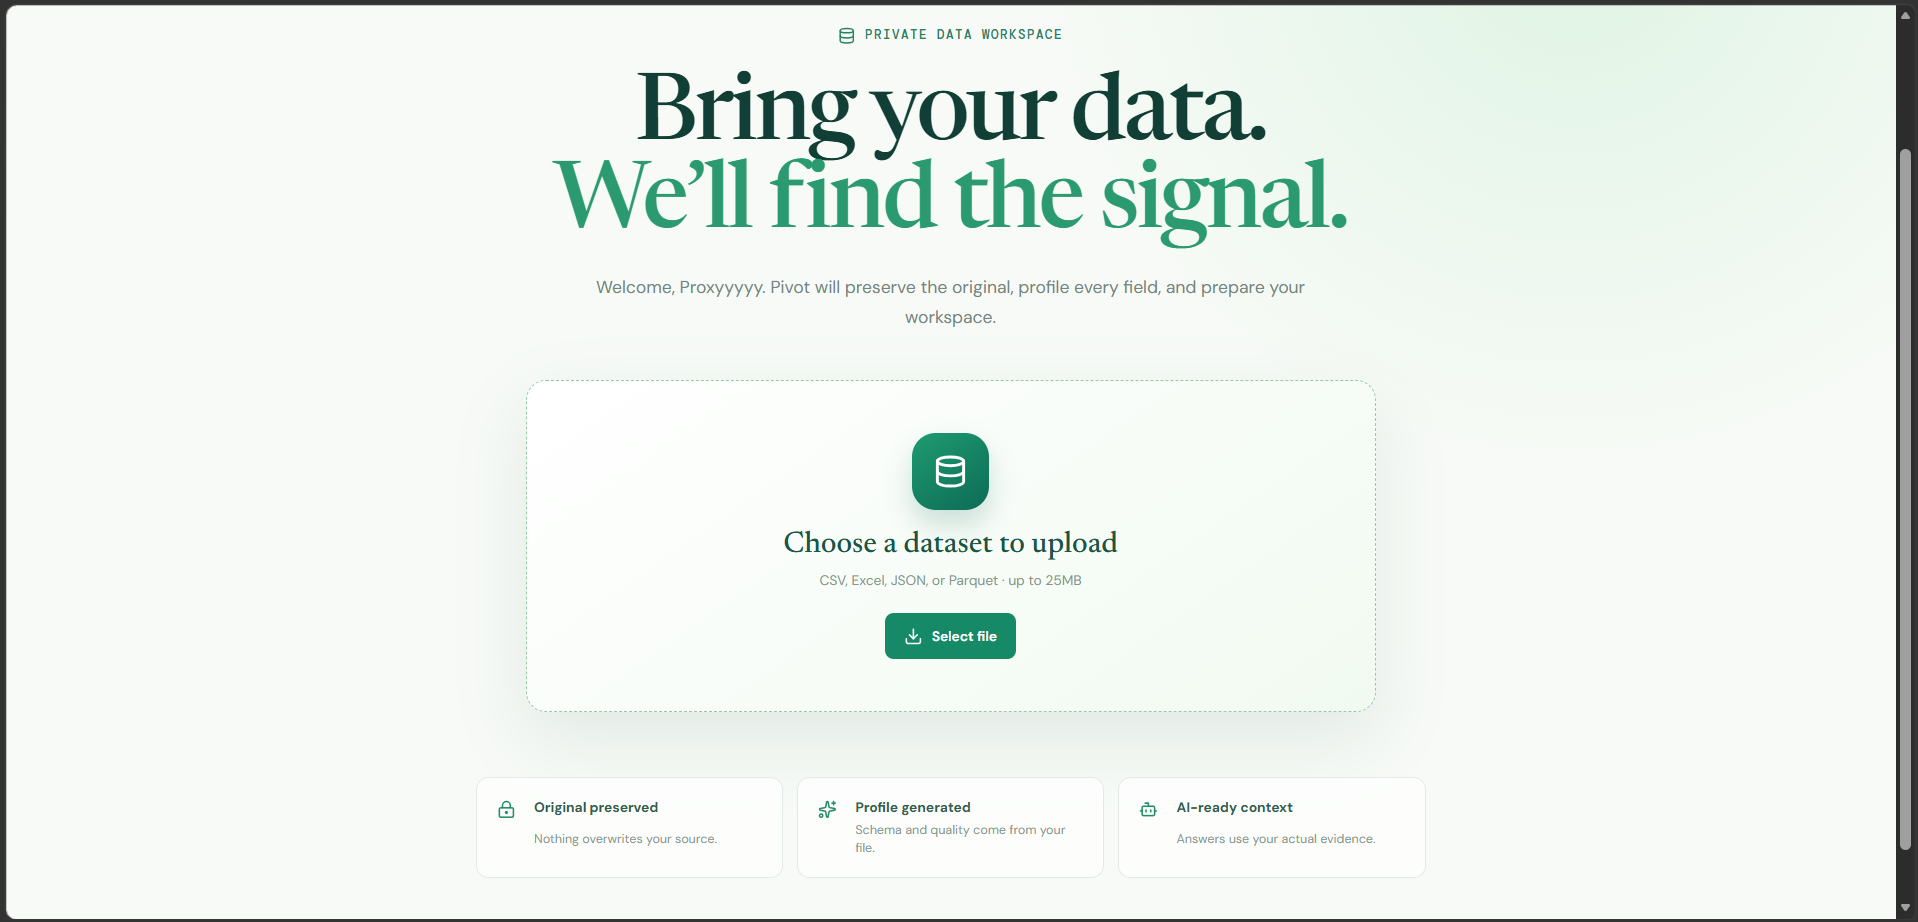
Upload dataset page
-
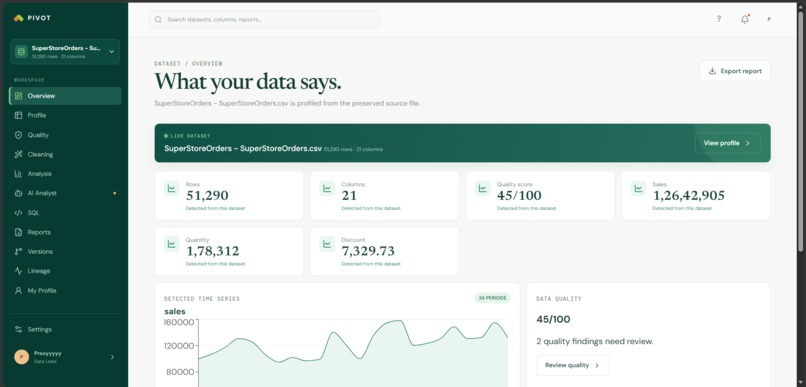
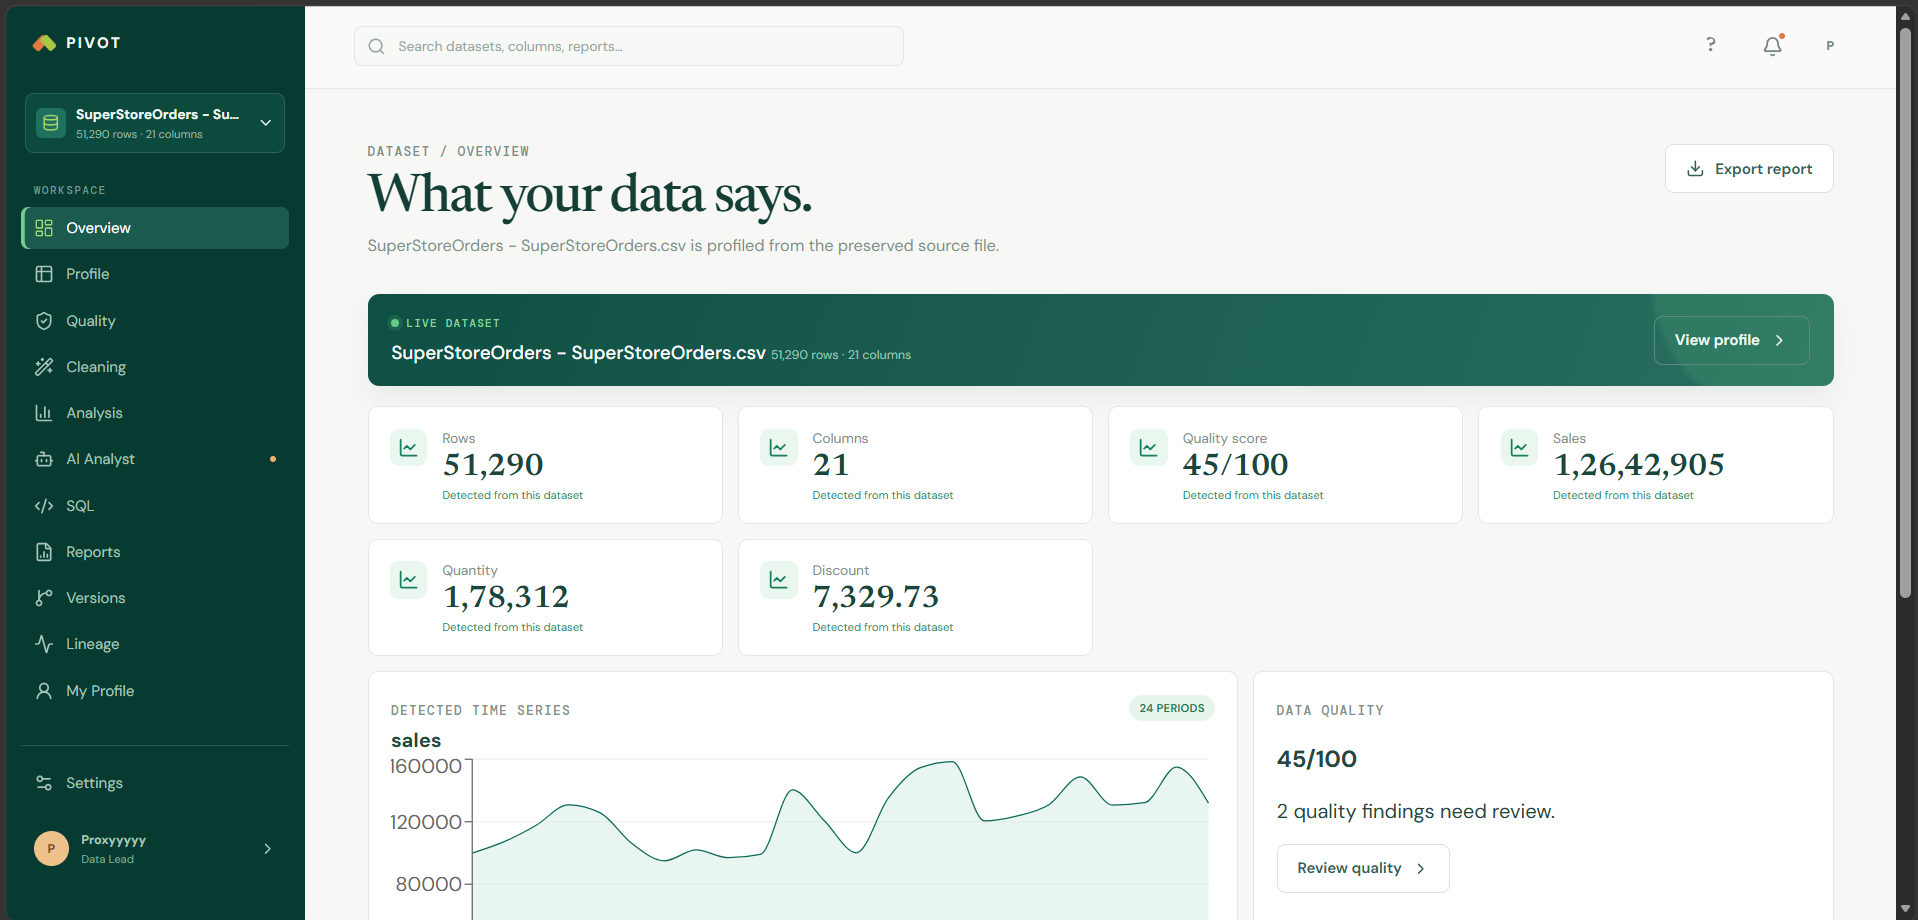
Overview of the whole dataset section, here you can see everything about your dataset.
-
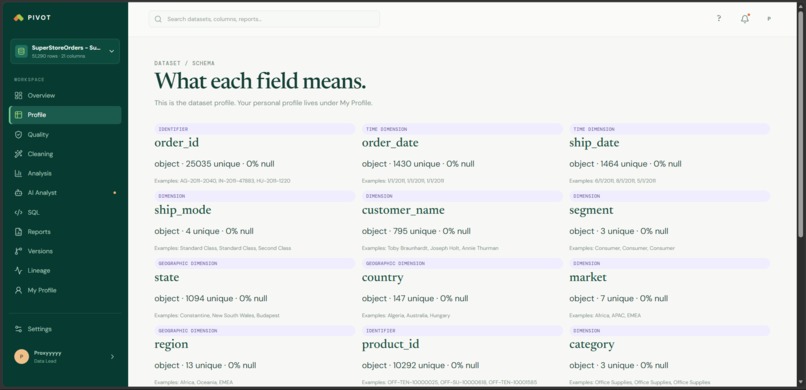
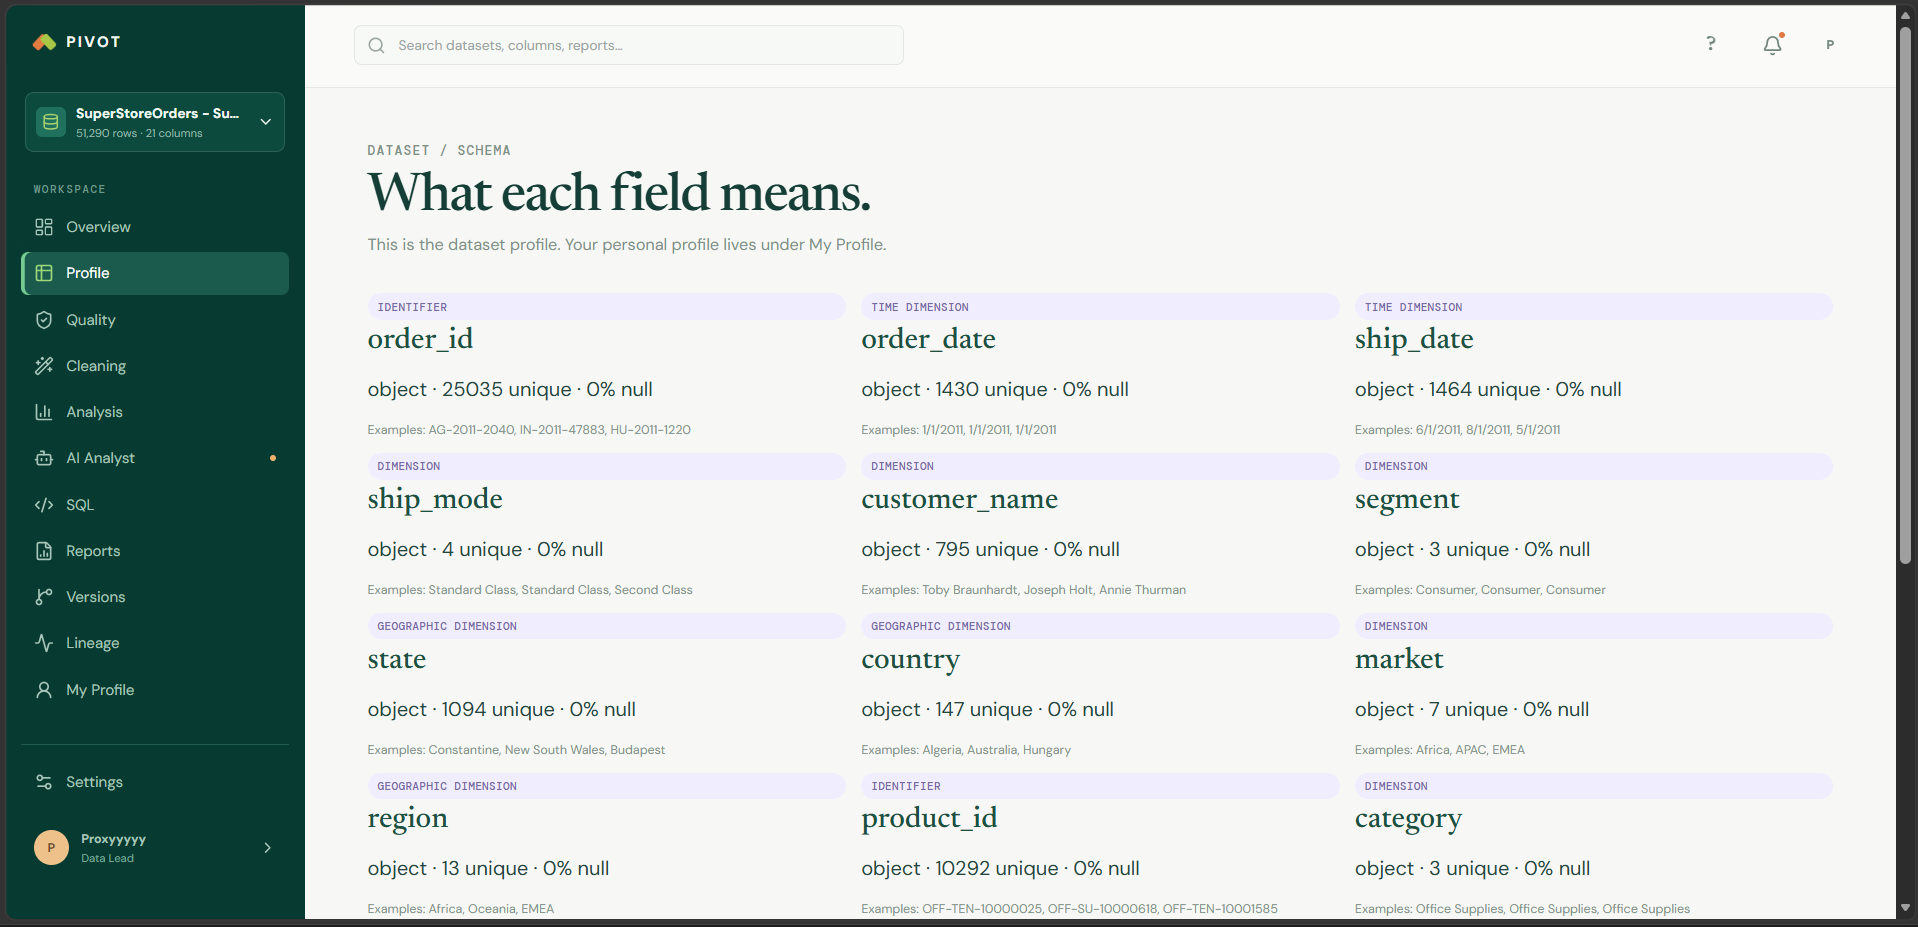
Profile Section of your dataset
-
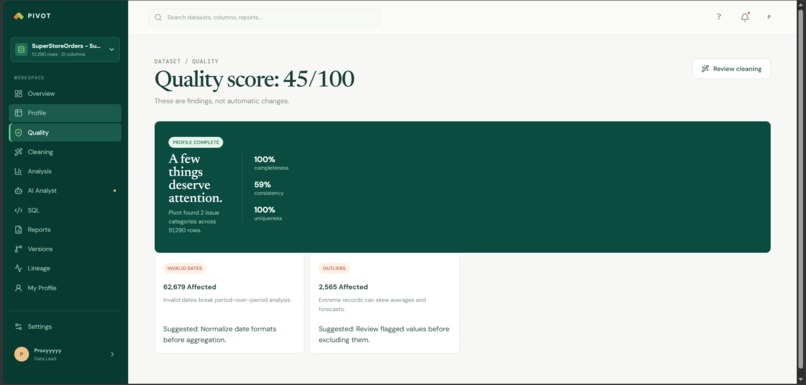
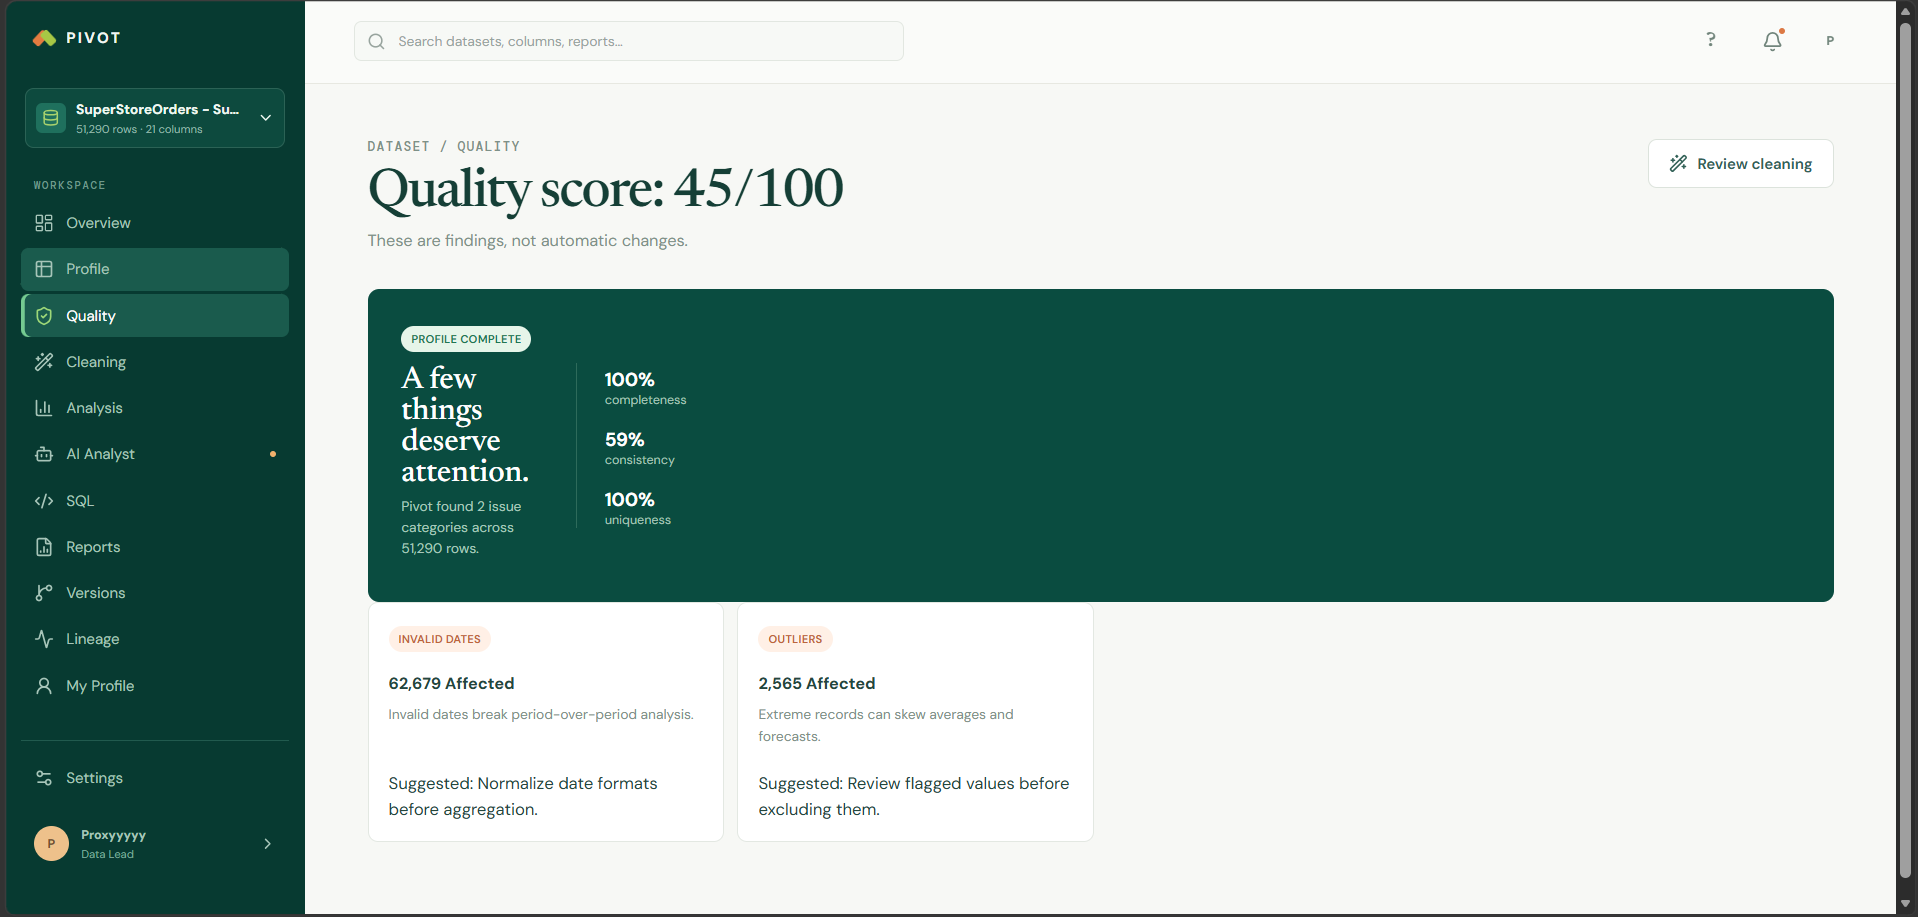
Quality Section
-
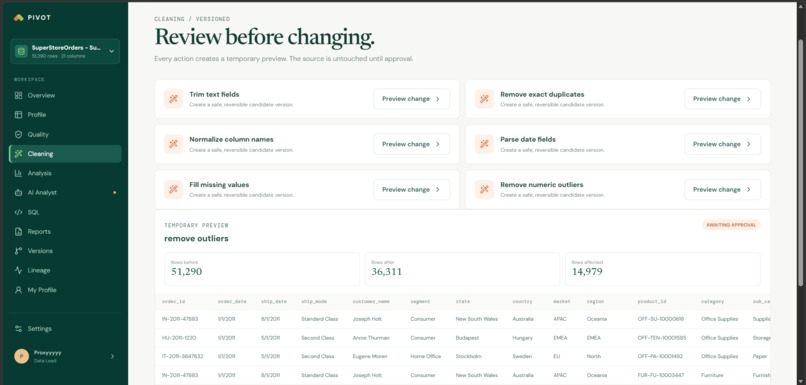
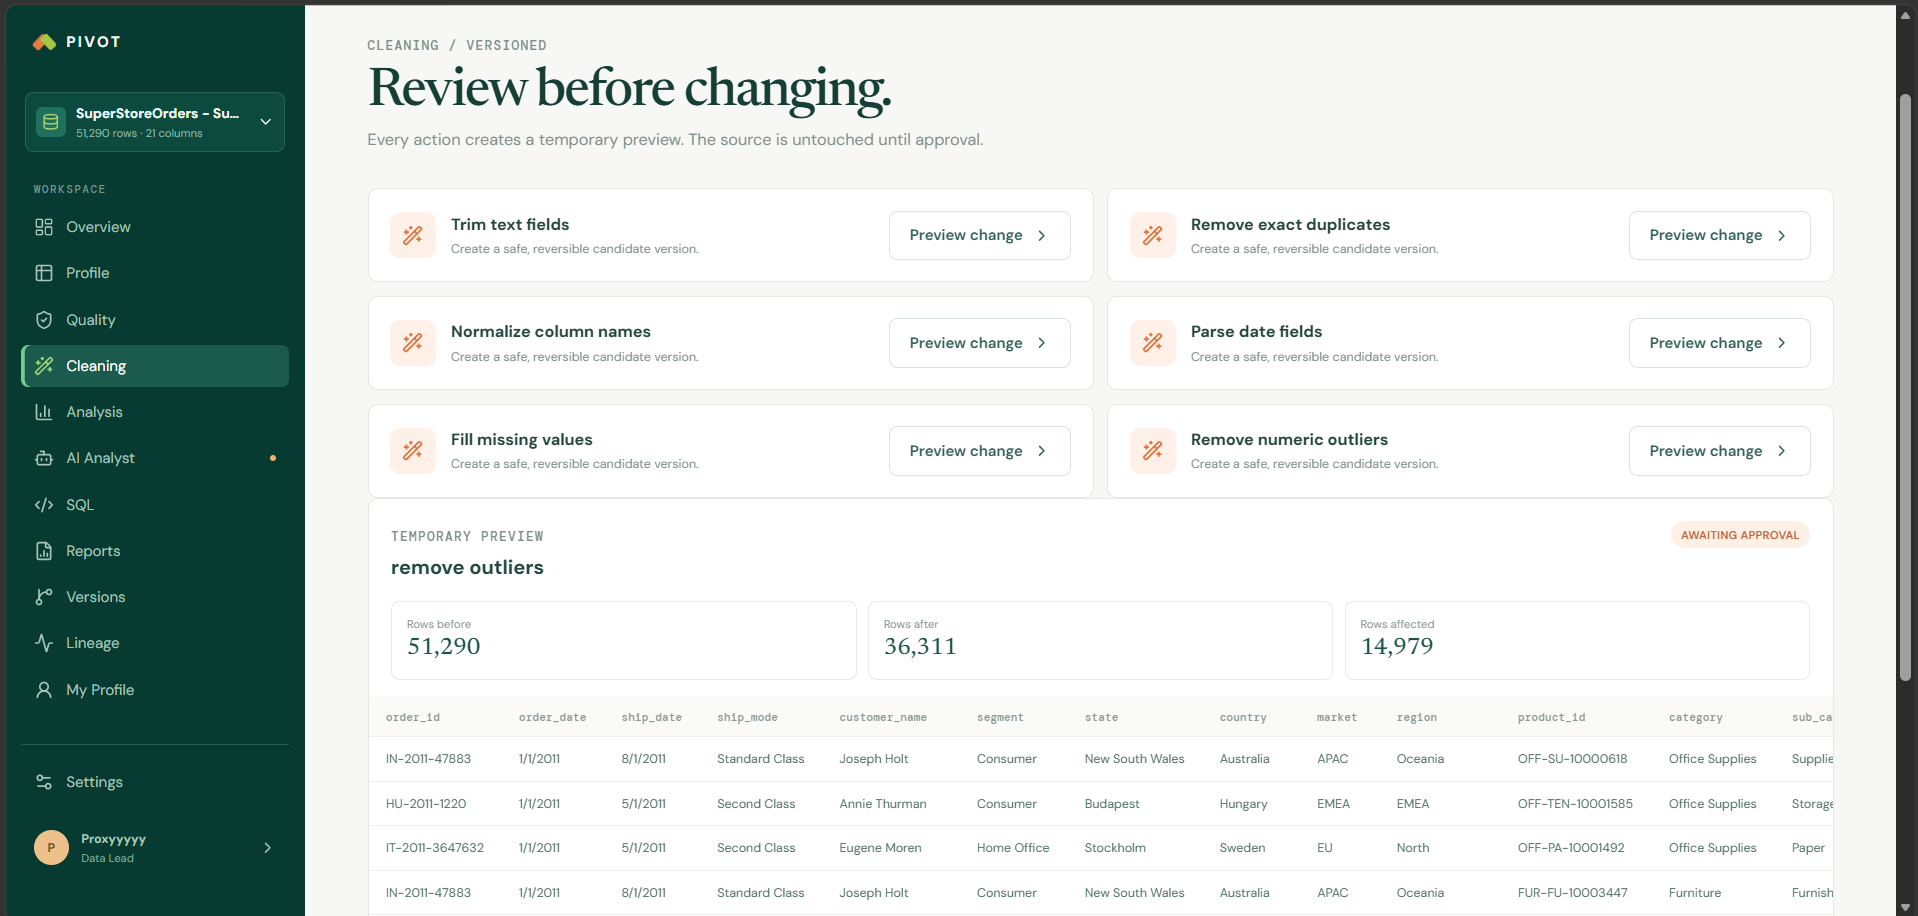
Cleaning Section, clean the mess
-
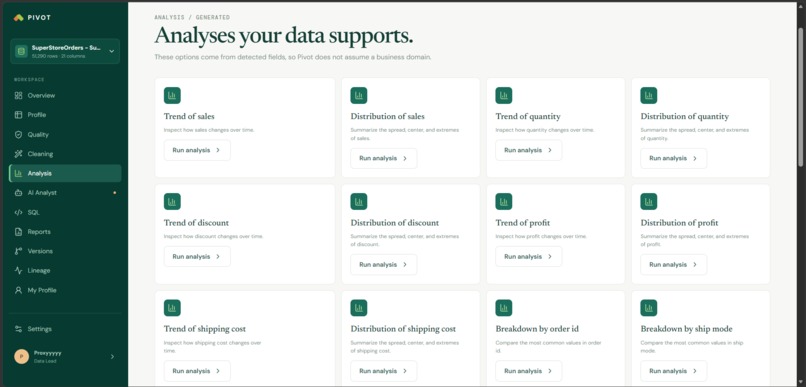
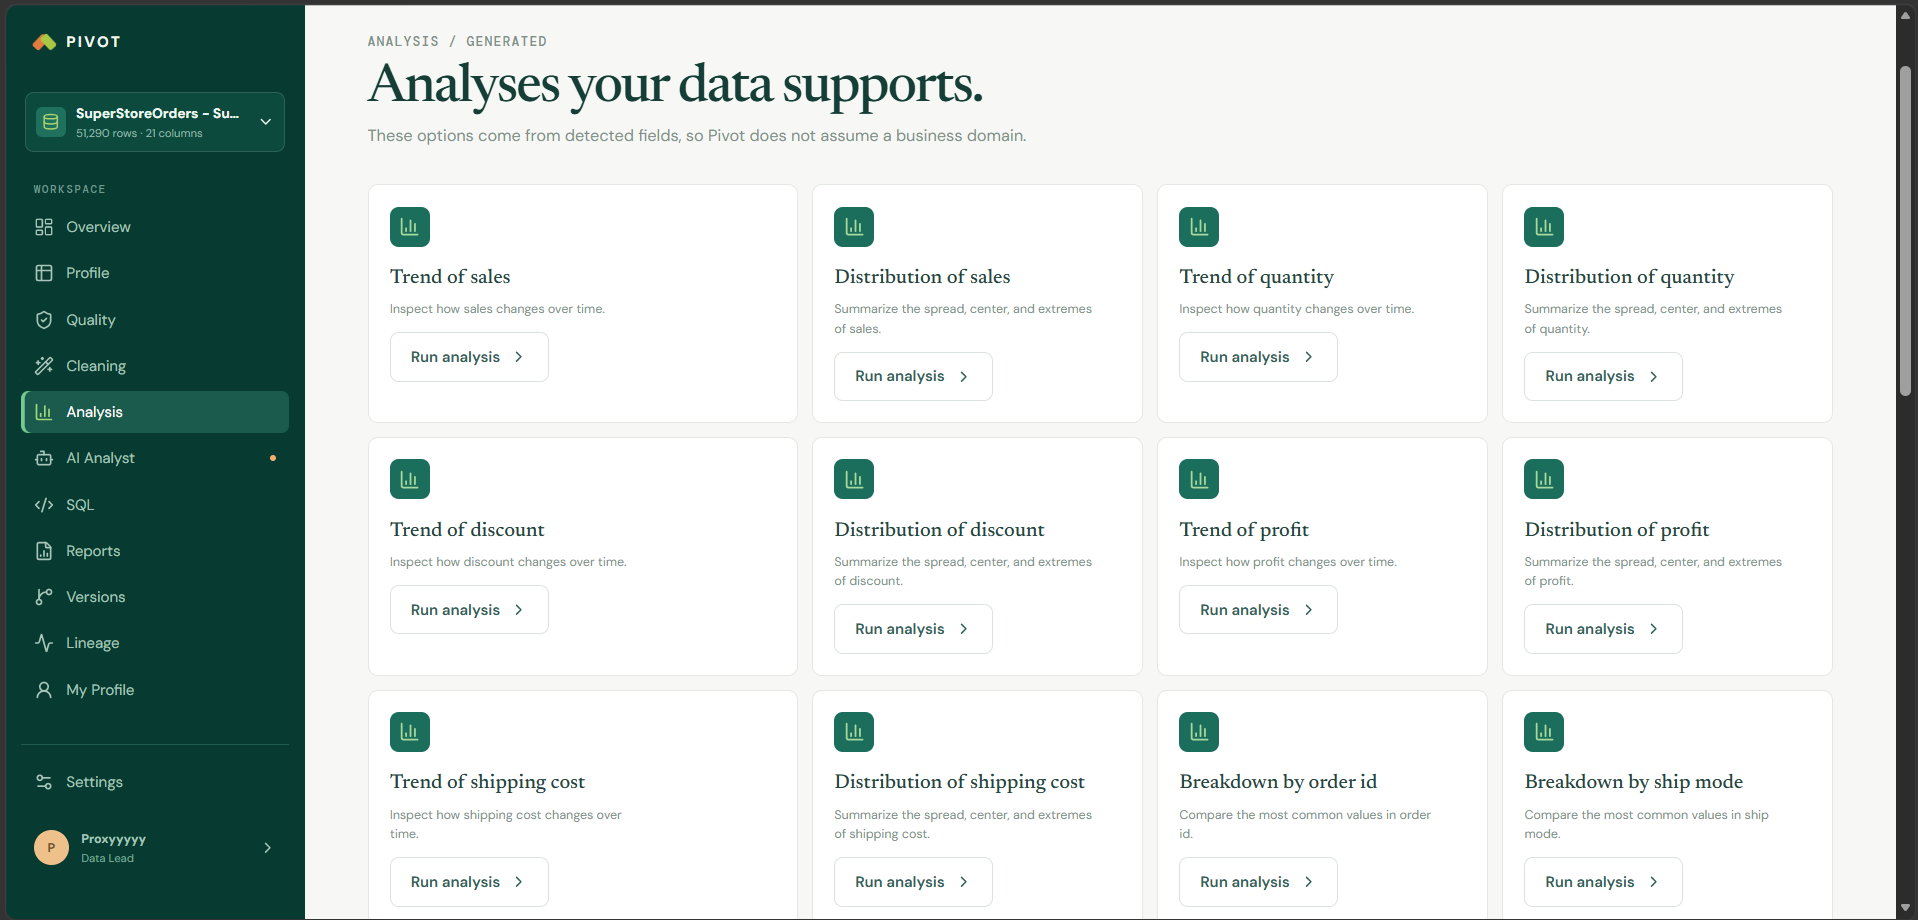
Analysis Section, analyse your data, find insights
-
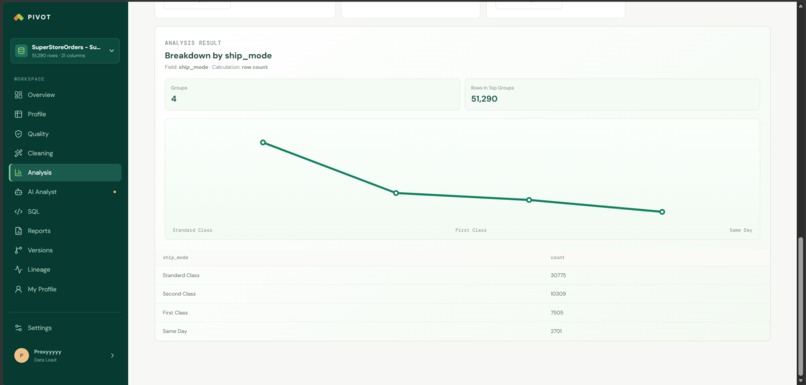
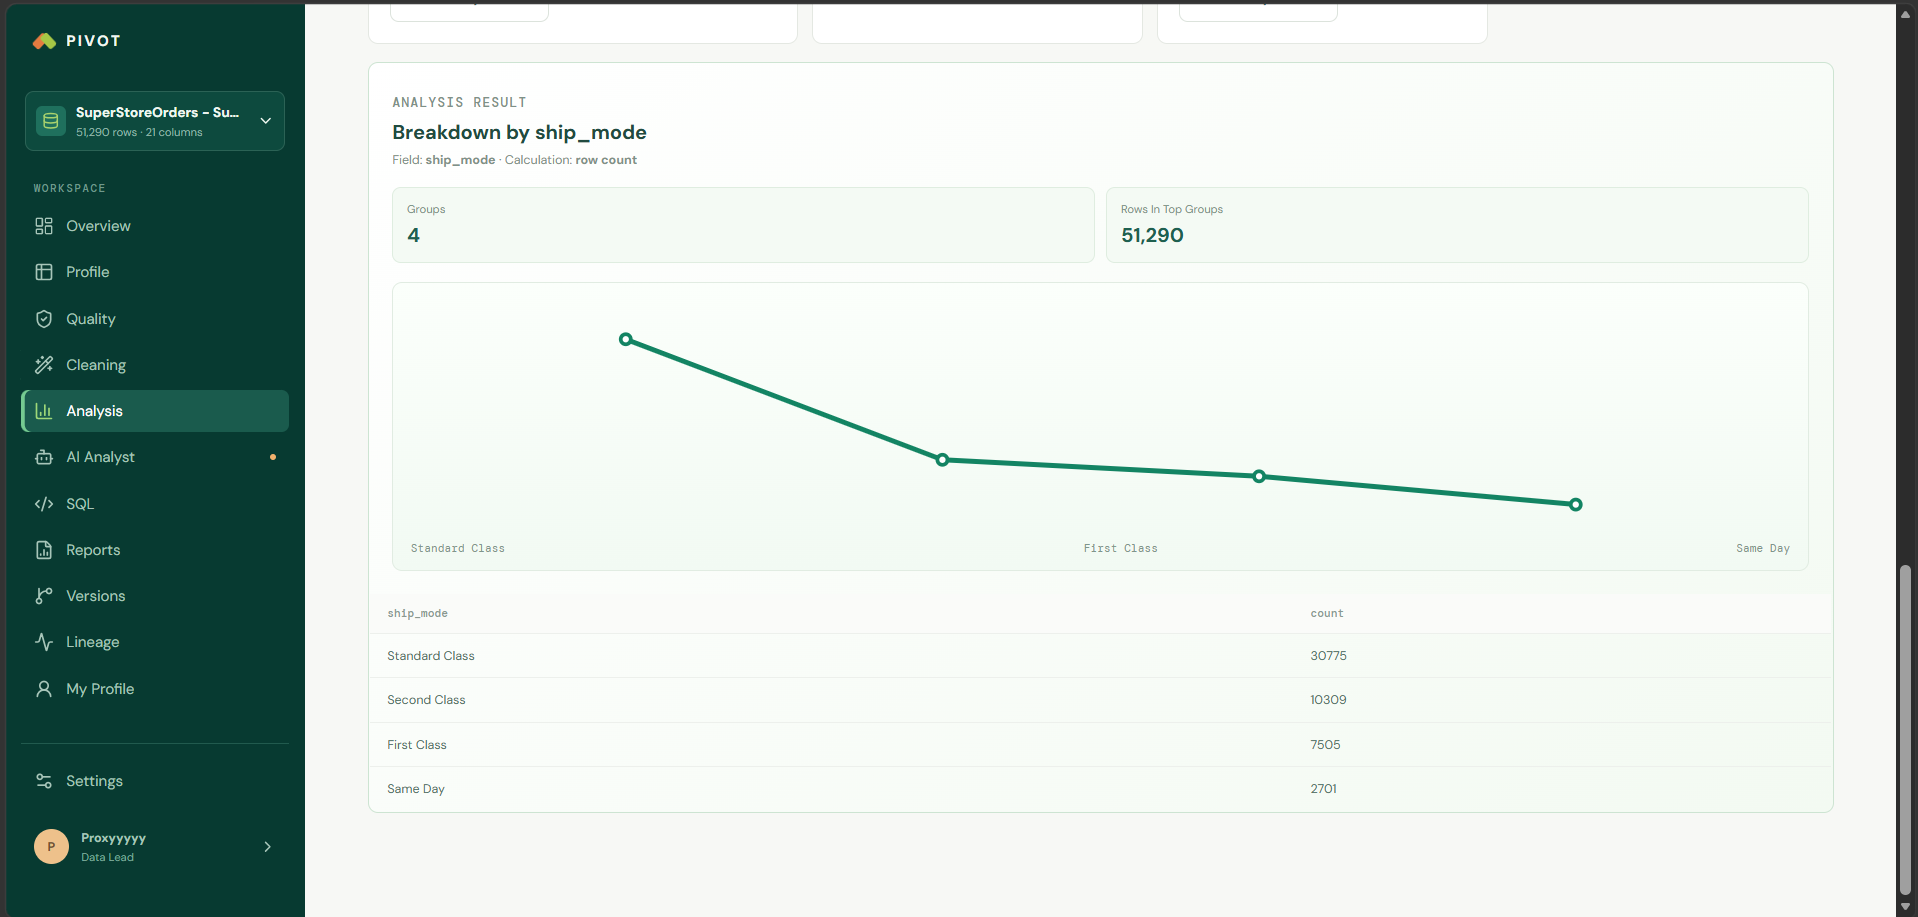
Analysis Section (part 2), check visuals, terms and more..
-
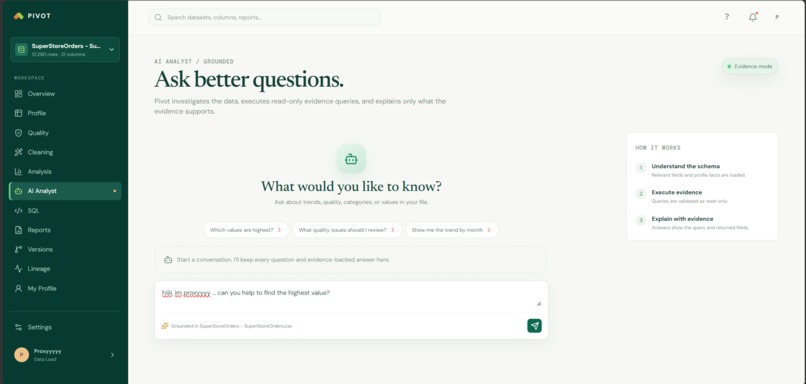
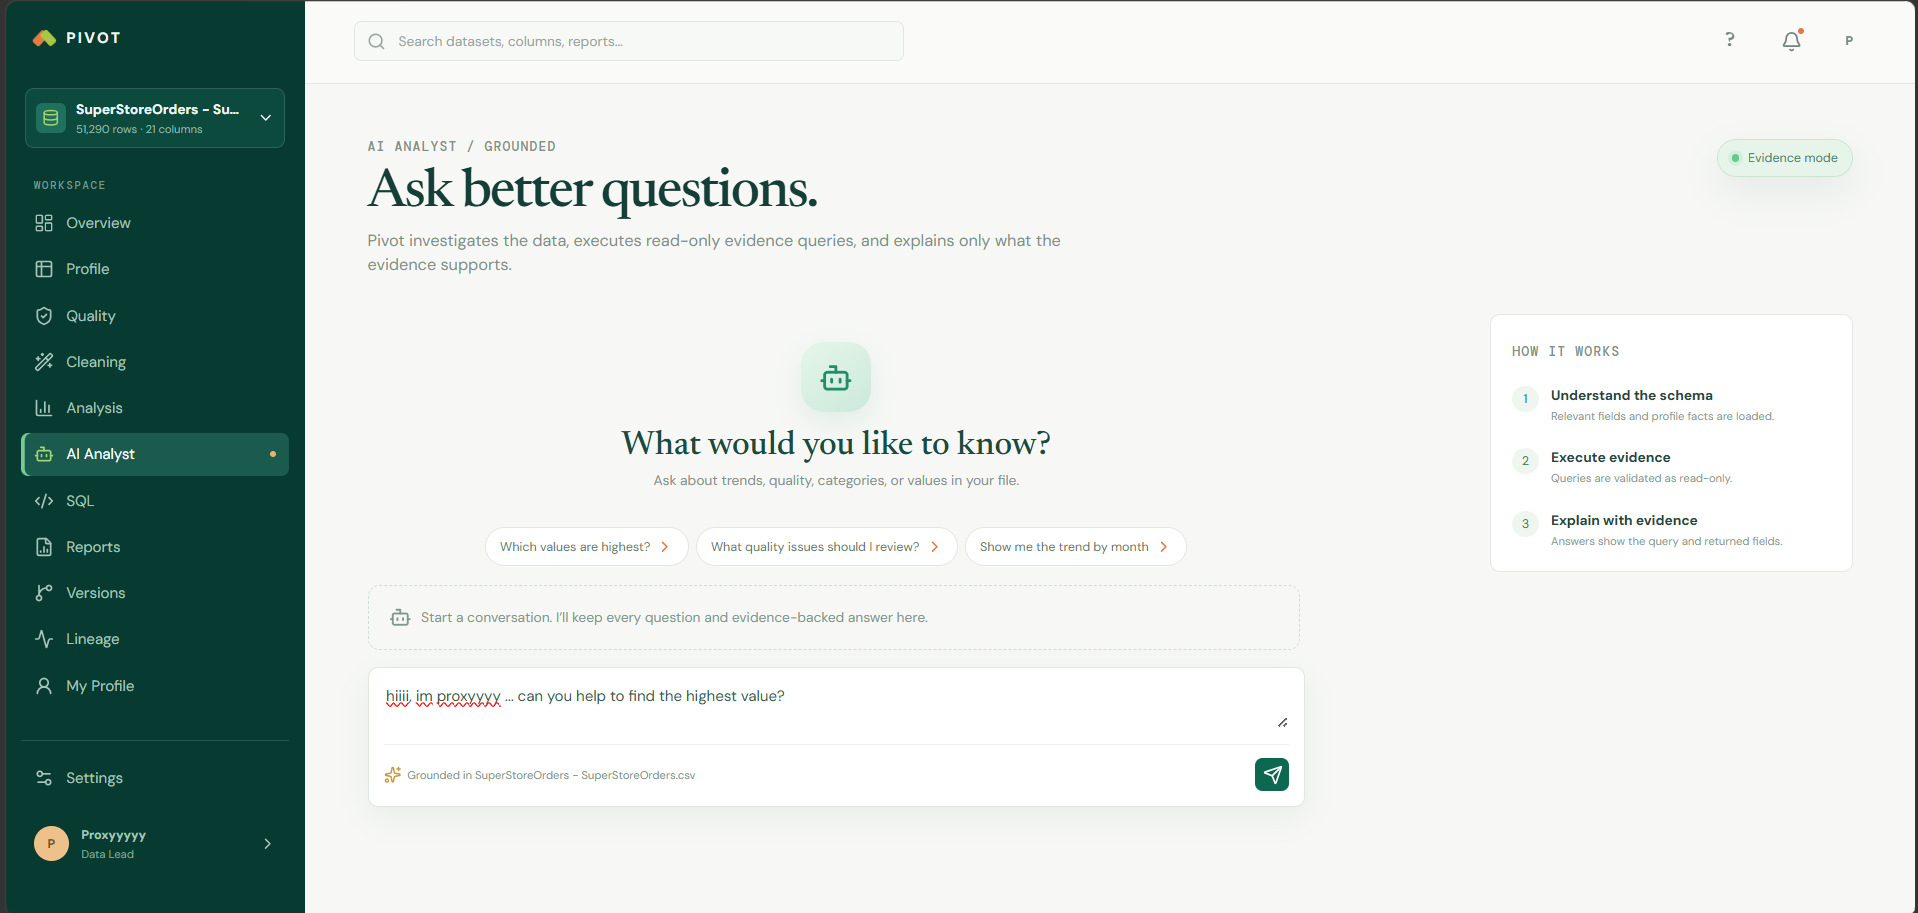
RAG AI Analyst Chatbot, ask and learn anything about your dataset
-
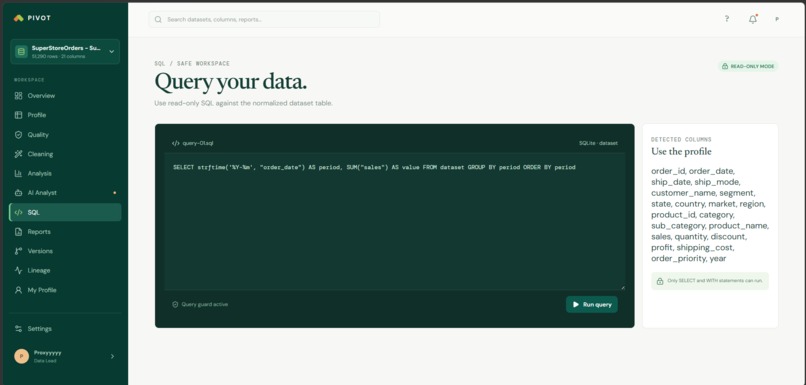
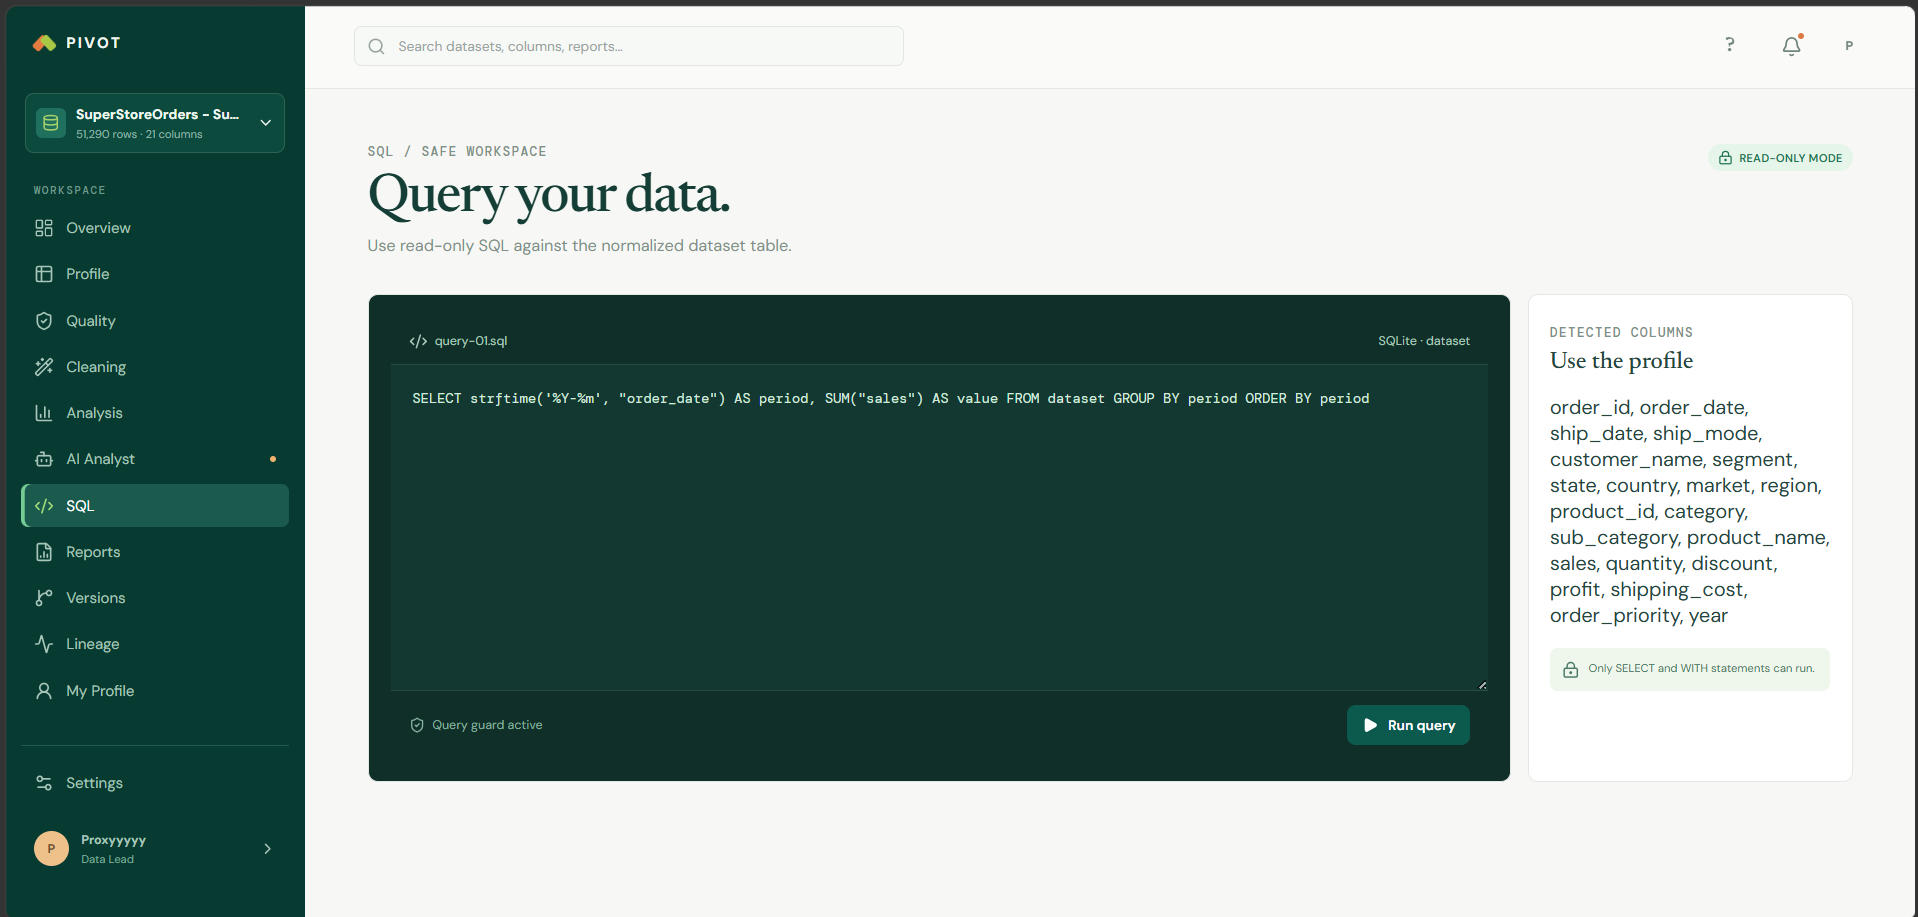
SQL Terminal to run DQL Queries
-
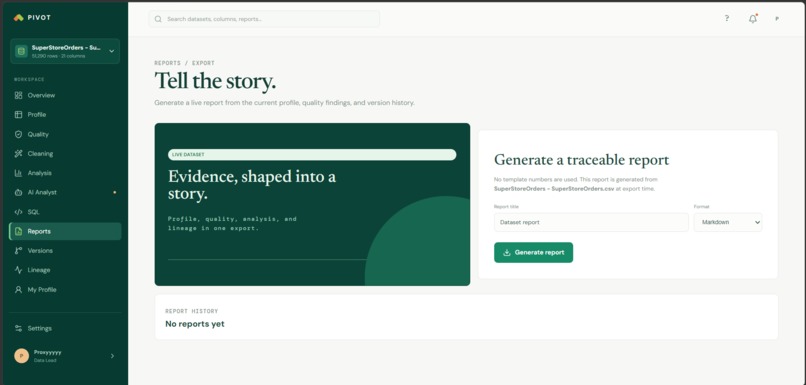
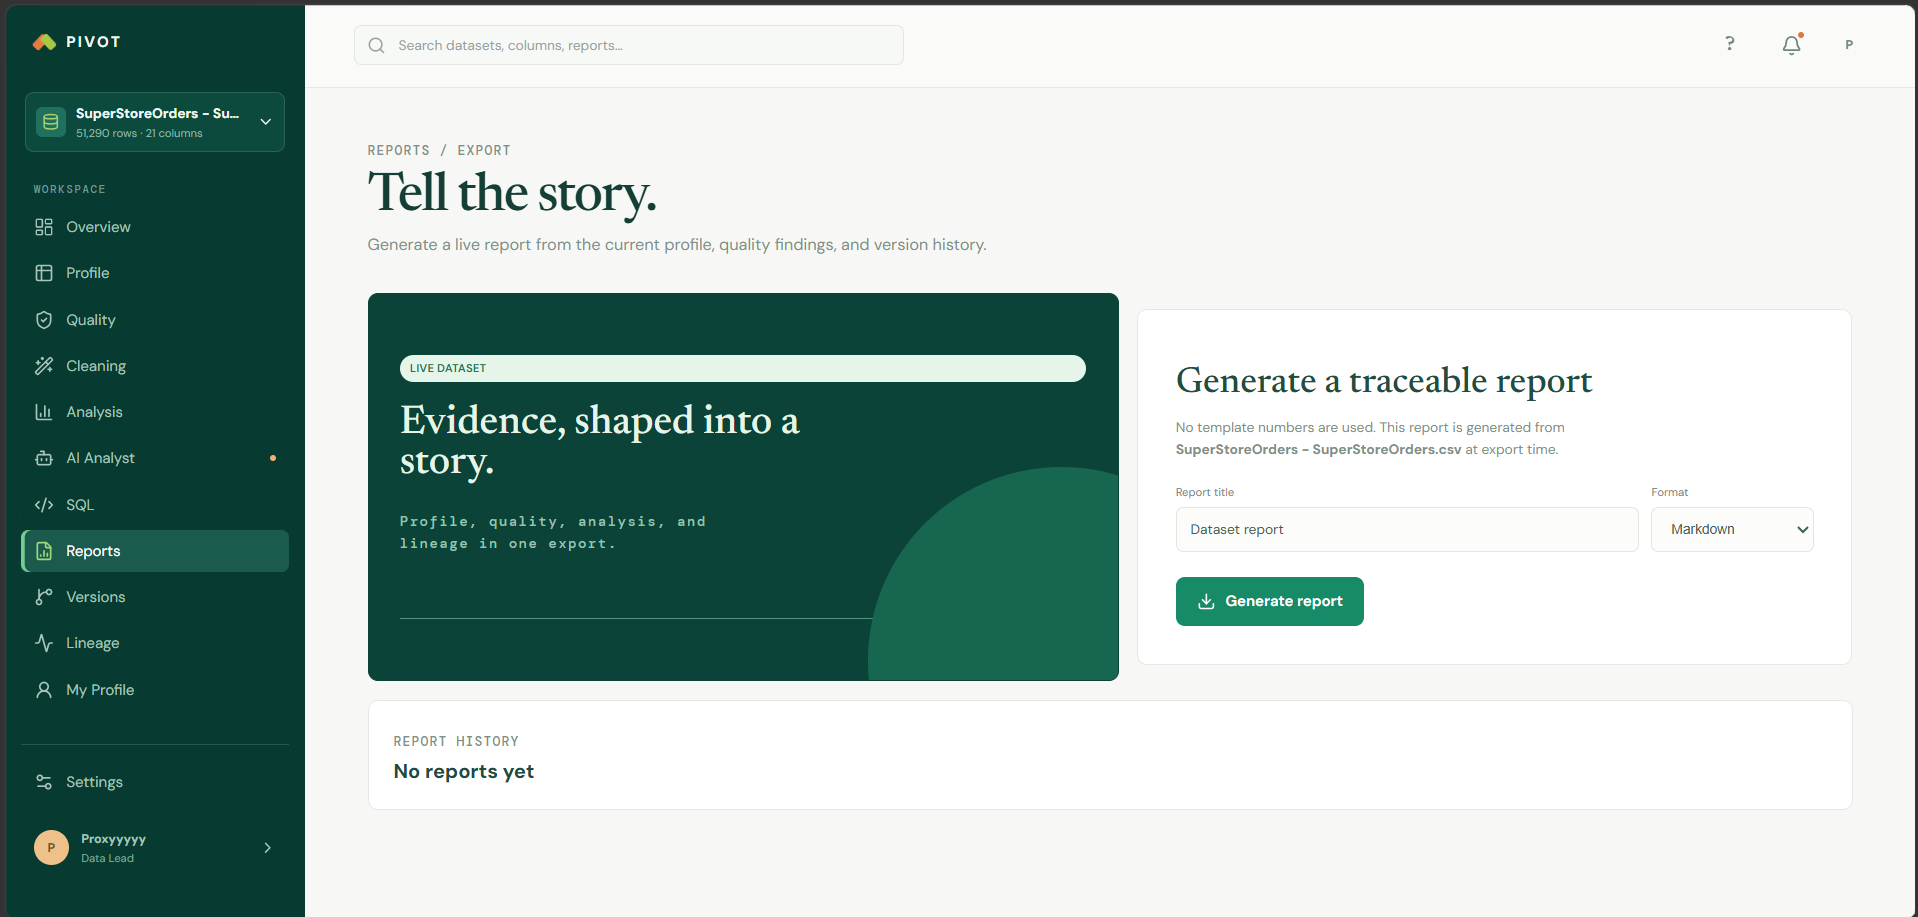
Download Reports about your dataset
-
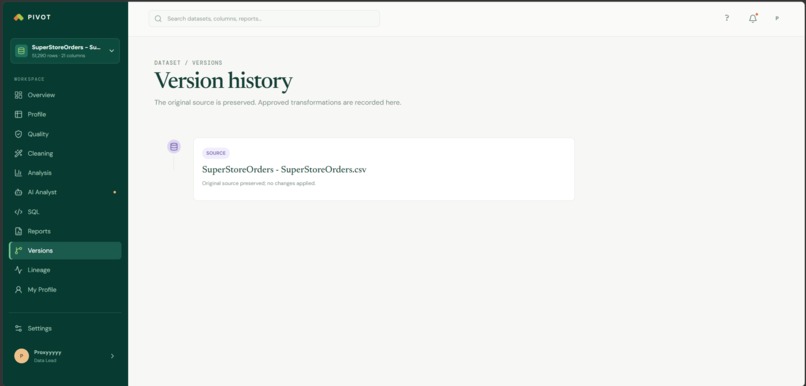
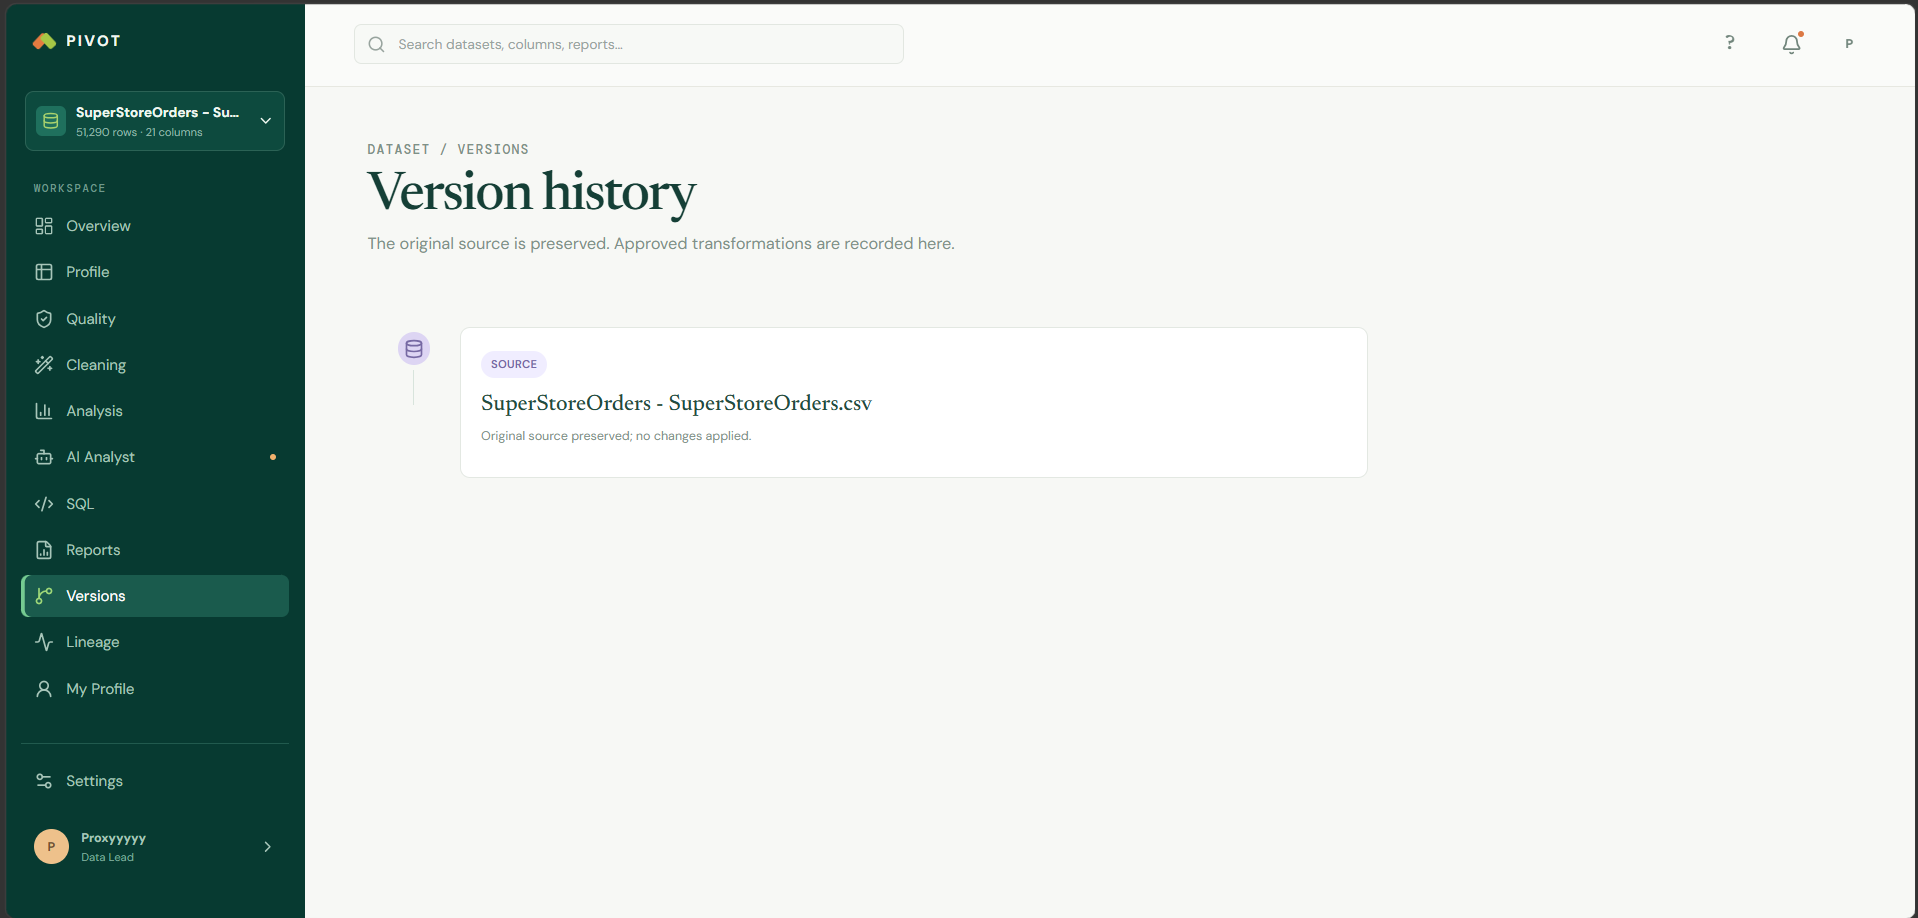
Version History, to check what are the things you did with your dataset.
-
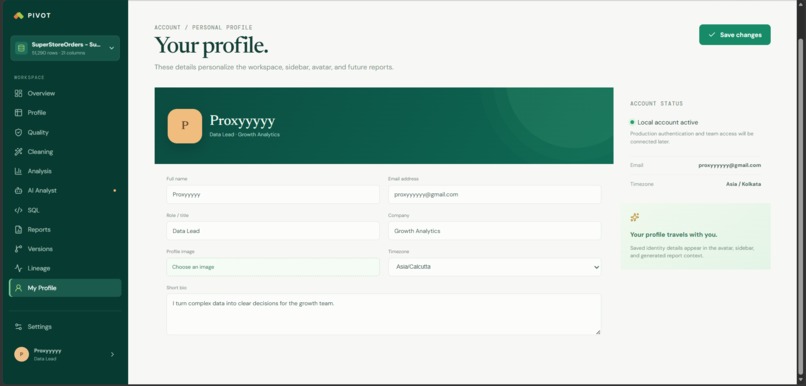
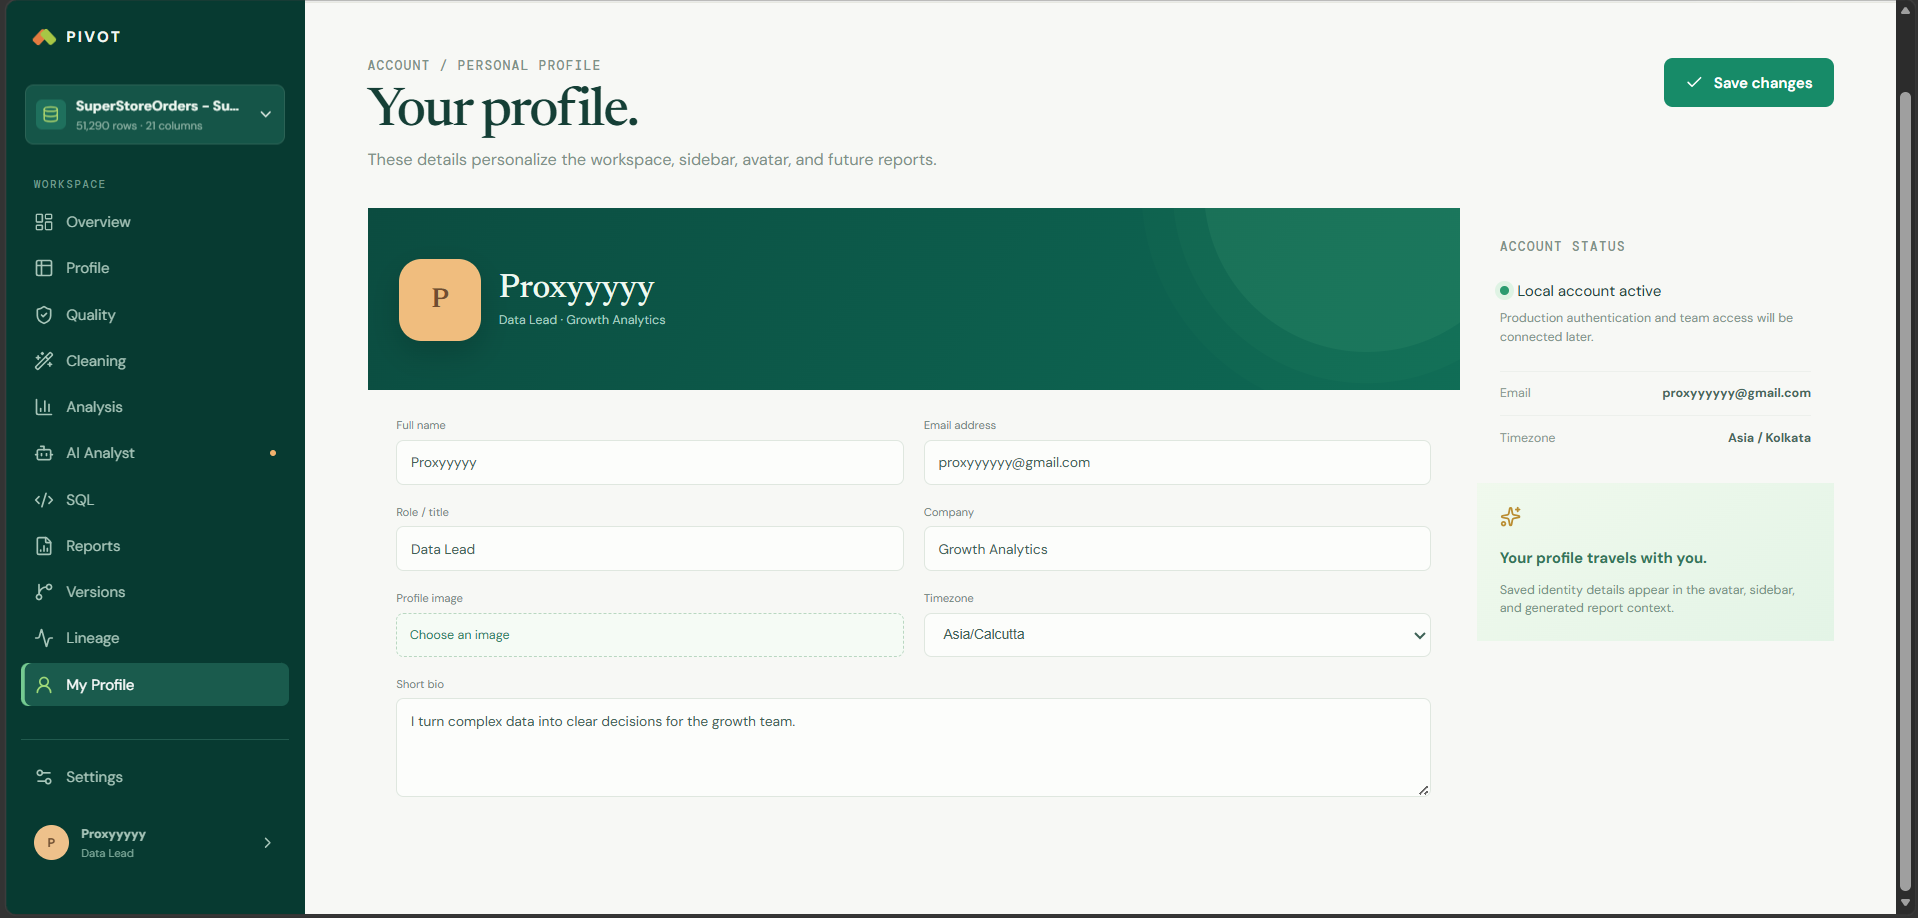
Profile Section to change your personal details.
-
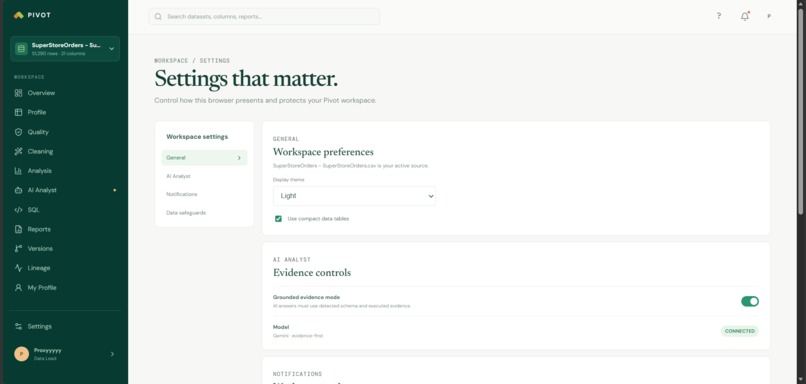
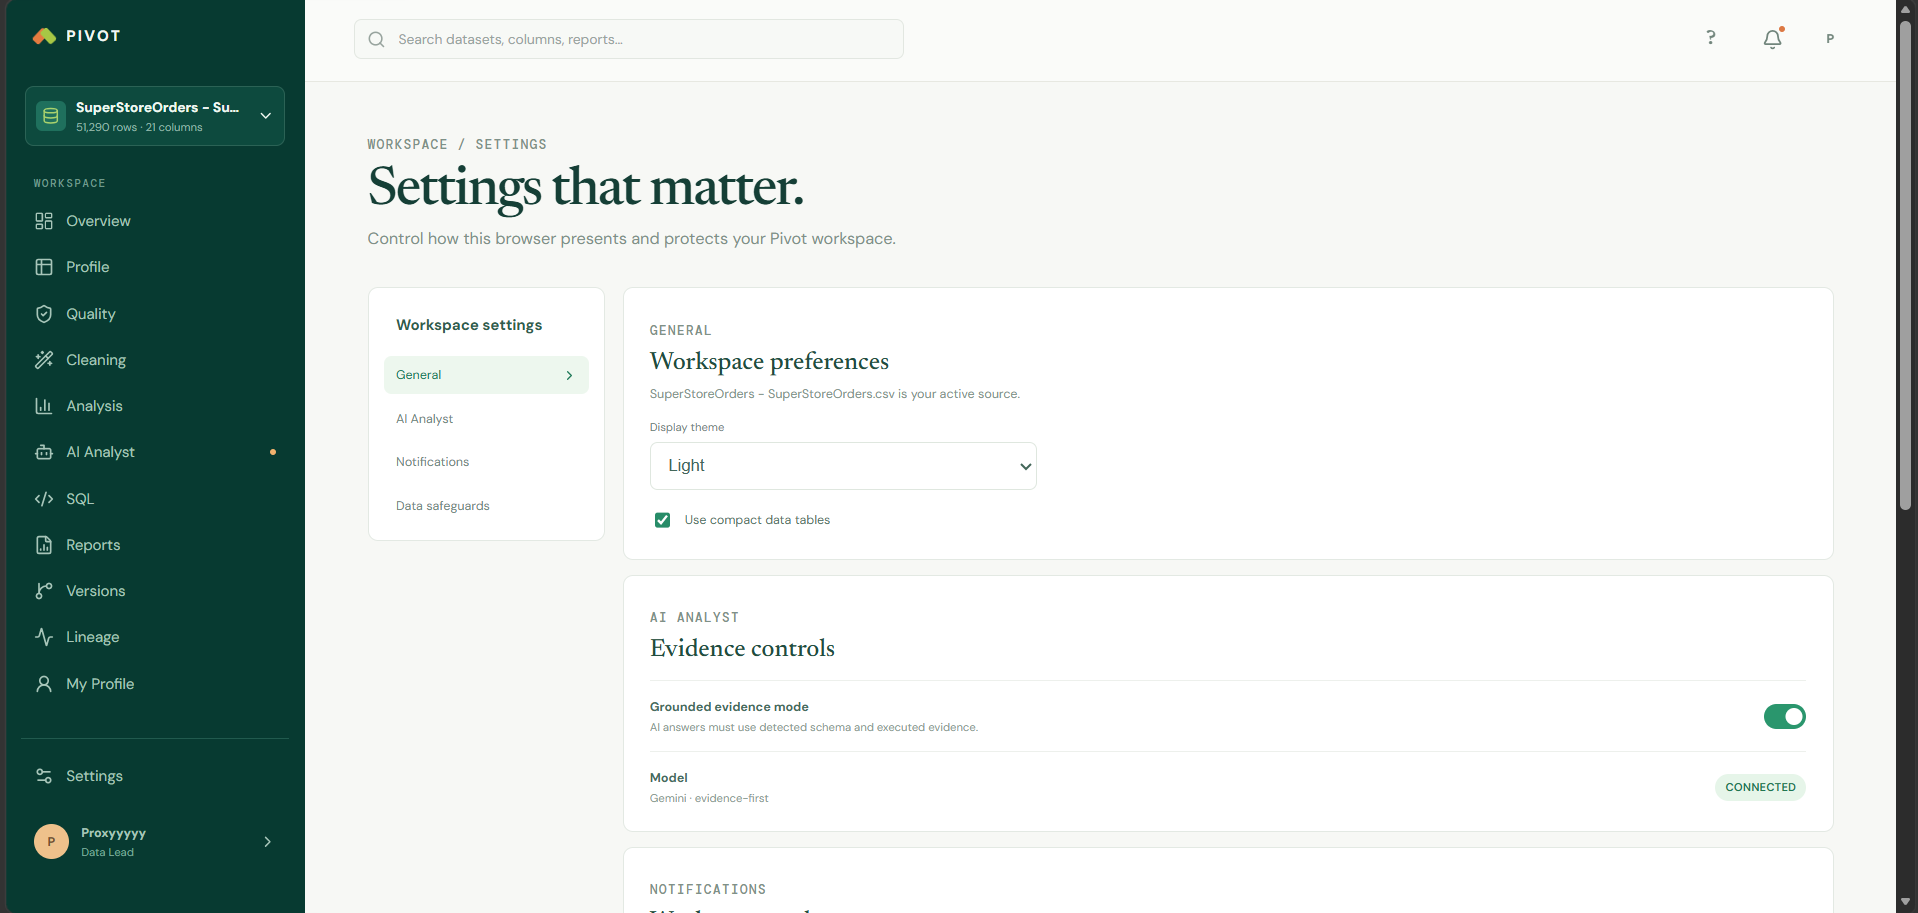
Settings
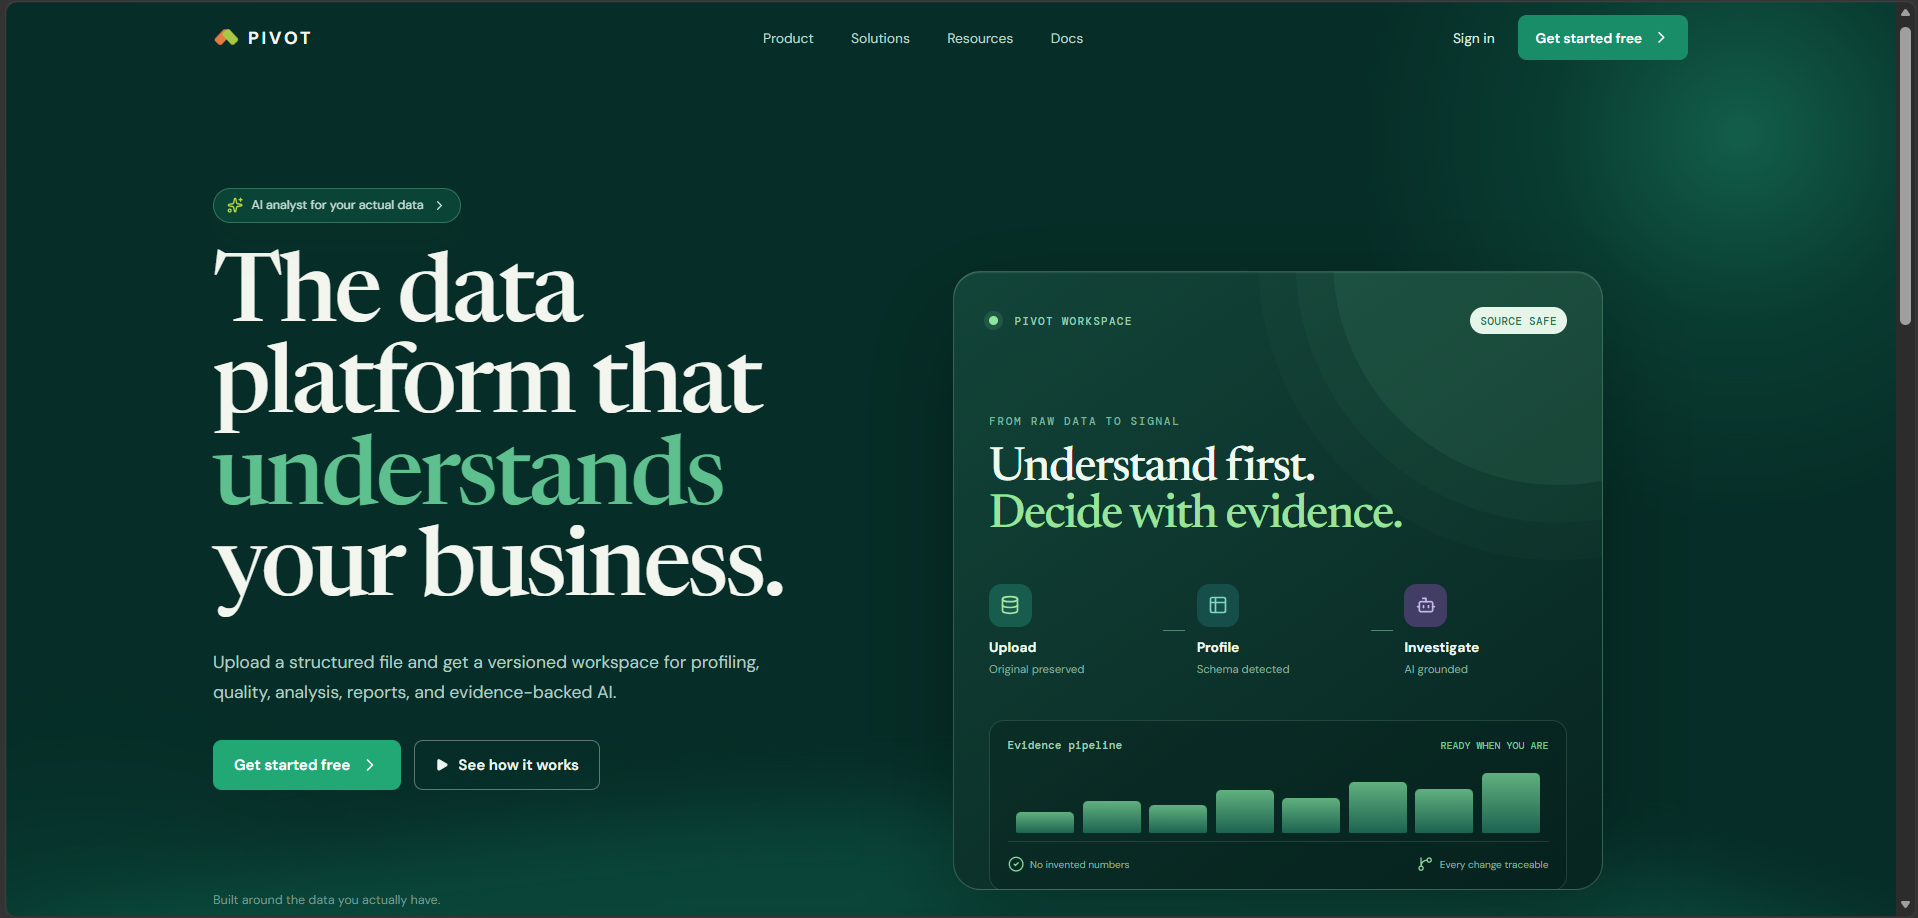
Inspiration
Data analysis still involves a lot of repetitive work. Before you can answer a simple business question, you often spend hours cleaning data, checking quality issues, writing SQL queries, creating visualizations, and preparing reports.
I wanted to build a platform that could automate most of this workflow while keeping every decision transparent and under the user's control. Instead of being just another AI chatbot or dashboard, Pivot is designed to become an AI-powered Business Intelligence platform that understands data before analyzing it.
The long-term vision is simple: upload a dataset, click one button, and receive a complete business briefing with insights, visualizations, forecasts, reports, and recommendations.
What it does
Pivot is an AI-powered Business Intelligence platform for exploring, cleaning, and analyzing CSV and Excel datasets.
After uploading a dataset, Pivot automatically profiles the data, detects quality issues, generates statistics, identifies relationships between columns, and creates a workspace around the dataset instead of modifying the original file.
The platform includes Pivot Analyst, an AI assistant powered by a Retrieval-Augmented Generation (RAG) pipeline. Before answering any question, it retrieves relevant information from the uploaded dataset so responses stay grounded in the user's data rather than relying on general AI knowledge.
Users can:
- Explore datasets using natural language
- Generate and execute safe read-only SQL queries
- Clean and transform datasets
- Detect anomalies and quality issues
- Generate charts and reports
- Analyze trends and business metrics
- Create new dataset versions without altering the original data
How we built it
Pivot is built using a modern full-stack architecture.
Frontend
- React
- Vite
- Recharts
Backend
- FastAPI
- Pandas
- NumPy
- Scikit-learn
- SQLite
AI
- Google Gemini API
- TF-IDF based Retrieval-Augmented Generation (RAG)
Every uploaded dataset goes through profiling, metadata extraction, quality analysis, and indexing before becoming available for AI analysis. All approved transformations create new dataset versions, allowing every change to remain traceable.
Challenges we ran into
The biggest challenge wasn't integrating AI—it was making the AI trustworthy.
Large language models are great at generating text but can hallucinate analytical results. To reduce this, I built a RAG pipeline that retrieves relevant dataset context before every response, allowing the AI to answer using the uploaded data instead of relying only on its training.
Another challenge was deciding when to use deterministic analysis versus AI reasoning. Many analytical tasks are solved directly with Pandas and SQL, while Gemini is used for more open-ended reasoning and explanation. Combining both approaches while keeping results consistent required a lot of experimentation.
Designing an architecture that supports profiling, cleaning, versioning, analytics, SQL execution, and AI inside a single workflow was another major challenge.
Accomplishments that we're proud of
- Built a complete Business Intelligence platform from scratch.
- Implemented a RAG-powered AI assistant for dataset-aware conversations.
- Created a version-controlled transformation workflow that preserves the original dataset.
- Added browser-based read-only SQL execution.
- Combined profiling, cleaning, analytics, reporting, AI, and dataset versioning into a unified workspace.
- Designed the project with a scalable architecture for future autonomous analysis.
What we learned
This project taught me much more than using AI APIs.
I learned how retrieval systems work, how to combine deterministic data analysis with large language models, how to design scalable backend workflows, and how difficult it is to make AI responses reliable instead of simply convincing.
Most importantly, I learned that building useful AI products requires much more engineering than prompting a language model.
What's next for Pivot
Pivot is still in its early stages, and the current version is only the foundation.
The long-term goal is to evolve Pivot into an autonomous AI Data Analyst capable of completing an entire analytical workflow with minimal user interaction.
Some of the features planned for future versions include:
- One-click automated dataset analysis
- AI-generated executive reports and presentation decks
- Agentic Python execution with self-correcting workflows
- Advanced forecasting and machine learning models
- Multi-table dataset support with automatic relationship detection
- Dynamic dashboard generation
- Business-aware RAG using company glossaries and documentation
- What-if simulations and executive Q&A
- Multi-user workspaces
- Database connectors
- Workflow automation and scheduled reporting
The ultimate vision is simple:
Upload a dataset, click one button, and let Pivot perform hours of analysis automatically while keeping every result transparent, explainable, and reproducible.

Log in or sign up for Devpost to join the conversation.