PITWALL
Don't analyze the race. Re-run it.
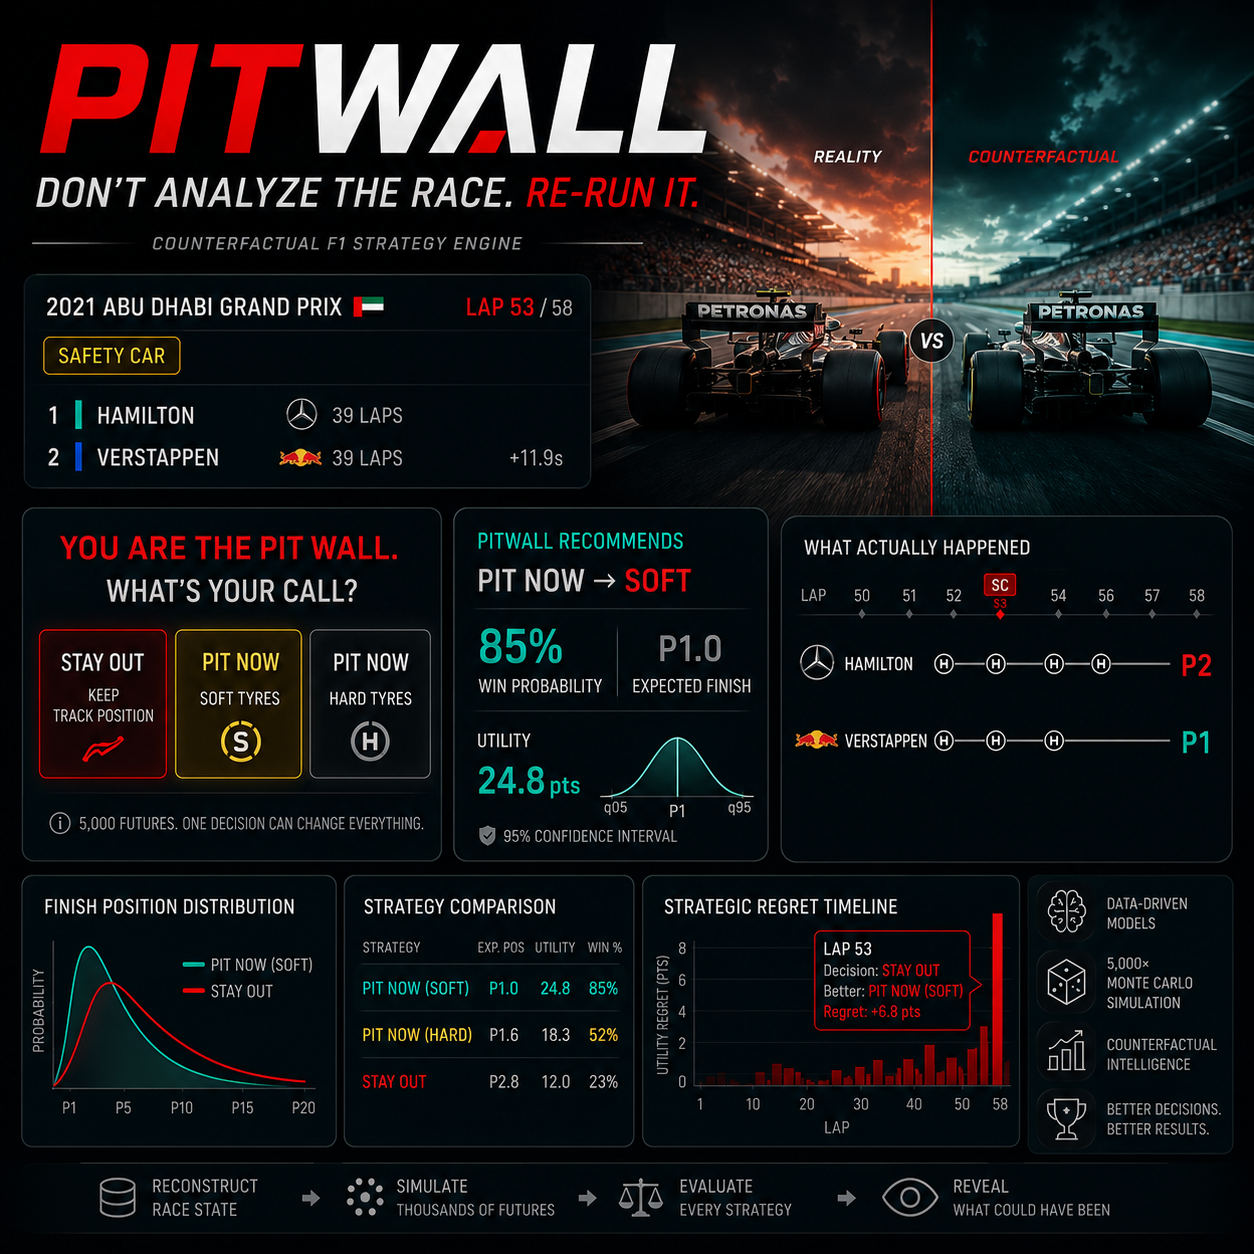
PITWALL is a counterfactual F1 strategy engine that reconstructs a race at a decision point, generates thousands of statistically paired futures, and determines which strategy had the strongest expected outcome given the information available at that exact moment.
Formula 1 is usually analyzed backwards.
The race ends. The data is collected. The charts are generated. The commentators explain what happened.
But the most interesting question is never what happened.
It is:
What should the pit wall have done when they had to make the decision?
That is the question PITWALL was built to answer.
Inspiration
There is something fundamentally strange about analyzing a race after it has already happened.
With hindsight, every decision looks obvious.
We know when the Safety Car appeared. We know which tyres survived. We know who won. We know when the overtake happened. We know exactly how the race ended.
A race engineer did not have that information.
At Lap 53, they had a completely different problem.
They had a live race state, imperfect information, worn tyres, traffic, pit lane loss, uncertainty around the restart, and a few seconds to decide.
Pit or stay out?
That decision could determine the entire race.
We wanted to build a system that could go back to that exact moment and ask:
If we froze the race right here, what would thousands of plausible futures look like?
And then:
Which decision survives those futures best?
That idea became PITWALL.
The Problem
Traditional race analytics are excellent at answering:
- What happened?
- Who was fastest?
- Which tyre was better?
- When did a driver pit?
- How did the race finish?
But they are much weaker at answering:
What would have happened if the decision had been different?
A simple replay cannot answer this.
Changing a pit stop changes tyre age.
That changes pace.
That changes gaps.
That changes traffic.
That changes overtaking opportunities.
That changes subsequent strategy.
One decision can propagate through the entire remaining race.
So a counterfactual race cannot simply be drawn.
It has to be simulated.
Our Approach
PITWALL reconstructs a race as a spatial and temporal state, freezes that state at a decision point, and then explores thousands of possible futures.
At a high level:
                    HISTORICAL RACE
                           │
                           ▼
                  ┌─────────────────┐
                  │  RECONSTRUCT    │
                  │   RACE STATE    │
                  └────────┬────────┘
                           │
                           ▼
                    DECISION POINT
                           │
                    ┌──────┴──────┐
                    │             │
                 STAY OUT       PIT NOW
                    │             │
                    └──────┬──────┘
                           │
                           ▼
                ┌────────────────────┐
                │  MONTE CARLO       │
                │  FUTURE GENERATOR  │
                └─────────┬──────────┘
                          │
             ┌────────────┼────────────┐
             ▼            ▼            ▼
          Future 1     Future 2     Future N
             │            │            │
             └────────────┼────────────┘
                          ▼
                ┌────────────────────┐
                │ STRATEGY EVALUATOR │
                └─────────┬──────────┘
                          ▼
                 ┌─────────────────┐
                 │ COUNTERFACTUAL  │
                 │   COMPARISON    │
                 └────────┬────────┘
                          ▼
                 WHAT SHOULD WE DO?
Decision-Time Mode
This is one of the most important ideas in PITWALL.
When the system is asked:
"What should the team have done on Lap 53?"
it is only allowed to use information that would have been available at Lap 53.
No future lap times.
No knowledge of the final winner.
No hindsight.
No information that appeared later in the race.
                    RACE TIMELINE

 ────────────────────────────────────────────────────────────►

  LAP 1                    LAP 53                    LAP 58
   │                         │                         │
   │     AVAILABLE DATA      │                         │
   │────────────────────────►│                         │
                             ▲
                             │
                       DECISION POINT

                       🚫 FUTURE DATA
                             │
                             X
This prevents one of the biggest problems in retrospective sports analysis:
information leakage.
PITWALL has two explicit operational modes:
Decision-Time
"What did we know then?"
Hindsight
"What do we know now?"
The difference between those two views is where the counterfactual becomes interesting.
The Simulation Engine
Once a race state is reconstructed, PITWALL generates thousands of possible futures.
The simulator models the interaction between:
- tyre degradation
- tyre age
- compound selection
- fuel load and pace decay
- stochastic pace variation
- pit stop time
- track position
- traffic
- dirty air
- overtaking probability
- Safety Car conditions
- race state transitions
The simulation is vectorized with NumPy and uses Common Random Numbers (CRN) when comparing candidate strategies.
This matters.
If we compare:
Strategy A: STAY OUT
Strategy B: PIT FOR SOFTS
we do not want random noise itself to dominate the comparison.
Both strategies should face comparable stochastic conditions.
CRN lets us pair the random sources used by competing strategies, improving the statistical quality of the comparison.
Conceptually:
                 SAME RANDOM WORLD

              ┌───────────────────┐
              │   Future #0001    │
              └─────────┬─────────┘
                        │
              ┌─────────┴─────────┐
              ▼                   ▼
         STRATEGY A           STRATEGY B
          STAY OUT             PIT SOFT
              │                   │
              ▼                   ▼
          RESULT A             RESULT B


              ┌───────────────────┐
              │   Future #0002    │
              └─────────┬─────────┘
                        │
              ┌─────────┴─────────┐
              ▼                   ▼
         STRATEGY A           STRATEGY B
Instead of asking:
"Which simulation happened to get luckier?"
we can ask:
"Under comparable conditions, how much better is the decision?"
From Simulation to Strategy
PITWALL does not simply simulate one strategy.
It searches a strategy space.
For example:
                 CANDIDATE STRATEGIES

                       LAP 53
                         │
          ┌──────────────┼──────────────┐
          │              │              │
       STAY OUT       PIT SOFT       PIT HARD
          │              │              │
          ▼              ▼              ▼
      Thousands       Thousands       Thousands
       of futures      of futures       of futures
          │              │              │
          └──────────────┼──────────────┘
                         ▼
                  STRATEGY RANKING
                         │
                         ▼
                 OPTIMAL REGION
The optimizer first performs coarse screening and then refines promising candidates.
It evaluates expected utility, finish position, outcome distributions, and uncertainty.
We calculate:
$$ U(a) = \mathbb{E}[\text{Points}] - \lambda \operatorname{Var}(\text{Position}) $$
and define strategic regret as:
$$ R(a) = U(a^*) - U(a) $$
where $a^*$ is the best available strategy.
This gives us something much more useful than:
"The driver should have pitted."
We can instead say:
"This decision had an estimated strategic regret of X, with a confidence interval of Y."
Counterfactual Replay
This is where PITWALL stops being a dashboard.
It becomes a time machine.
Take a historical decision.
Freeze the race.
Choose a different strategy.
Then run the race again.
                  HISTORICAL RACE

Lap 53
  │
  ├── ACTUAL DECISION
  │       STAY OUT
  │
  ▼
  P2
  │
  ▼
  P1
  │
  ▼
  FINAL RESULT


                  COUNTERFACTUAL

Lap 53
  │
  ├── ALTERNATIVE DECISION
  │       PIT → SOFT
  │
  ▼
  FRESH TYRES
  │
  ▼
  DIFFERENT PACE
  │
  ▼
  DIFFERENT GAPS
  │
  ▼
  DIFFERENT OVERTAKING STATE
  │
  ▼
  DIFFERENT FINAL OUTCOME
The two trajectories can then be placed side by side.
Reality vs Counterfactual.
Not as a hypothetical paragraph.
As a simulated race.
Blind Pit Wall
One of our favorite parts of PITWALL is the Blind Pit Wall Challenge.
The user becomes the race engineer.
They are shown the state of the race at a decision point.
They have to make the call.
They do not get to see the future.
┌─────────────────────────────────────────────┐
│              YOU ARE THE PIT WALL           │
│                                             │
│ LAP 53                    SAFETY CAR         │
│                                             │
│ HAMILTON                         P1         │
│ VERSTAPPEN                       P2         │
│                                             │
│ What is your call?                          │
│                                             │
│ ┌─────────┐ ┌────────────┐ ┌────────────┐  │
│ │ STAY    │ │ PIT SOFT   │ │ PIT HARD   │  │
│ │ OUT     │ │            │ │            │  │
│ └─────────┘ └────────────┘ └────────────┘  │
│                                             │
│             [ LOCK IN DECISION ]            │
└─────────────────────────────────────────────┘
Only after the decision is locked does PITWALL reveal:
- What the model recommended
- What actually happened
- What thousands of simulated futures predicted
- What the counterfactual trajectory looked like
- How much strategic regret was associated with the historical decision
This turns an analytical system into an experience.
Race Autopsy
After the race, PITWALL can work backwards.
Instead of asking:
"Who won?"
we ask:
"Where did the race change?"
Every major strategic decision becomes a point on a timeline.
UTILITY
REGRET
  ▲
  │
8 │                                             █
  │                                         ████
6 │                                    █████
  │                              ██████
4 │                         ███
  │                   ███
2 │        ██     ███
  │   █████
0 └──────────────────────────────────────────────► LAP
    1        10       20       30       40   53 58
                                             ▲
                                        CRITICAL
                                        DECISION
A judge can click a decision and see:
What happened
What information was available
What PITWALL recommended
What the team actually did
Expected position delta
Utility regret
Statistical confidence
The result is an analytical postmortem of the race.
Validation
A counterfactual system cannot simply produce pretty numbers.
It has to be tested.
PITWALL includes a multi-race benchmark spanning:
- 2021 Abu Dhabi
- 2022 Monaco
- 2022 Silverstone
- 2023 Zandvoort
The validation pipeline evaluates the underlying models using metrics including:
- RMSE
- MAE
- Brier Score
- Ranked Probability Score
- Earth Mover's Distance
- calibration diagnostics
- rolling-origin evaluation
- model ablation
The goal is not to make the model look intelligent.
The goal is to determine where it is actually reliable.
Architecture
PITWALL is deliberately split into independent layers.
┌──────────────────────────────────────────────────────┐
│                    REACT FRONTEND                    │
│                                                      │
│ Command Center │ Strategy Simulator │ Replay │ Autopsy│
└──────────────────────────┬───────────────────────────┘
                           │
                           │ REST / JSON
                           ▼
┌──────────────────────────────────────────────────────┐
│                    FASTAPI API                       │
│                                                      │
│ Race State │ Simulation │ Counterfactual │ Autopsy   │
└───────────────┬──────────────────┬───────────────────┘
                │                  │
                ▼                  ▼
       ┌────────────────┐  ┌────────────────────┐
       │  STATE ENGINE  │  │ STRATEGY ENGINE    │
       │                │  │                    │
       │ RaceState(t)   │  │ Optimizer          │
       │ Decision-Time  │  │ Regret             │
       │ Hindsight      │  │ Confidence         │
       └───────┬────────┘  └─────────┬──────────┘
               │                     │
               └──────────┬──────────┘
                          ▼
                ┌────────────────────┐
                │ MONTE CARLO ENGINE │
                │                    │
                │ CRN                │
                │ Pace               │
                │ Tyres              │
                │ Traffic            │
                │ Overtakes          │
                │ Safety Car         │
                └─────────┬──────────┘
                          │
                          ▼
                  ┌───────────────┐
                  │    DUCKDB     │
                  │               │
                  │ Historical    │
                  │ Race Data     │
                  └───────────────┘
The architecture intentionally keeps data ingestion, state reconstruction, physical/statistical models, simulation, optimization, API, and visualization separate.
That means a model can be replaced without rebuilding the entire application.
Engineering Challenges
The hardest part was not drawing a chart.
It was deciding what the system was actually allowed to know.
A conventional analytics application can freely use historical data because the answer already exists.
A counterfactual engine cannot.
If we accidentally allow future information into a Decision-Time simulation, we can produce an extremely convincing answer that is fundamentally invalid.
So PITWALL treats information availability as part of the model itself.
Another challenge was stochastic comparison.
If two strategies are simulated using unrelated random conditions, a strategy can appear better simply because it received a more favorable simulated world.
That is why the simulator uses paired Common Random Numbers.
Finally, a race is not a collection of independent lap predictions.
One change propagates.
A pit stop changes tyre age.
Tyre age changes pace.
Pace changes gaps.
Gaps change traffic.
Traffic changes overtaking.
Overtaking changes position.
Position changes subsequent strategy.
PITWALL therefore models the race as a state transition system, rather than a static collection of predictions.
What We Learned
The biggest lesson was that uncertainty is not noise to be hidden.
It is part of the answer.
If two strategies have statistically indistinguishable outcomes, PITWALL should say so.
If one strategy dominates across thousands of simulated futures, PITWALL should say that too.
The goal is not:
"Our AI knows what would have happened."
The goal is:
"Given what was known at the time, this decision had the strongest evidence behind it."
That distinction completely changes how sports analytics can be presented.
Why PITWALL Is Different
Most sports analytics systems are built around dashboards.
PITWALL is built around decisions.
Most dashboards start with the question:
"What happened?"
PITWALL starts with:
"What would you have done?"
Most predictive systems produce one number.
PITWALL produces a distribution.
Most retrospective analysis has hindsight.
PITWALL explicitly separates hindsight from decision-time information.
Most counterfactual demonstrations simply change the final result.
PITWALL re-simulates the chain of events that leads to that result.
That is the difference between a chart and a counterfactual engine.
The PITWALL Loop
       ┌─────────────────┐
       │  RECONSTRUCT    │
       │   THE RACE      │
       └────────┬────────┘
                │
                ▼
       ┌─────────────────┐
       │ FREEZE THE      │
       │ DECISION POINT  │
       └────────┬────────┘
                │
                ▼
       ┌─────────────────┐
       │ GENERATE        │
       │ 5,000 FUTURES   │
       └────────┬────────┘
                │
                ▼
       ┌─────────────────┐
       │ EVALUATE EVERY  │
       │ STRATEGY        │
       └────────┬────────┘
                │
                ▼
       ┌─────────────────┐
       │ MEASURE REGRET  │
       │ + UNCERTAINTY   │
       └────────┬────────┘
                │
                ▼
       ┌─────────────────┐
       │ REPLAY THE      │
       │ COUNTERFACTUAL  │
       └────────┬────────┘
                │
                ▼
       ┌─────────────────┐
       │ REVEAL WHAT     │
       │ COULD HAVE BEEN │
       └─────────────────┘
Built for the Pit Wall
PITWALL was designed around one simple idea:
A race is not finished when the chequered flag falls.
There are thousands of alternate races that could have happened.
Different pit stops.
Different tyres.
Different traffic.
Different overtakes.
Different decisions.
Different outcomes.
We cannot travel back in time.
But we can reconstruct the state of the race, model the uncertainty, and simulate the futures that were still possible.
That is what PITWALL does.

Log in or sign up for Devpost to join the conversation.