-
-
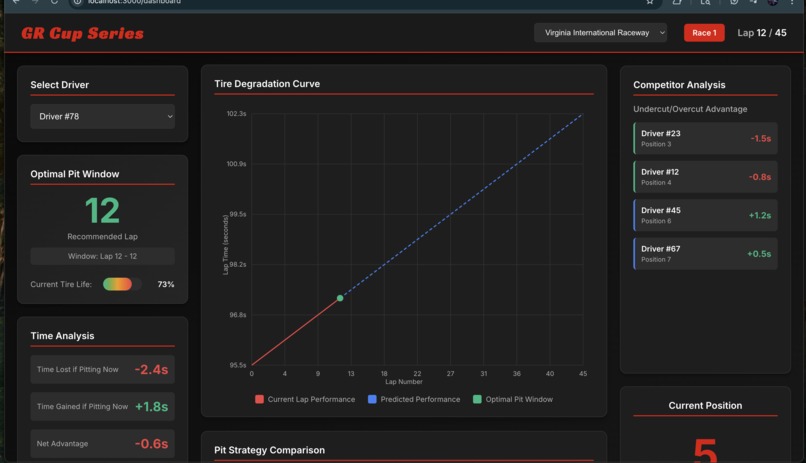
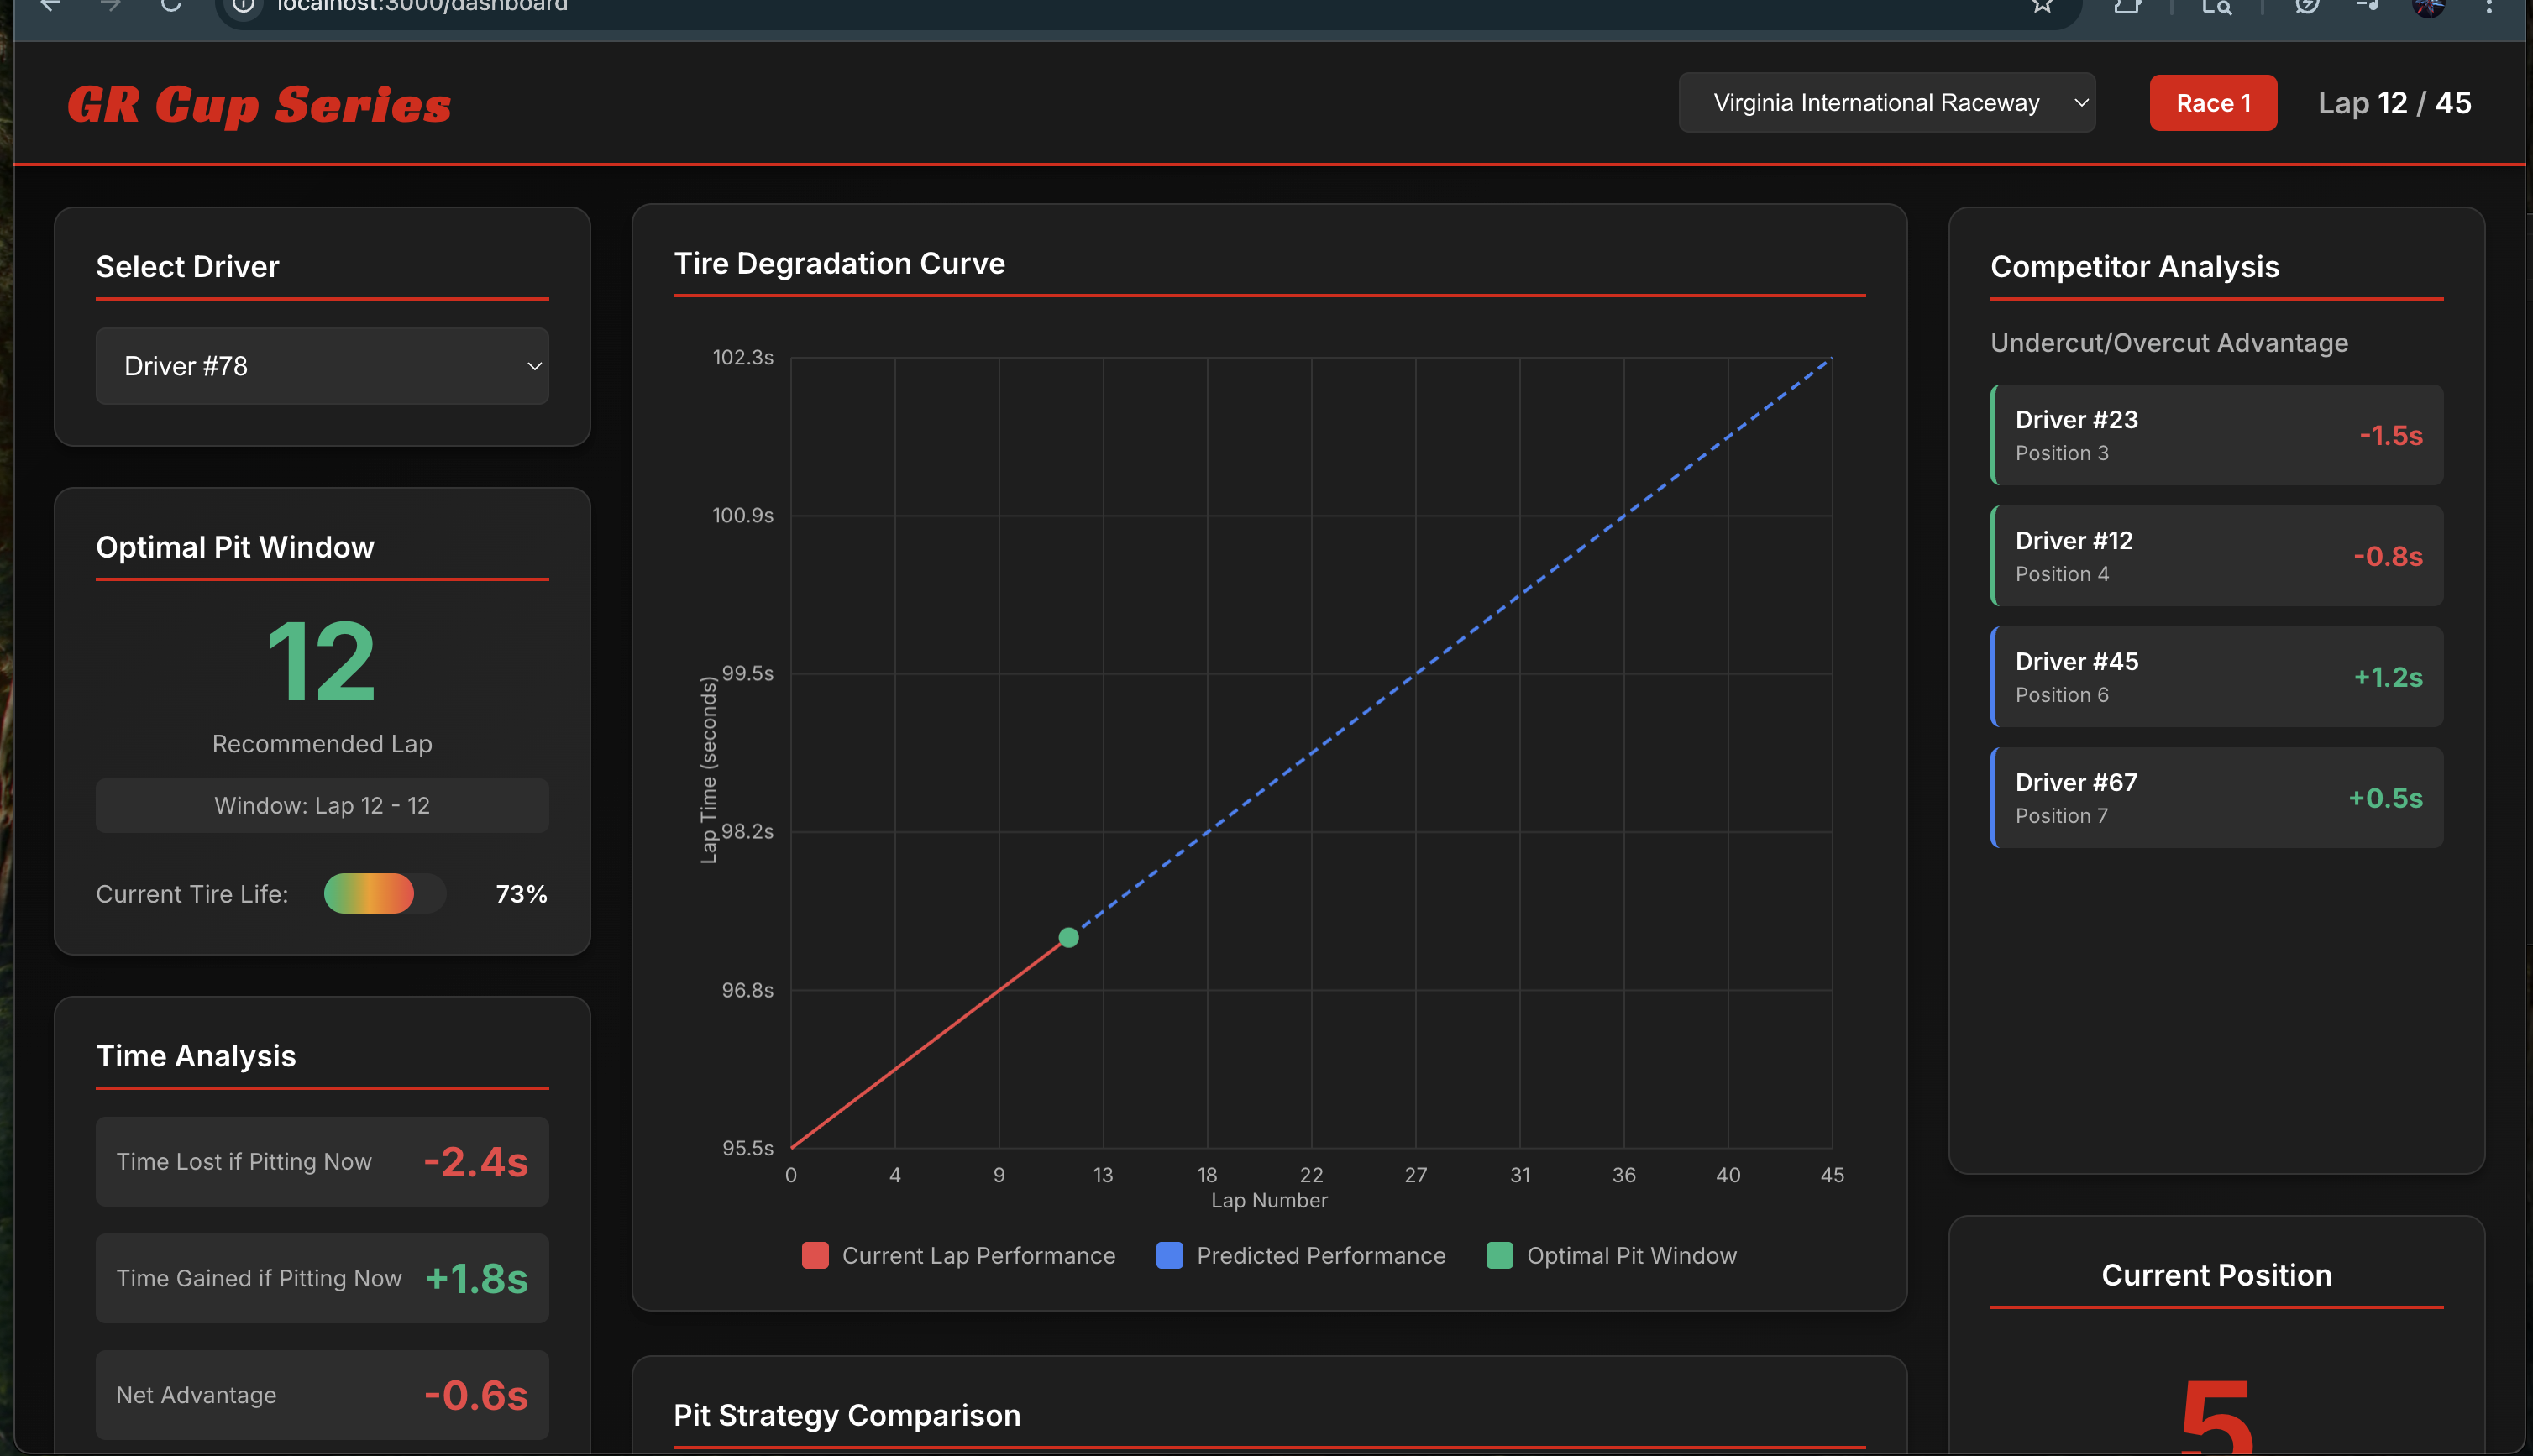
Track and Driver Selection + Tire Degradation Curve
-
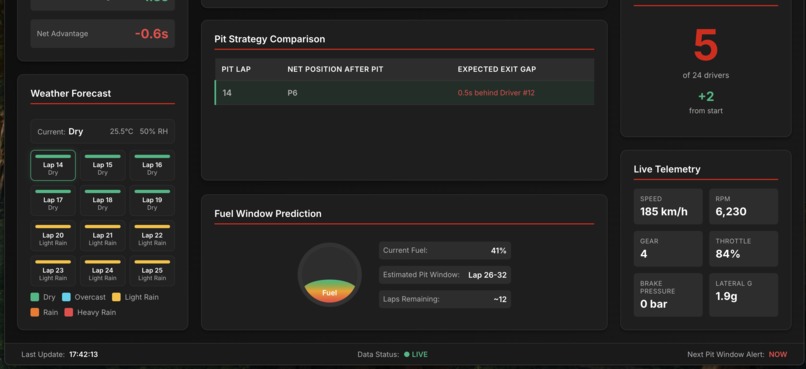
Weather + Real-Time Polling

Inspiration
Racing strategy is often the difference between winning and losing. In motorsports, a well-timed pit stop can gain multiple positions, while a poorly timed one can cost you the race. We were inspired by Formula 1's sophisticated strategy systems and wanted to bring similar data-driven decision-making capabilities to the GR Cup Series. The challenge of combining multiple data streams, tire degradation, fuel consumption, weather patterns, and competitor positions, into actionable pit stop recommendations excited us. We saw an opportunity to help teams make better strategic decisions through real-time analytics.
What it does
PitWindow Pro is a real-time race strategy analytics dashboard that helps teams optimize pit stop timing. The platform:
- Analyzes Tire Degradation: Calculates tire wear curves and identifies optimal pit windows based on performance degradation thresholds
- Predicts Fuel Consumption: Monitors fuel levels and forecasts when refueling will be necessary, accounting for throttle usage and speed
- Tracks Competitors: Analyzes competitor positions and calculates undercut/overcut advantages to help teams make strategic positioning decisions
- Considers Weather: Integrates weather forecasts to factor in changing track conditions that affect tire strategy
- Unified Recommendations: Combines all factors using a weighted scoring system (30% tire, 30% fuel, 25% weather, 15% timing) to recommend the optimal pit window
- Live Telemetry: Displays real-time vehicle data including speed, RPM, throttle, brake, and lateral G-forces
- Visual Analytics: Provides interactive charts showing tire degradation curves, fuel predictions, and pit strategy comparisons
The dashboard updates every 5 seconds with fresh data, giving race engineers the information they need to make split-second strategic decisions.
How we built it
We built PitWindow Pro as a full-stack application with a React frontend and Node.js/Express backend:
Frontend (React):
- Built a responsive dashboard layout with three columns (left: driver selection and pit recommendations, center: charts and strategy, right: competitors and telemetry)
- Implemented custom Canvas-based charting for tire degradation visualization with real-time updates
- Created modular React components for each feature (TireDegradationChart, FuelWindow, CompetitorAnalysis, etc.)
- Used React Hooks (useState, useEffect, useCallback, useRef) for state management and performance optimization
- Implemented a ref-based data storage system to handle large race data objects efficiently without performance issues
- Styled with CSS3 using a dark theme optimized for race control environments
Backend (Node.js/Express):
- Developed RESTful API endpoints for tire degradation, fuel prediction, telemetry, weather, and optimal pit window calculations
- Implemented mathematical models for:
- Tire Degradation: Calculates lap-by-lap performance degradation using configurable wear multipliers and degradation rates
- Fuel Consumption: Predicts fuel usage based on throttle percentage, speed, and lap-by-lap consumption rates
- Optimal Pit Window: Uses a weighted scoring algorithm that evaluates each potential pit lap across multiple factors
- Created mock data generators for testing and demonstration
- Implemented error handling, retry logic, and timeout management for robust API calls
- Used CORS middleware to enable frontend-backend communication
Key Algorithms:
- Tire degradation uses segment-based wear multipliers to simulate realistic tire wear patterns
- Fuel prediction accounts for throttle and speed variations to calculate consumption
- Optimal pit window scoring system evaluates laps from the current position to race end, finding the highest-scoring lap based on weighted factors
Challenges we ran into
Performance with Large Data Sets: Initially storing race data in React state caused performance issues. We solved this by moving large data objects to refs and using a version counter pattern to trigger re-renders only when needed.
Real-time Data Synchronization: Ensuring the dashboard stays in sync with backend updates while handling network failures gracefully. We implemented retry logic with exponential backoff and fallback to mock data.
Complex State Management: Managing dependencies between multiple useEffect hooks and preventing infinite re-render loops. We used useCallback to memoize functions and carefully managed dependency arrays.
Canvas Chart Rendering: Creating a responsive, high-quality chart using Canvas API that updates smoothly. We implemented ResizeObserver to detect container size changes and account for device pixel ratio for crisp rendering.
Weighted Scoring Algorithm: Balancing multiple factors (tire, fuel, weather, timing) to produce meaningful recommendations. We iterated on weight values and scoring functions to ensure realistic pit window suggestions.
API Integration: Coordinating multiple parallel API calls (tire, fuel, weather, telemetry) and merging the results into a unified race data object. We used Promise. all for parallel fetching and careful data merging logic.
Accomplishments that we're proud of
- Complete Full-Stack Implementation: Successfully built both frontend and backend from scratch, with seamless integration between React and Express
- Real-time Analytics: Created a dashboard that processes and displays complex race data in real-time with smooth updates
- Mathematical Models: Developed accurate tire degradation and fuel consumption prediction algorithms based on racing physics
- Unified Strategy System: Successfully combined multiple data sources (tires, fuel, weather, competitors) into a single, actionable recommendation
- Performance Optimization: Implemented efficient data storage patterns that handle large datasets without performance degradation
- User Experience: Built an intuitive, visually appealing dashboard optimized for race control environments with a professional dark theme
- Robust Error Handling: Implemented comprehensive error handling, retry logic, and graceful degradation when backend services are unavailable
- Responsive Design: Created a dashboard that works well on different screen sizes while maintaining readability and functionality
What we learned
- React Performance Patterns: Learned how to optimize React applications using refs, useCallback, and careful dependency management to prevent unnecessary re-renders
- Canvas API: Gained experience with HTML5 Canvas for custom chart rendering, including handling device pixel ratios and responsive sizing
- RESTful API Design: Learned best practices for designing APIs that are easy to consume, with clear error handling and consistent response formats
- Mathematical Modeling: Developed skills in creating algorithms that simulate real-world physics (tire wear, fuel consumption) with configurable parameters
- Weighted Decision Systems: Learned how to combine multiple factors with different importance weights to make unified recommendations
- Full-Stack Integration: Gained experience coordinating frontend and backend development, ensuring data flows correctly between systems
- Real-time Data Handling: Learned techniques for managing frequently updating data streams while maintaining application performance
What's next for PitWindow
- Machine Learning Integration: Implement actual AI/ML models trained on historical race data to improve prediction accuracy
- Historical Analysis: Add ability to review past races and analyze strategy effectiveness
- Multi-Driver Comparison: Allow comparing strategies across multiple drivers simultaneously
- Advanced Weather Integration: Incorporate more detailed weather data and track condition sensors
- Mobile App: Create a mobile version for race engineers to access data trackside
- Data Export: Add ability to export race data and strategy recommendations for post-race analysis
- Simulation Mode: Allow teams to simulate different pit strategies before the race to plan ahead
- Integration with Live Telemetry: Connect to actual GR Cup Series telemetry feeds for real-time data during races
- Collaborative Features: Enable multiple team members to view and annotate strategy decisions
- Predictive Analytics: Use historical data to predict competitor behavior and optimal response strategies
Built With
- css3
- express.js
- html5-canvas-api
- javascript
- mathematical-modeling
- node.js
- react
- restful-apis
- scoring
- weighted

Log in or sign up for Devpost to join the conversation.