-
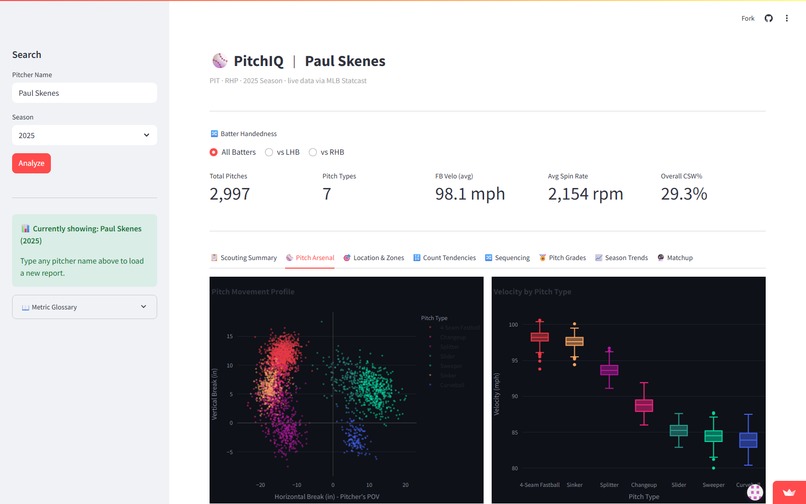
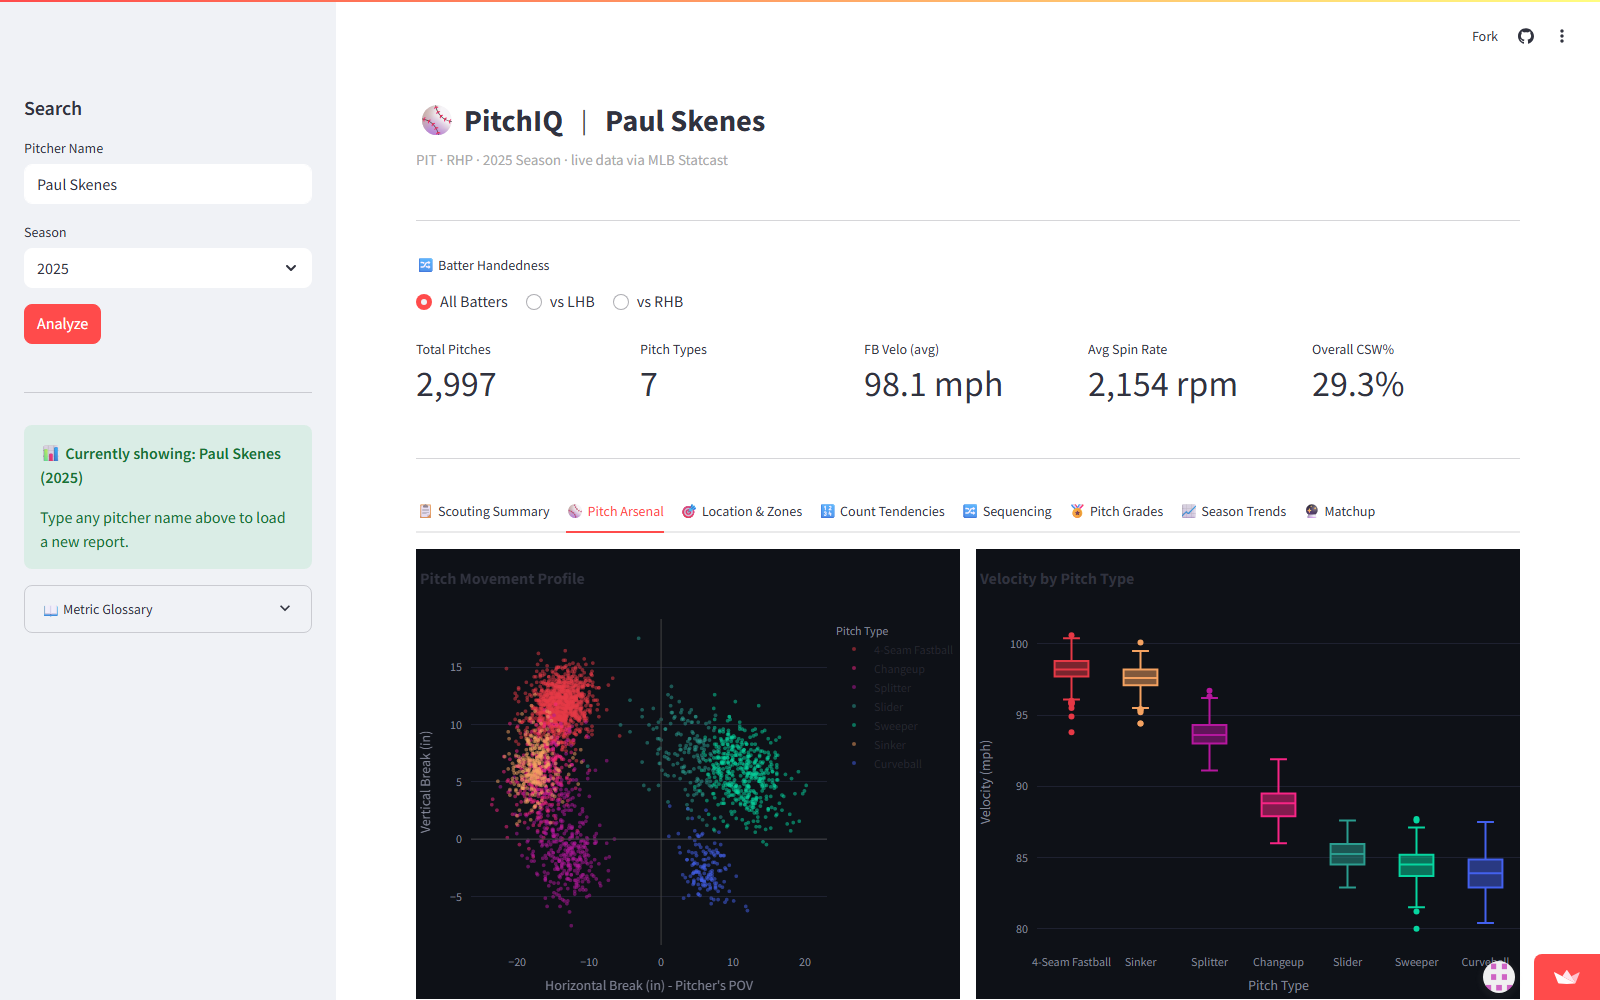
pitch arsenal
-
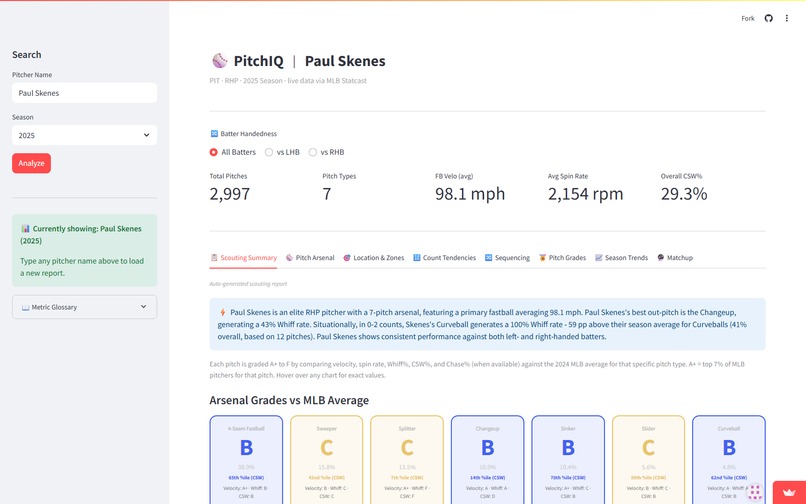
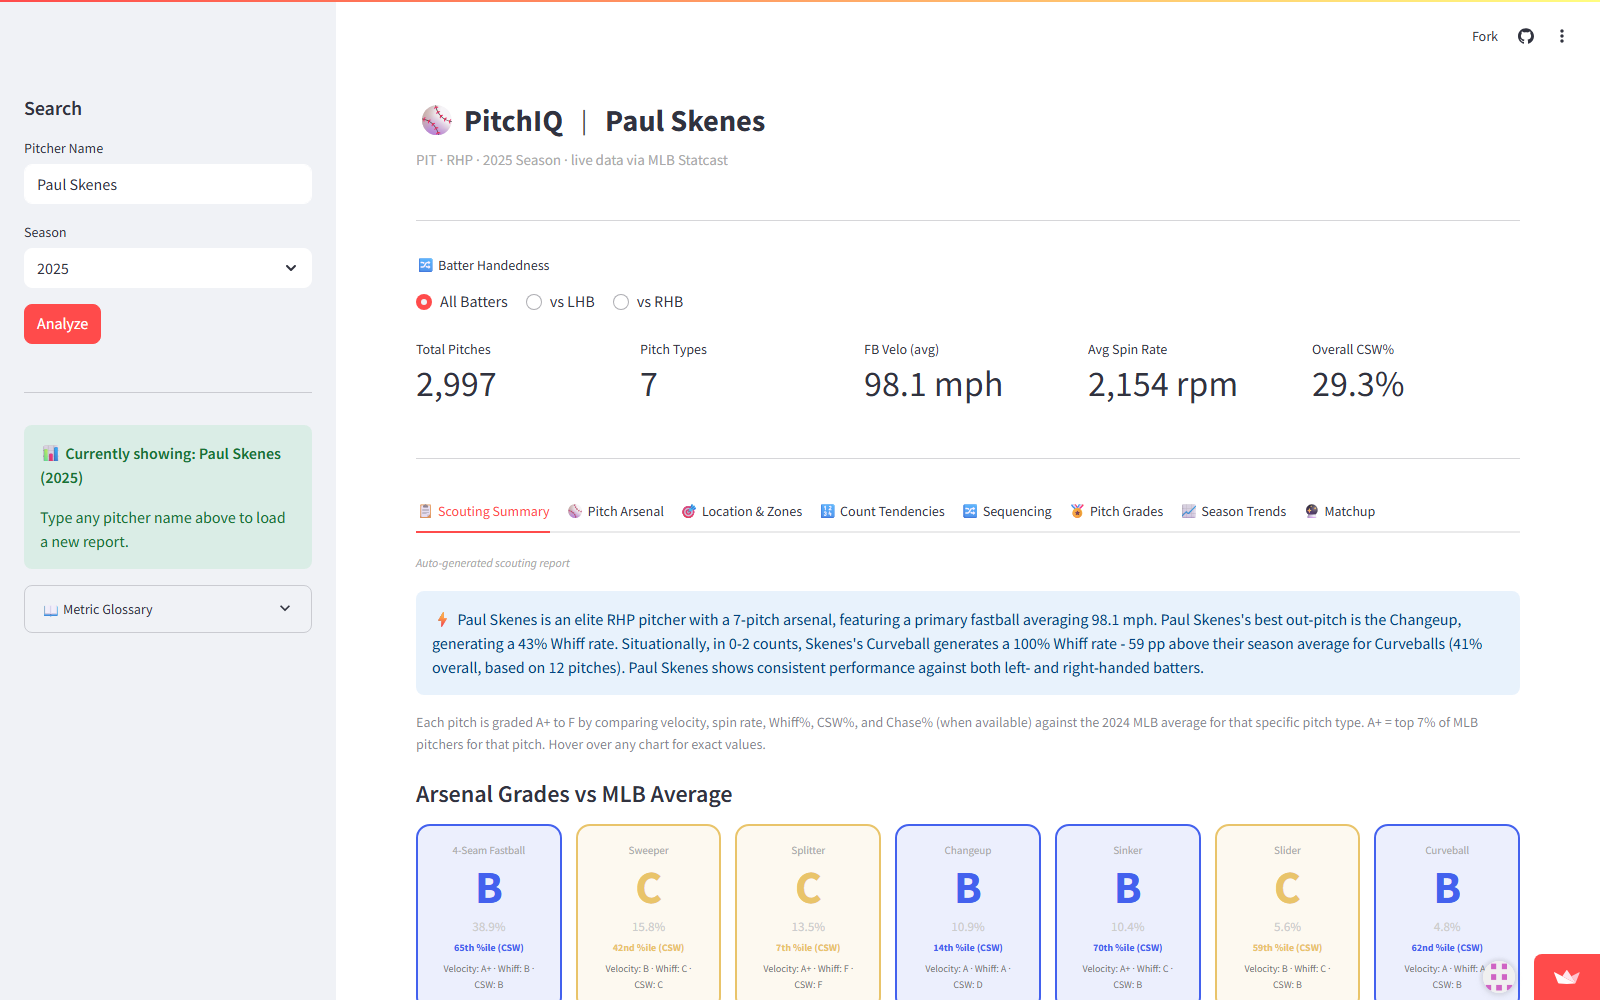
scouting summary
-
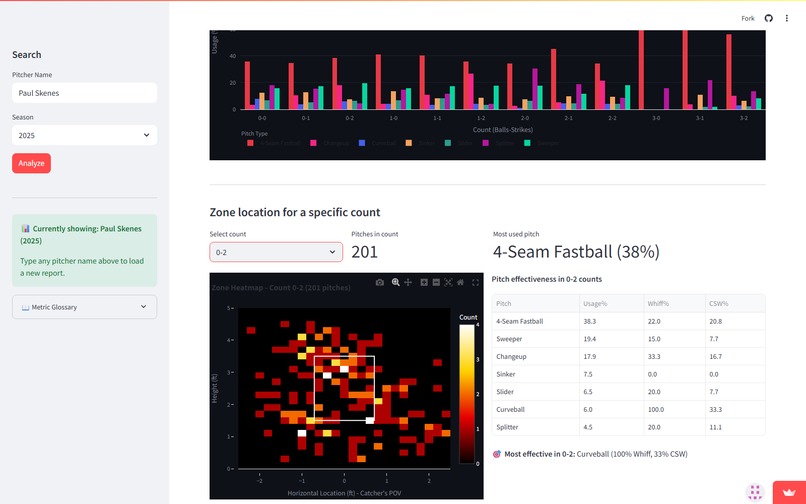
count tendencies
-
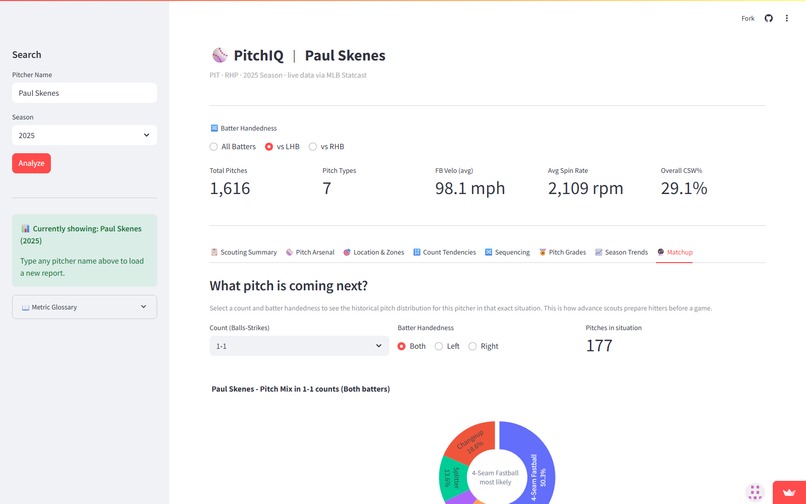
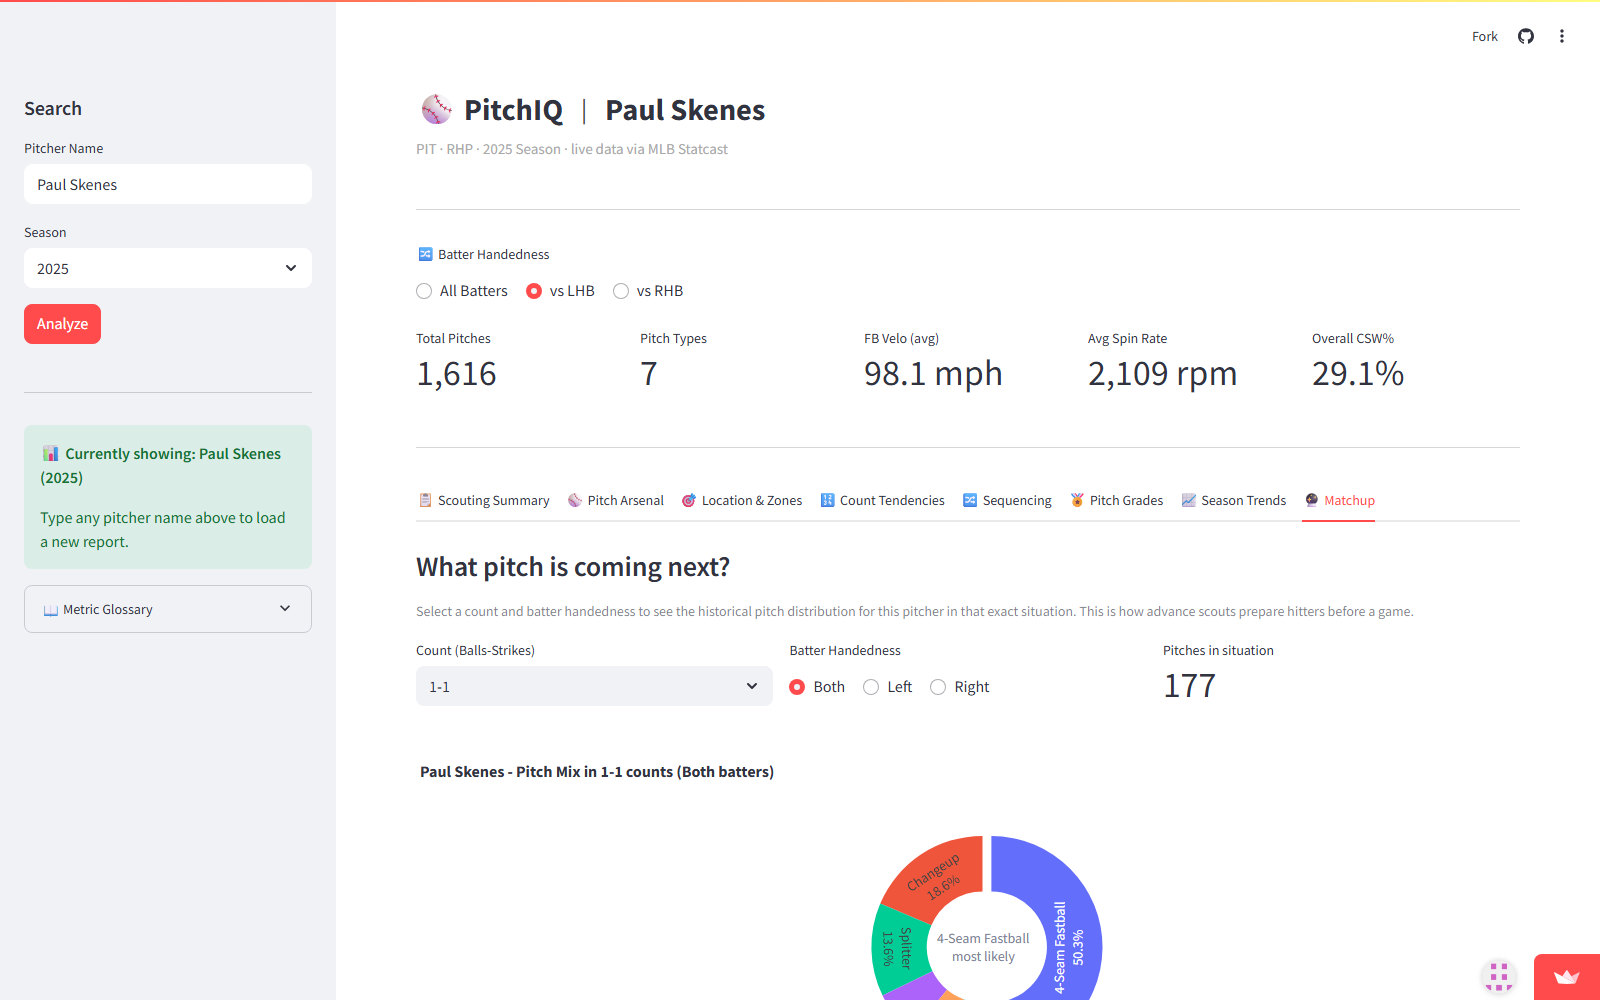
matchup
-
location zones
-
sequencing
-
pitch grades
-
seasontrends
Inspiration
Major League Baseball teams spend hundreds of thousands of dollars on pitch-tracking hardware, Rapsodo, Trackman, and Hawkeye systems that turn every thrown pitch into a data point. That data gives pitching coaches, analysts, and players a complete picture of how a pitcher's arsenal actually works: not just velocity, but movement profiles, effectiveness by batter handedness, pitch selection tendencies by count, and year-over-year decay signals.
The problem is that this intelligence is locked inside proprietary platforms with six-figure licensing costs. A Division I pitching coach, a minor league organization on a budget, a high school pitcher trying to understand their own mechanics, none of them can access this level of analysis.
But the raw data is public. Baseball Savant publishes full Statcast pitch-level data for every MLB pitcher, every pitch, every season. The gap isn't the data. It's that no one had built a free, open, interactive tool that turns that raw data into the same kind of scouting intelligence that pro teams pay for.
PitchIQ fills that gap.
What it does
PitchIQ pulls real Statcast pitch-by-pitch data for any MLB pitcher and turns it into a complete scouting report computed live from raw data, not pre-built static charts.
The dashboard includes 8 analytical tabs:
- Scouting Summary - Auto-generated narrative, letter grades (A+-F vs 2024 MLB baselines), Scouting Recommendation card, contact quality (xwOBA), effectiveness charts, dual CSV export
- Pitch Arsenal - Movement scatter, velocity distribution, release point consistency
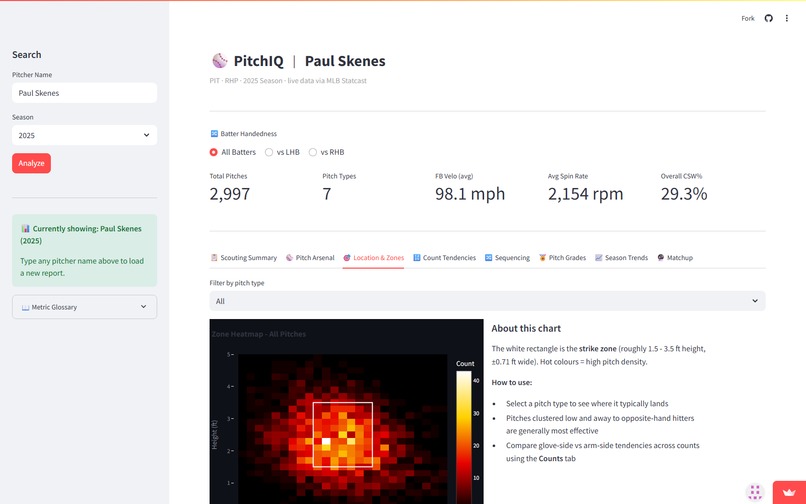
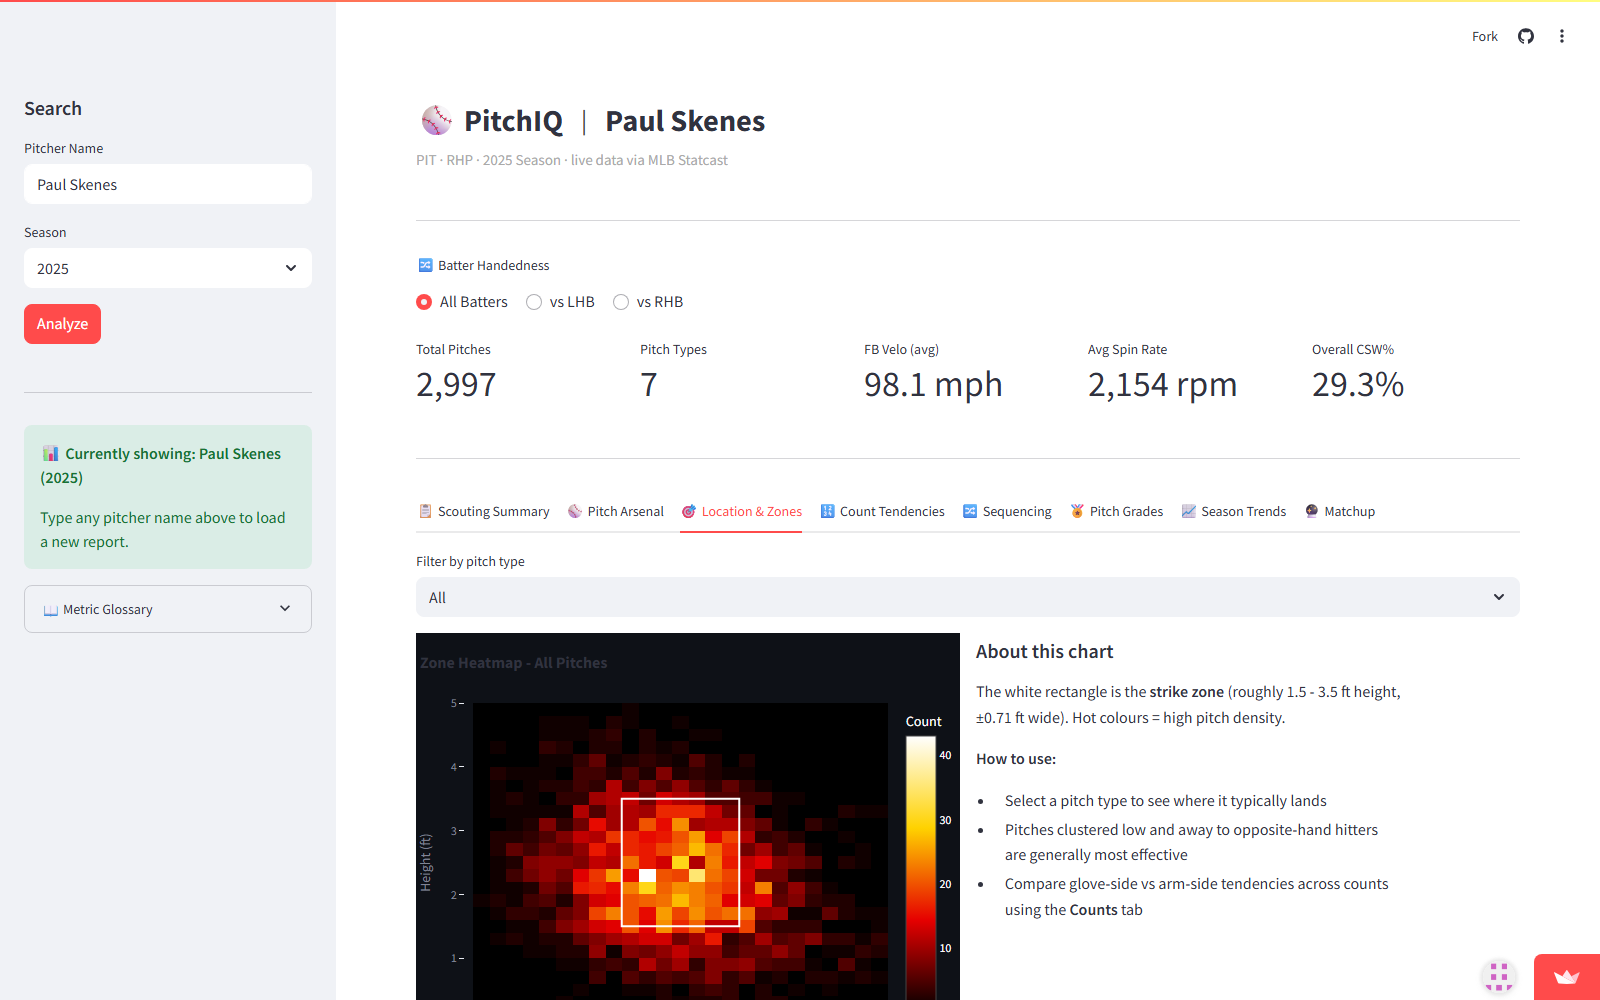
- Location and Zones - Catcher-view heatmap by pitch type, movement and velocity charts
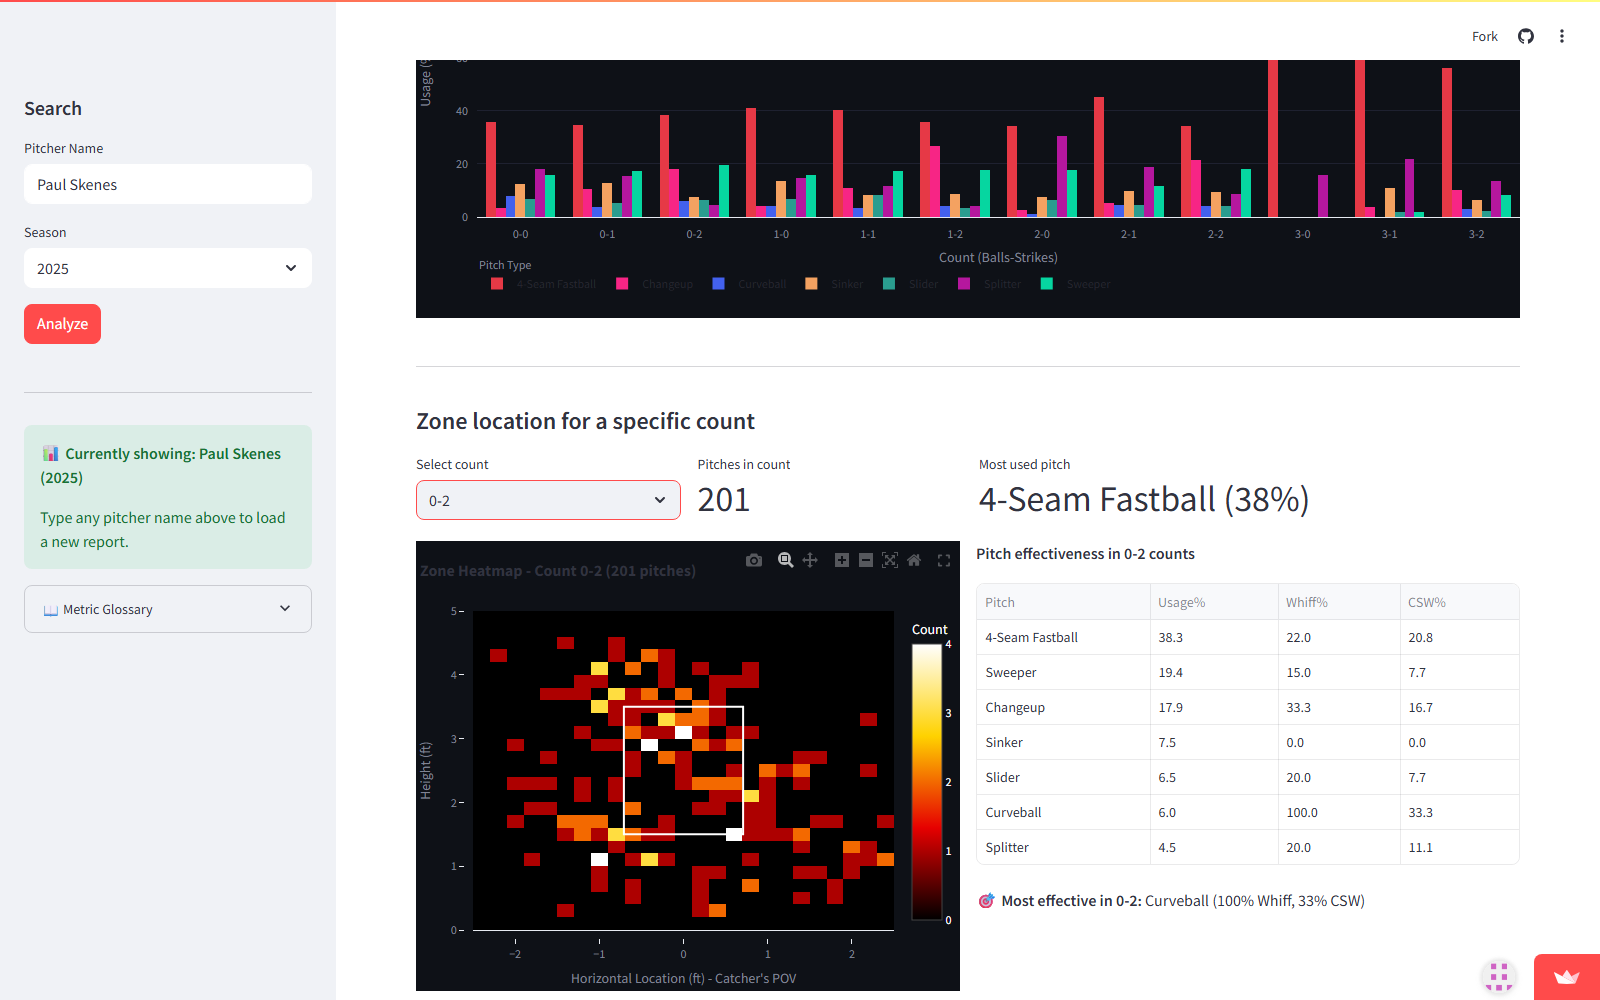
- Count Tendencies - First-pitch strategy, pitch mix by count, zone location for any specific count, outlier detection
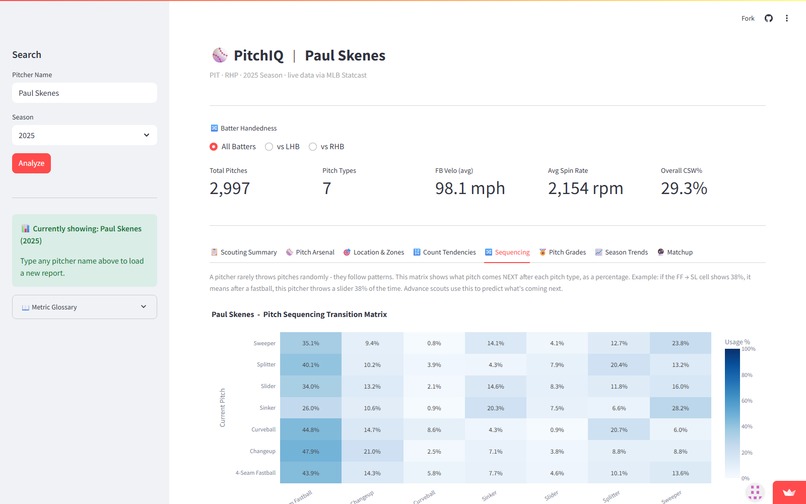
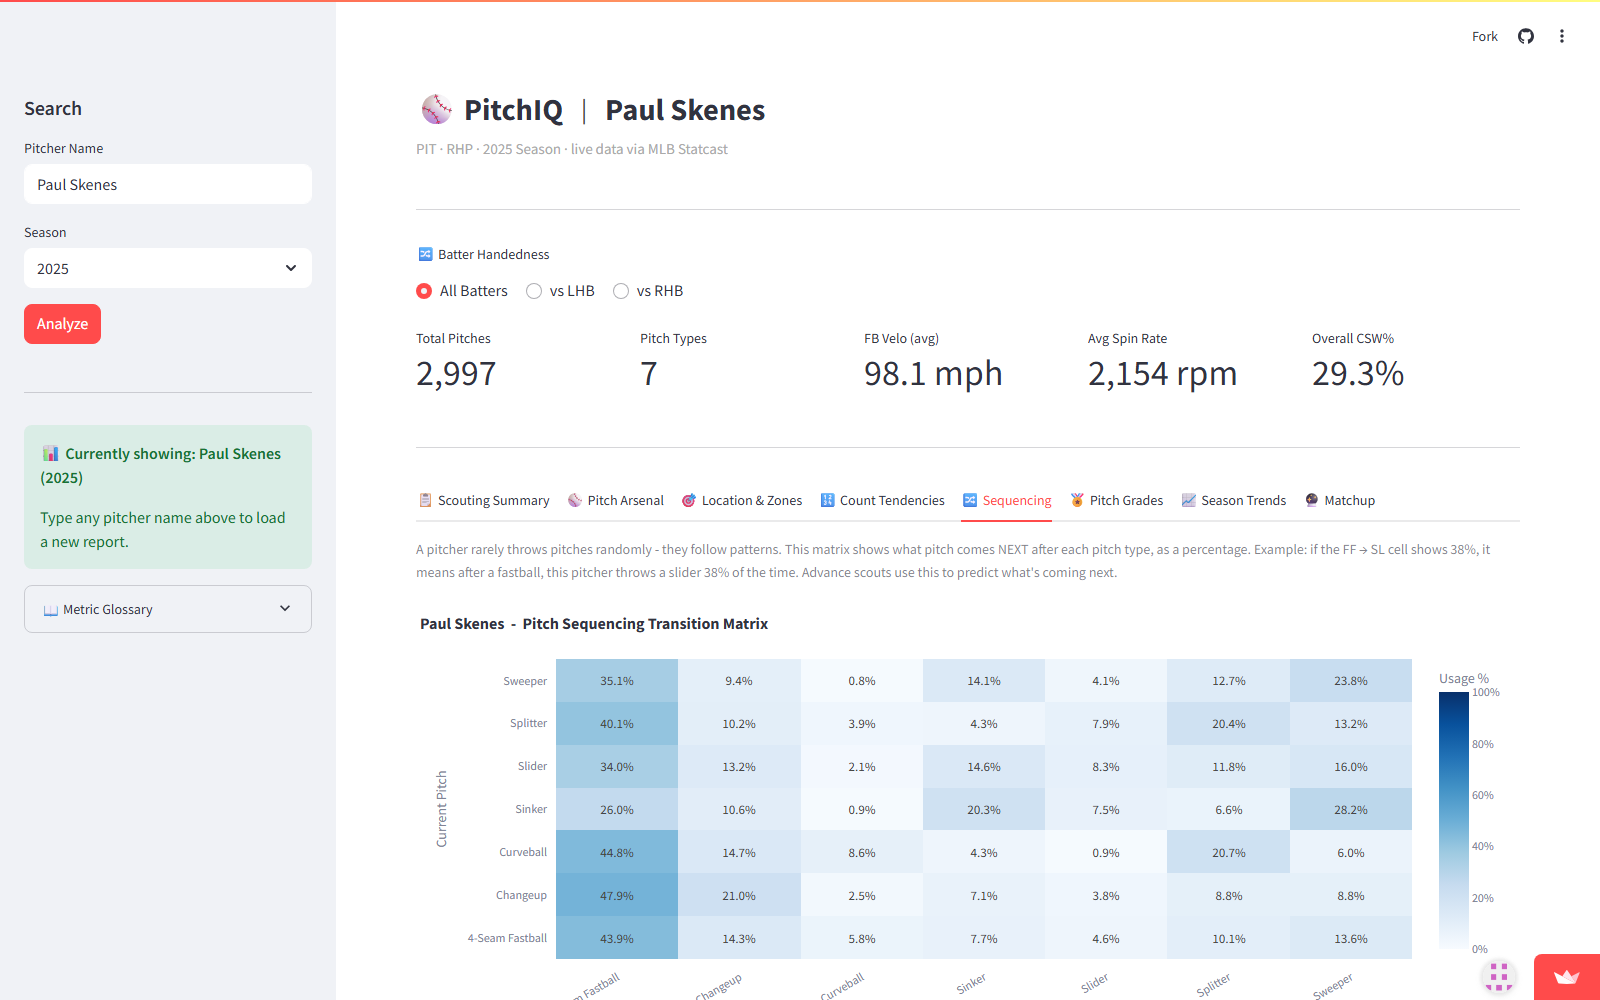
- Sequencing - Full pitch-to-pitch transition matrix, most predictable sequence insight
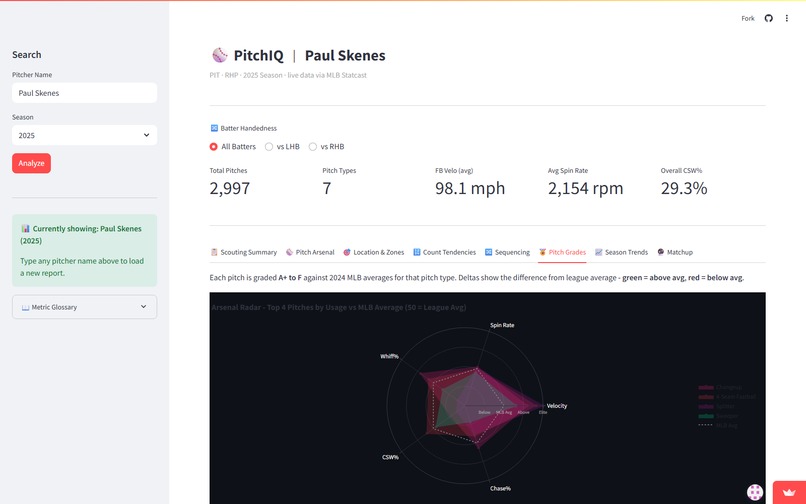
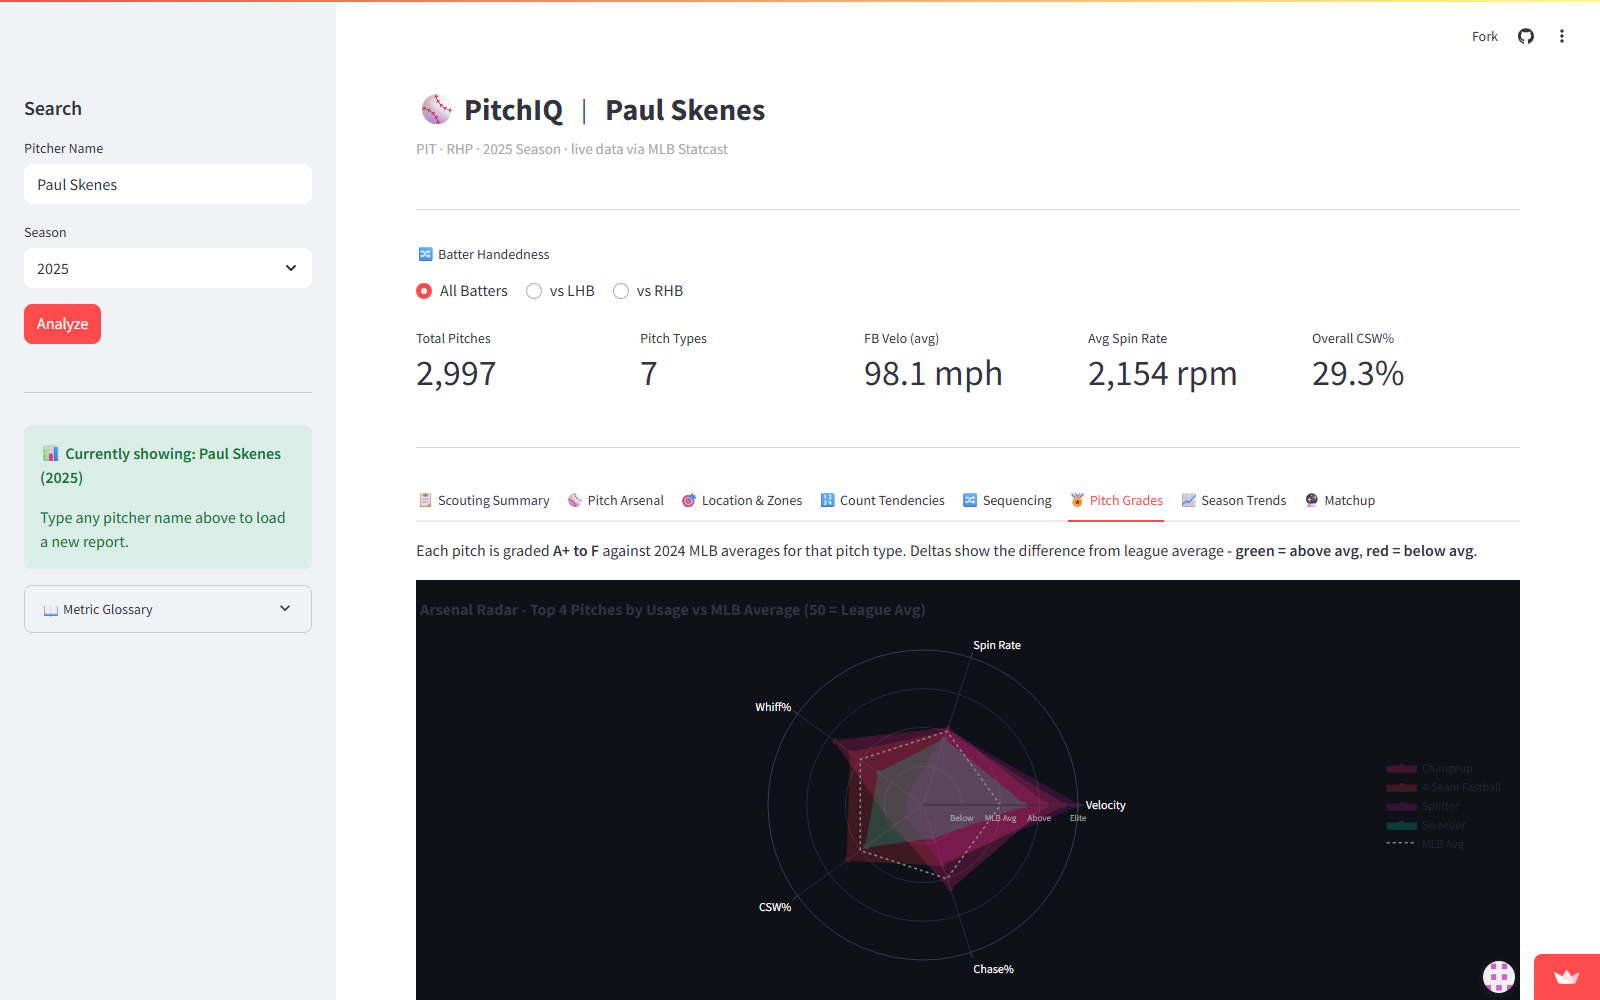
- Pitch Grades - Radar chart vs MLB average, physical + effectiveness grade breakdown
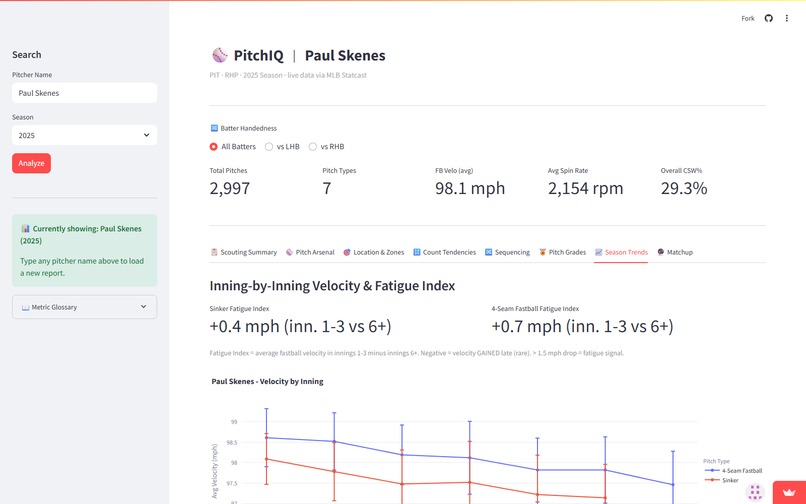
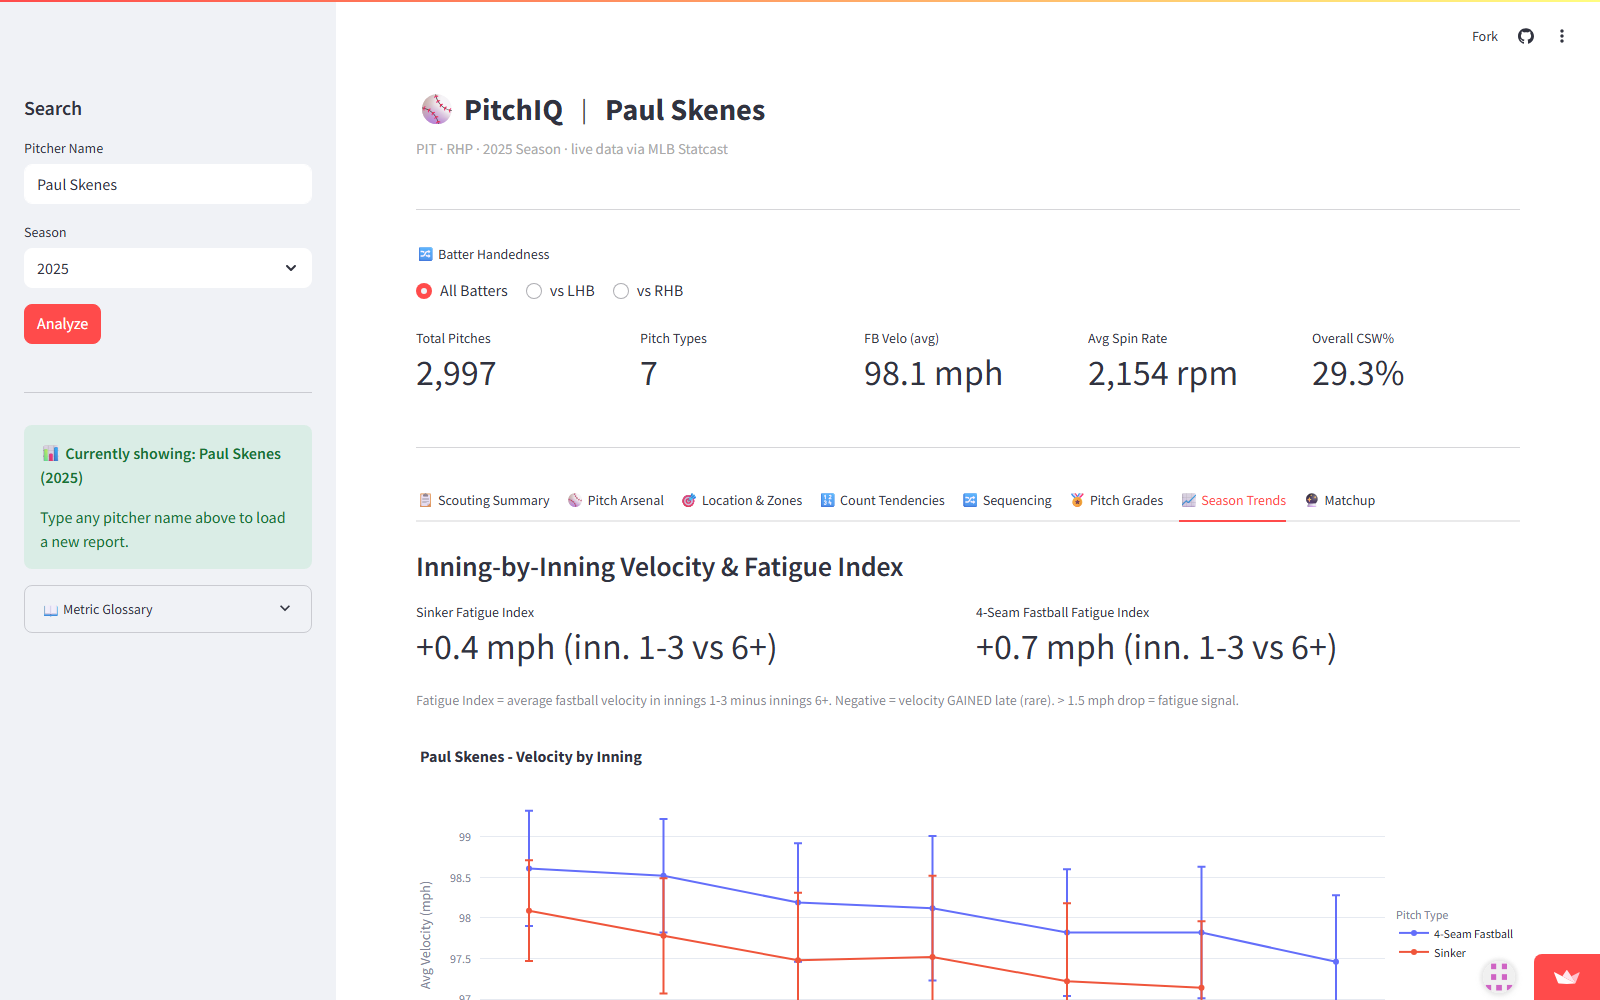
- Season Trends - Inning-by-inning velocity and fatigue index, multi-season game-by-game velocity
- Matchup - Count + batter-hand situational pitch mix, Whiff%/CSW% per pitch type
Cross-cutting features:
- Platoon split toggle (vs LHB / vs RHB / All Batters) - every chart and metric updates live
- Auto Scouting Recommendation card with platoon usage insight
- Contact quality metrics (xwOBA, GB/LD/FB by pitch type)
- Dual CSV export (Pitch Summary + Full Report for staff distribution)
- 7 demo pitchers pre-cached for instant load (2,000-5,000 pitches each)
Demo season note: Shohei Ohtani and Sandy Alcantara did not pitch in 2024 (injury). Use 2025 for instant load on those two.
Deployed on Streamlit Community Cloud for zero-infrastructure hosting.
Data source: Baseball Savant / Statcast public pitch-level data via pybaseball (no API keys required).
How we built it
Python 3.11 and Streamlit for the application framework. Streamlit lets us build a fully interactive multi-tab dashboard without writing a single line of JavaScript. Every widget, toggle, and dropdown is Python, which means the analytics logic and the UI live in the same codebase and stay in sync.
Data ingestion is handled by pybaseball, a Python wrapper for Baseball Savant's Statcast API. Each pitcher search fetches the full pitch-level dataset for the requested season, typically 2,000–5,000 rows with 90+ columns including velocity, spin rate, horizontal and vertical break, release point, pitch type, batter handedness, count, and pitch result. We cache frequently-searched pitchers locally to avoid repeat API calls.
All visualizations use Plotly for interactivity. Charts are not screenshots. Every point is hoverable, every chart is zoomable.
Pandas handles all the data processing: groupby aggregations for effectiveness metrics, whiff rate calculations (swinging strikes / total swings), CSW computation, grade assignment via z-score comparison against stored MLB average benchmarks, and platoon filtering. Numpy handles the radar chart normalization (mapping each metric to a 0–100 scale where 50 = league average).
To make the analytical value concrete, here's what PitchIQ surfaces for Paul Skenes in 2025 that no free tool shows in a single view:
| Count | Pitch | Whiff% | Δ vs Season Avg |
|---|---|---|---|
| 0-2 | Curveball | 100% | +71 pp |
| 2-1 | Sweeper | 100% | +68 pp |
| 1-2 | Changeup | 60% | +19 pp |
These are not pre-computed. Every row is derived live from raw pitch logs the moment you load the dashboard.
We ingest pitch-level Statcast data from Baseball Savant via pybaseball, compute z-score grades against 2024 MLB pitch-type baselines, and render interactive Plotly charts in a Streamlit dashboard hosted on Streamlit Community Cloud.
Challenges we ran into
Cold-start latency. Live Statcast API calls through pybaseball take 15–30 seconds on a cold start. For a judged demo, that's a death sentence. We solved it by bundling a pre-fetched Statcast dataset for Paul Skenes (2025 and 2024 seasons) as gzipped CSV files that load in under 200 milliseconds. The demo opens instantly. Searching any other pitcher triggers the live API path.
Incomplete pitch type coverage. Some pitchers throw pitch types not present in the standard Statcast taxonomy, or have seasons with fewer than 30 samples of a particular pitch. Grade calculations silently fail for those pitches. We added per-pitch coverage guards that skip grading for any pitch type with insufficient data rather than showing misleading numbers.
Normalizing MLB benchmarks across pitch types. A 27% whiff rate is outstanding for a four-seam fastball but below average for a curveball. Grading requires separate baseline averages for each pitch type, not a universal standard. We built a pitch-type-specific benchmark table from 2024 Statcast season aggregates and anchor every grade calculation to the correct baseline.
Making the platoon filter update everything simultaneously. The filter needs to re-run every downstream computation, effectiveness metrics, grade calculations, zone heatmaps, count analysis, without re-fetching data. Streamlit's execution model re-runs the entire script on any widget change, so we had to structure the code so the filter assignment happens before any downstream computation rather than partway through.
Accomplishments we're proud of
The numbers that matter most:
- Cold start reduced from ~90s to <200ms for demo pitchers, judges see data instantly, not a spinner
- 12 count situations analyzed per pitcher, each with its own zone heatmap and per-pitch effectiveness table computed live from raw logs
- Grading calibrated across 9 pitch types with pitch-type-specific sigma: a 45% Whiff% sweeper and a 45% Whiff% curveball grade correctly as different achievements because they are
- 4 metrics recomputed per platoon split (Whiff%, CSW%, Chase%, letter grades), not filtered from a cache, rerun from scratch against the filtered dataset
- 1 auto-generated scout-level insight per load: the single most exploitable count/pitch combination surfaced without the user needing to find it manually
What we learned
Statcast data reveals things that box scores completely hide. A pitcher who throws 94 mph with a 12% walk rate looks ordinary in the box score. Pull the Statcast data and you might find that their four-seam fastball has elite vertical break, their curveball generates a 42% whiff rate on the first strike, and they go to their changeup almost exclusively against left-handed hitters in two-strike counts. None of that exists anywhere in traditional stats.
The most surprising finding was how dramatically pitch effectiveness changes by count. A fastball thrown in a 0-2 count is not the same pitch as a fastball thrown in a 3-0 count, different velocity, different location, different purpose, different result. The same pitcher can look completely different depending on whether you look at their overall numbers or their numbers in specific game situations. That situational variation is where the real scouting intelligence lives.
What's next for PitchIQ
Batter vulnerability reports. The same analytical framework runs in reverse, instead of "what does this pitcher do," the question becomes "what does this hitter struggle with." Whiff rates on high fastballs, chase rates on breaking balls in the dirt, CSW% against pitchers with high spin rates. The data infrastructure is already built; it's an orientation change, not a rebuild.
Intra-season velocity trend flags. A pitcher who loses 1.5 mph on their fastball between April and August is an injury or fatigue signal that MLB teams pay analysts specifically to track. The Statcast data has game dates; the pipeline is already date-aware. This feature is one aggregation step away from shipping.
Minor league pitcher profiles. MiLB Statcast coverage reached full stadium deployment in 2024, the first season with complete pitch-tracking data across all affiliated leagues. That's a narrow window to build the first free scouting tool for AAA prospects before someone charges for it. The same pipeline that grades Paul Skenes runs unchanged on a Double-A arm. For a team with limited scouting staff, that's a real competitive edge at zero marginal cost.


Log in or sign up for Devpost to join the conversation.