PitchPulse — Devpost Story (paste into the project description)
Inspiration
Cricket commentary is full of words like "clutch" and "big-match player," but nobody ever proves them with numbers. Basketball has win probability models on every broadcast; T20 cricket — a sport where one over can flip a match — mostly still argues about averages and strike rates. Averages treat a six in a dead rubber the same as a six when your team needs 12 off 6 in a World Cup final. I wanted to measure the difference. I also grew up on stories of the 2007 T20 World Cup final, and I wanted to know: can a model actually see Misbah's scoop coming off the data?
What it does
PitchPulse computes a calibrated ball-by-ball win probability for every men's T20 international ever recorded, then uses it to answer one question: who actually performs when the match is on the line?
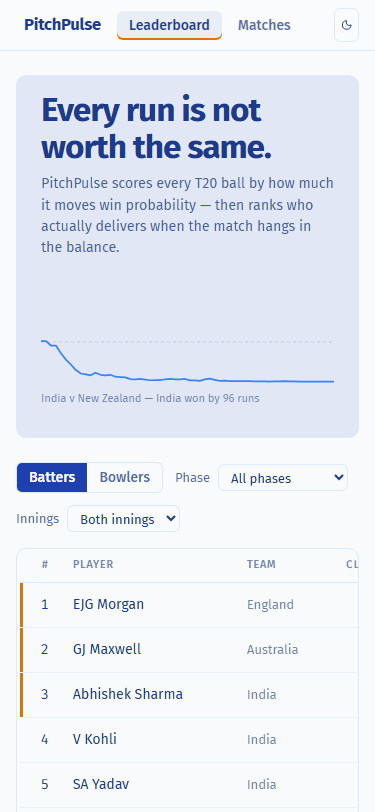
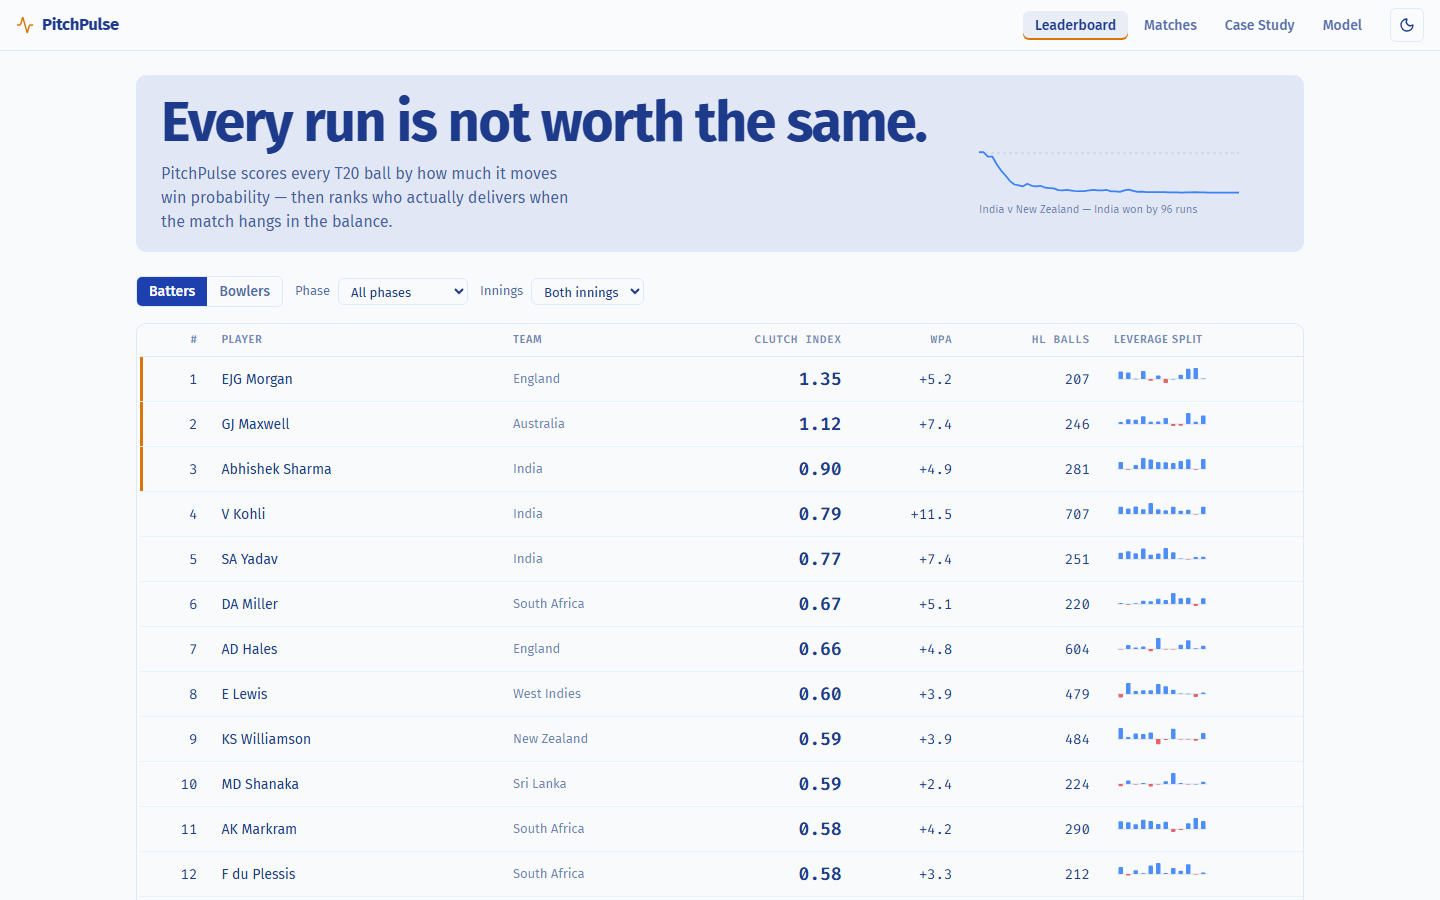
- The Clutch Index — the headline metric. For every ball, the model knows how much the match hangs on it (leverage). The Clutch Index is a player's win-probability-added on only the top-quartile-leverage balls, per 100 balls, minimum 200 high-leverage balls faced/bowled. It's "who shows up in the big moments," as a number.
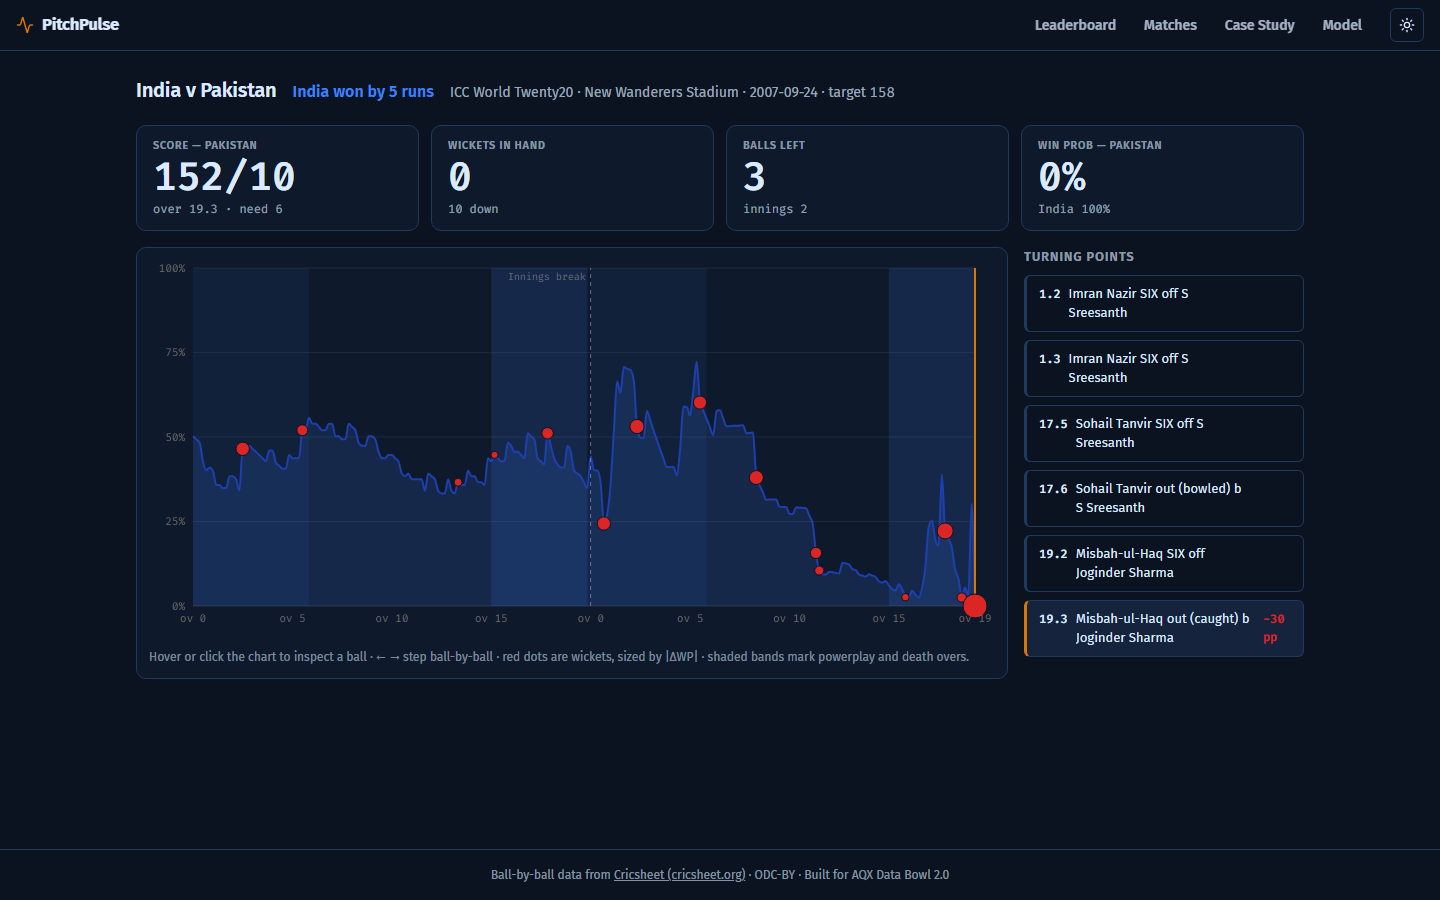
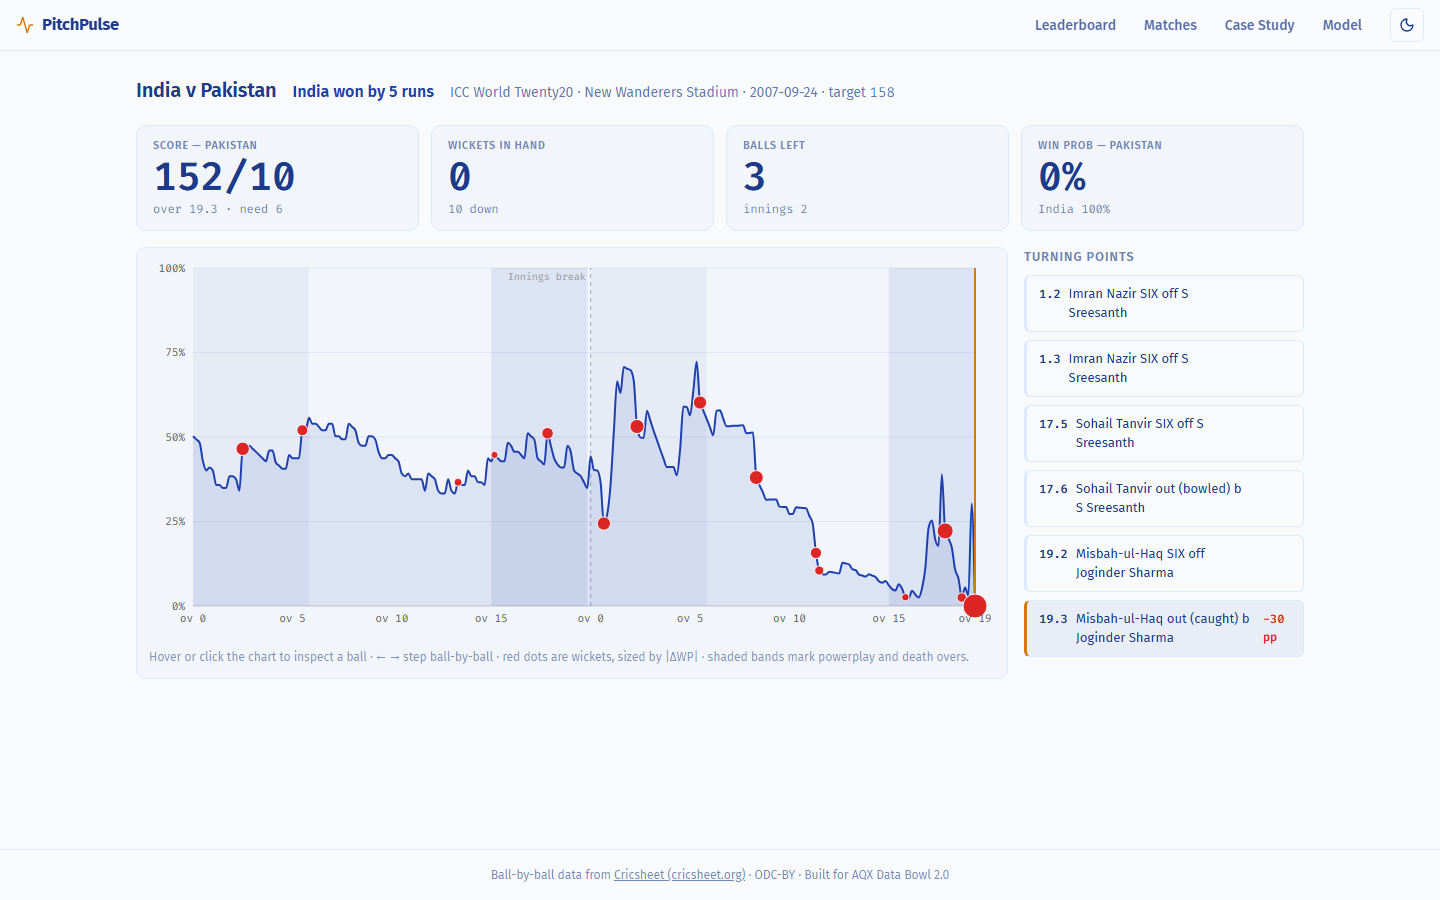
- Match Theater — an interactive win-probability chart for curated classic matches (the 2007 and 2026 World Cup finals, super-over ties, one-run thrillers). Scrub ball-by-ball with your keyboard and watch the match swing.
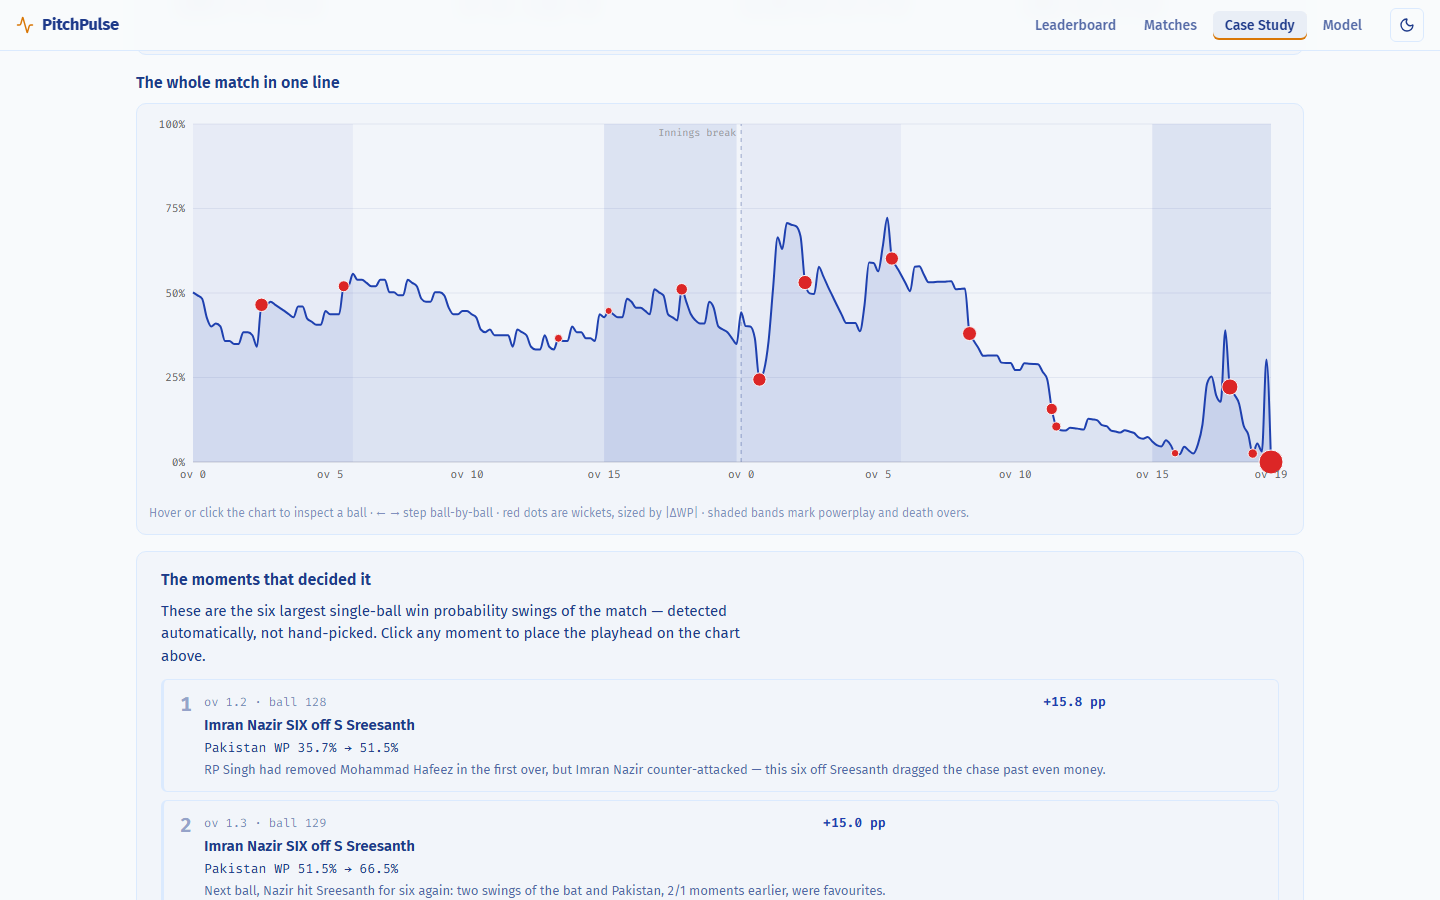
- Case study — the 2007 India–Pakistan final, annotated turning point by turning point. The model shows the championship swinging +27 points on Misbah's six, then −30 points on his dismissal the very next ball.
- Model card — every limitation of the model, stated honestly, with a calibration plot.
The leaderboard passes the eye test: Eoin Morgan, Glenn Maxwell, Virat Kohli, Suryakumar Yadav and David Miller top the batters; Dale Steyn, Jasprit Bumrah, Saeed Ajmal and Sunil Narine top the bowlers. Coaches could use this for death-overs matchups, fantasy players for captain picks, and analysts for settling the "clutch" debate with evidence.
How I built it
- Data: 5,524 raw ball-by-ball match files from Cricsheet (ODC-BY licensed) → filtered to 3,363 completed men's T20Is → 768,884 deliveries parsed with zero errors.
- Model: a logistic regression over match state — runs needed, balls remaining, wickets in hand, required run rate, and the gap between required and current rate. Deliberately simple: it trains in seconds, it's fully interpretable, and its coefficients export to JSON so the entire app runs statically with no backend. First-innings WP comes from a par-score table mapped through the chase model.
- Validation: time-ordered split (train on the past, test on the most recent 504 matches — no data leakage from the future). Log-loss 0.312 vs 0.693 for a coin-flip baseline; calibration within ±5.2 points across all probability deciles; the final-ball prediction agreed with the actual winner in 20/20 held-out matches.
- App: Vite + React + TypeScript + Recharts, fully static — the pipeline precomputes everything into small JSON files (each match under 31 KB), so the deployed site has zero server dependencies and an 80 KB gzipped main bundle.
Challenges I ran into
- The model lied at the start of the chase. With zero balls bowled, current run rate is 0, which made the "rate gap" feature explode and biased the opening win probability to 29% when it should be ~50%. A six on ball 2 could swing WP by +52 points. I fixed both by shrinking early-innings run rate toward the required rate with an 18-ball prior — log-loss improved both times.
- The leaderboard was topped by players from Spain and Eswatini. The model is team-blind, so dominating weak opposition inflates clutch scores. I restricted the leaderboard pool to full-member internationals and documented the choice.
- My showcase match was boring. I planned the 2026 World Cup final as the case study — then the model showed me it was a 96-run strangulation whose biggest single-ball swing was 5.5 points. Blowouts have no turning points. So I switched the case study to the 2007 final, and turned the contrast itself into a finding.
Accomplishments that I'm proud of
- A genuinely calibrated model — when it says 70%, the chasing team wins about 70% of the time (max decile gap 5.2 points), verified on held-out matches it never trained on.
- A novel, defensible metric that captures something averages can't, computed over every T20I ever recorded.
- The whole thing reproduces from public data with four Python scripts and
npm run dev— fully open source, MIT licensed. - Honest reporting: the model card lists what the model can't do, right next to what it can.
What I learned
- Validate against domain common sense before trusting a novel metric. The Spain/Eswatini leaderboard was mathematically correct and completely wrong.
- Calibration matters more than accuracy for a probability model — a WP chart is only trustworthy if 70% means 70%.
- The data will overrule your narrative plans — my chosen showcase match turned out to be the least dramatic file in the dataset, and the honest response made the project better.
- MS Dhoni ranks low on my T20I-only leaderboard because his finishing legend was built in the IPL — a lesson in how dataset boundaries shape conclusions, and in saying so out loud.
What's next for Pitch Pulse
- What-if mode: the model coefficients already ship to the browser, so an interactive chase calculator ("what does WP become if this ball is a six?") is a small step away.
- IPL and women's T20 data — both are in Cricsheet; adding them mainly means re-running the pipeline (and would give Dhoni his fair trial).
- Venue and team-strength priors to sharpen the model beyond pure match state.
- Live mode: pointing the same engine at a live scorecard feed to produce real-time WP and leverage during matches.
Built with: python · pandas · scikit-learn · react · typescript · vite · recharts · cricsheet
Built With
- javascript
- pyrhon
- reacjs
