What it does
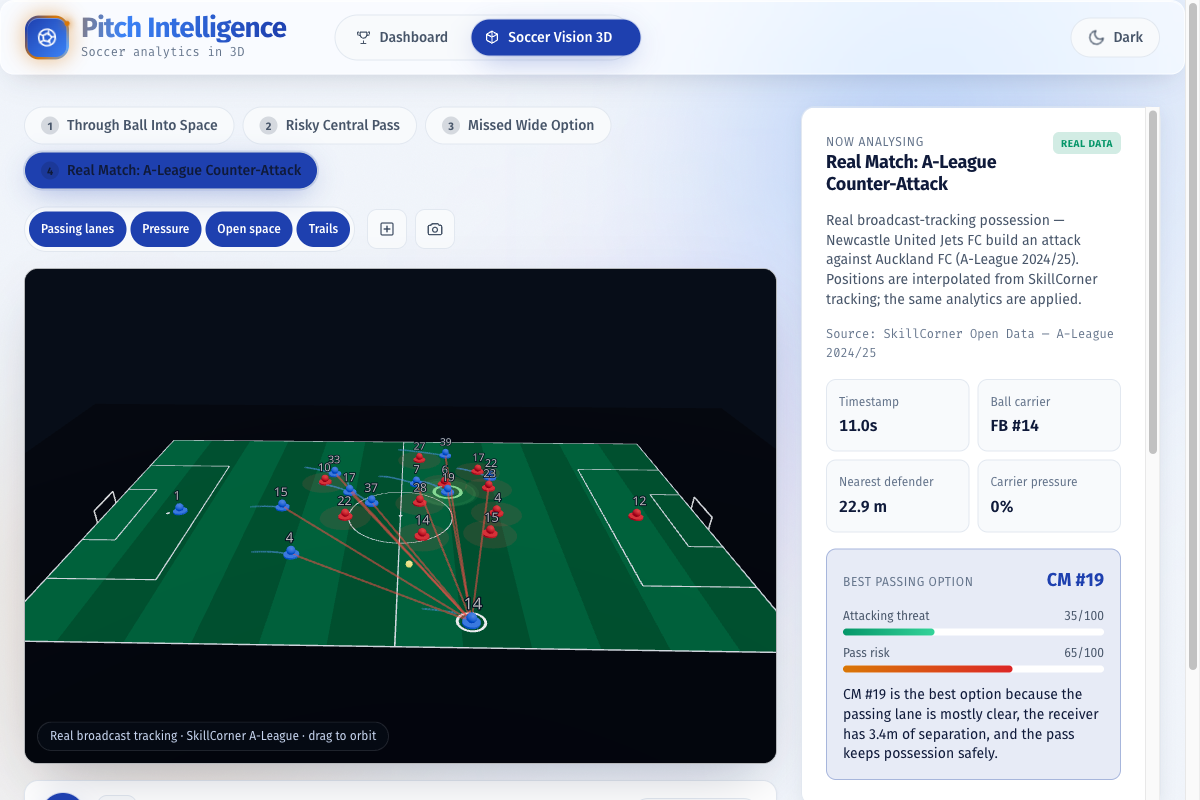
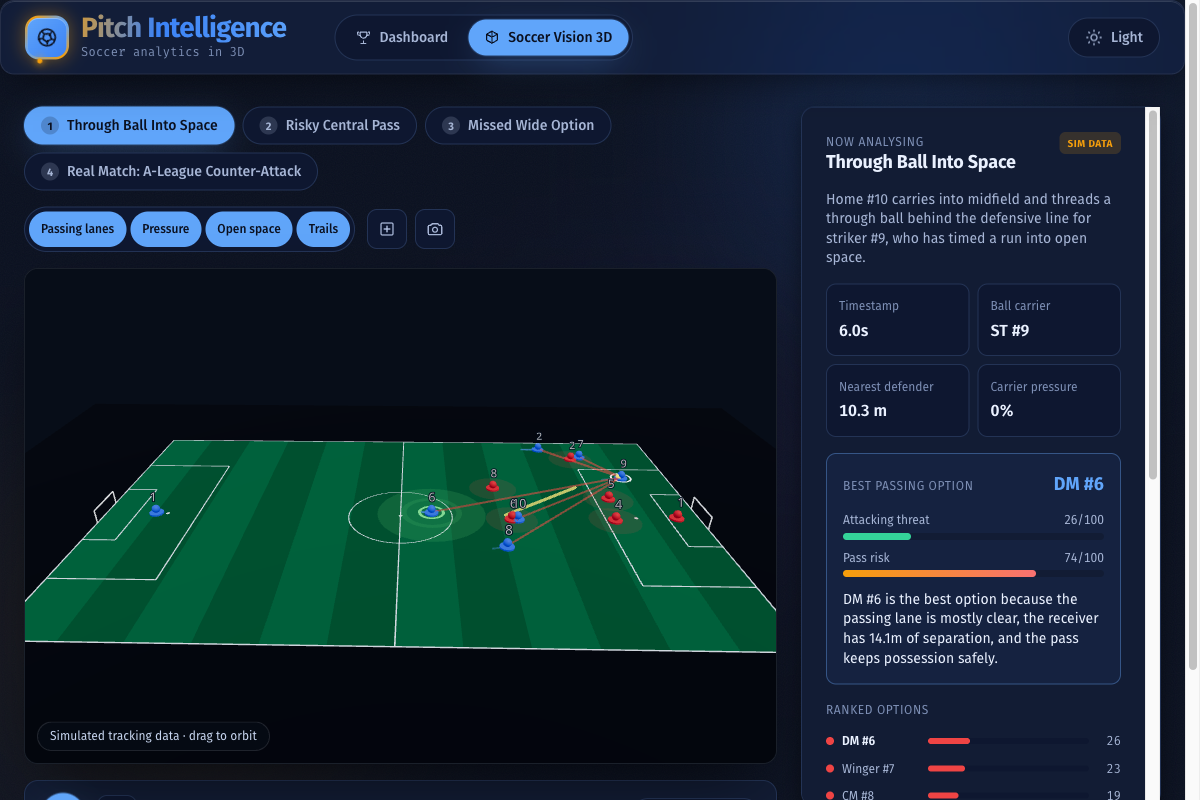
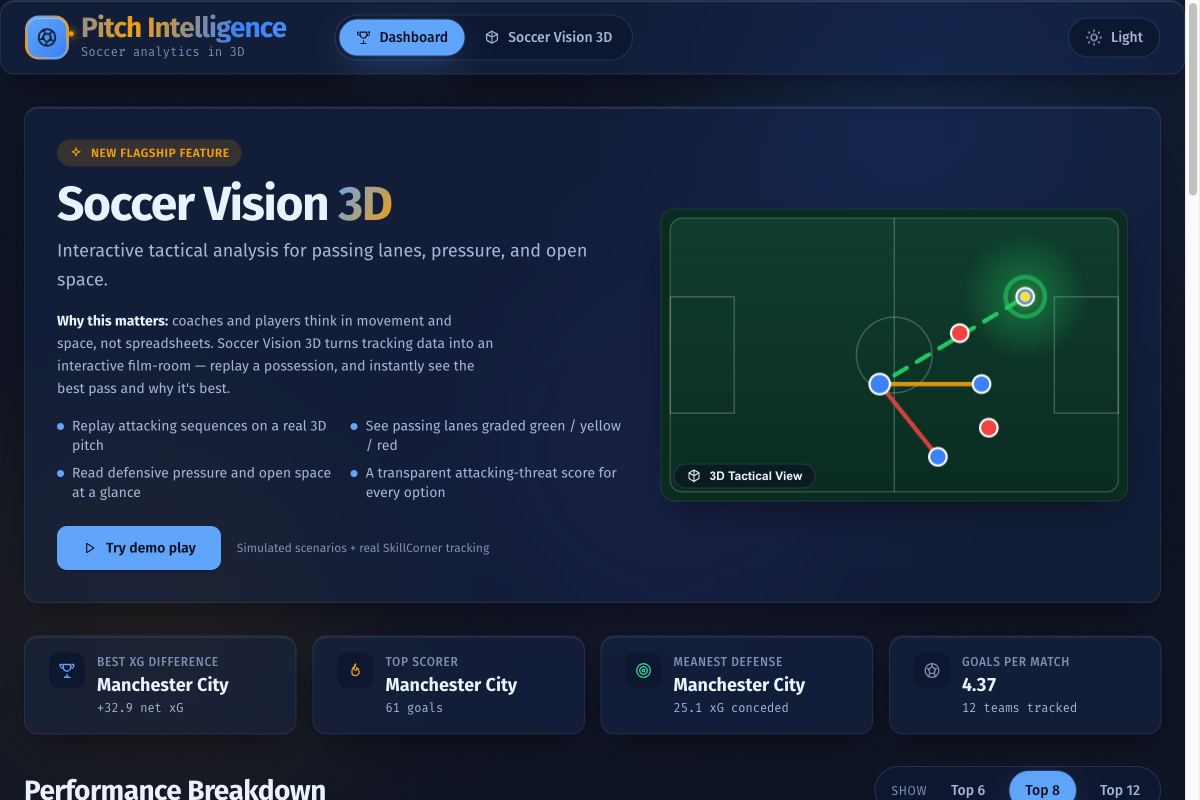
Pitch Intelligence reads a soccer possession the way a coach does. You open a play, drag the timeline, and at any frozen moment it scores every pass the player on the ball could make and points at the best one, with a one-line reason. Open lanes show green, dicey ones yellow, bad ones red. Red blobs mark where defenders are crowding the ball, and green marks the space worth attacking.
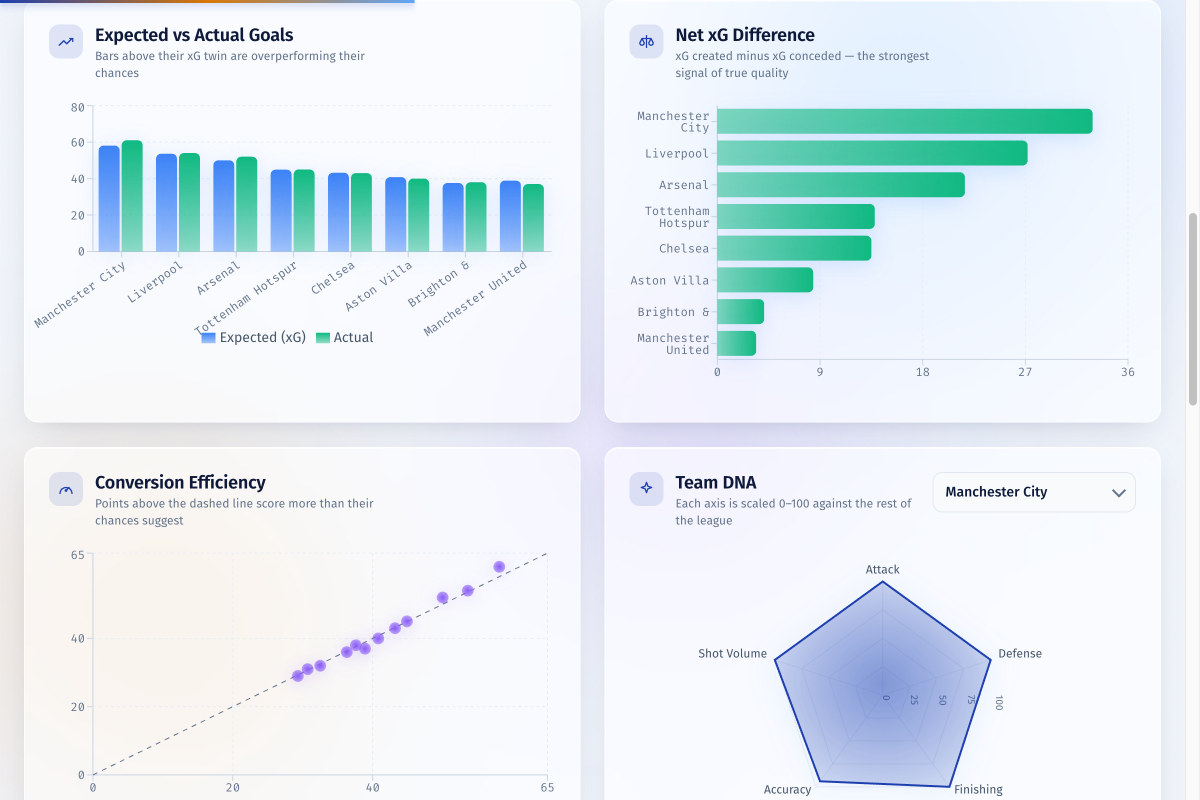
There is also a plain Expected Goals (xG) dashboard for team-level stuff: net xG, how clinically teams finish, a shape radar, and a sortable table.
It runs on three plays we built by hand to teach a point, and on one real possession from SkillCorner's open A-League tracking data. Same math, real movement.
Inspiration
Most soccer dashboards just give you totals. When a coach watches film the questions are different: was the better pass on, who was squeezing the ball, where did the space open. We wanted something that answered those at any frame, not after the whistle.
How we built it
React and Vite on the front. The 3D pitch is Three.js through React Three Fiber, and the charts are Recharts. A small Node API hands over the team stats. We kept the analytics as plain JavaScript functions with their own tests, away from the rendering, so we could actually check the numbers.
The threat score is one formula, and we put it on screen instead of hiding it: 35% forward progress, 25% receiver space, 20% how clear the lane is, 10% centrality, 10% for not being under pressure, scaled 0 to 100. Risk is just 100 minus that. One thing we got wrong at first: a safe pass backwards scored well, because "space" and "clear lane" were both high for it. So forward progress can now go negative, and backwards balls stop looking like chances.
Working with real tracking data
Real broadcast tracking is rougher than you would hope. Players vanish when they leave the TV frame, the coordinates are centered on the halfway line, and the whole file comes down through Git LFS. We wrote an adapter that moves SkillCorner's coordinates onto our pitch, fills the missing moments by interpolating, and flips the team in possession to "attacking" so the math points the right way. That adapter has tests too, because we did not trust ourselves with the coordinate flips.
Challenges we ran into
Two things ate most of the time. The first was keeping 22 players and the ball moving smoothly without React re-rendering every frame, which we solved by driving the motion off refs and only telling React the frame index about ten times a second. The second was finding a real possession where the camera actually saw the whole pitch. Our first pick was a one-wing attack with half the players missing, and it just looked empty.
Accomplishments that we're proud of
It actually does the analysis. You can take any score and follow it back to the inputs, the formula sits right there in the panel, and it holds up on real tracking data rather than only on the plays we wrote.
What we learned
For something a coach would use, being able to explain a number matters more than chasing the last percent of accuracy. Real data also keeps you honest. Missing players and one-sided cameras decide what you can fairly claim, whether you like it or not.
What's next
Swap the simple xG proxy for a trained model. Teach it offside and the defensive line. Let people draw their own scenarios. Pull in more real matches.
Built With
- css
- express.js
- javascript
- node.js
- react
- react-three-fiber
- recharts
- skillcorner
- three.js
- vercel
- vite


Log in or sign up for Devpost to join the conversation.