Inspiration
During a live race broadcast, a production team is watching dozens of panels at once, car telemetry, stream health, feed uptime, and manually deciding what needs attention. That's slow, and it's easy to miss something. As someone building toward a career at the intersection of software engineering and motorsport (Formula Student is my current stepping stone), I wanted to build something that actually solves a real production-ops problem rather than a generic demo.
What it does
Pit Wall is an autonomous agent that watches live race telemetry and broadcast-health data, and takes action directly in Grafana when something needs a producer's attention, without a human having to be staring at the dashboard at that exact moment.
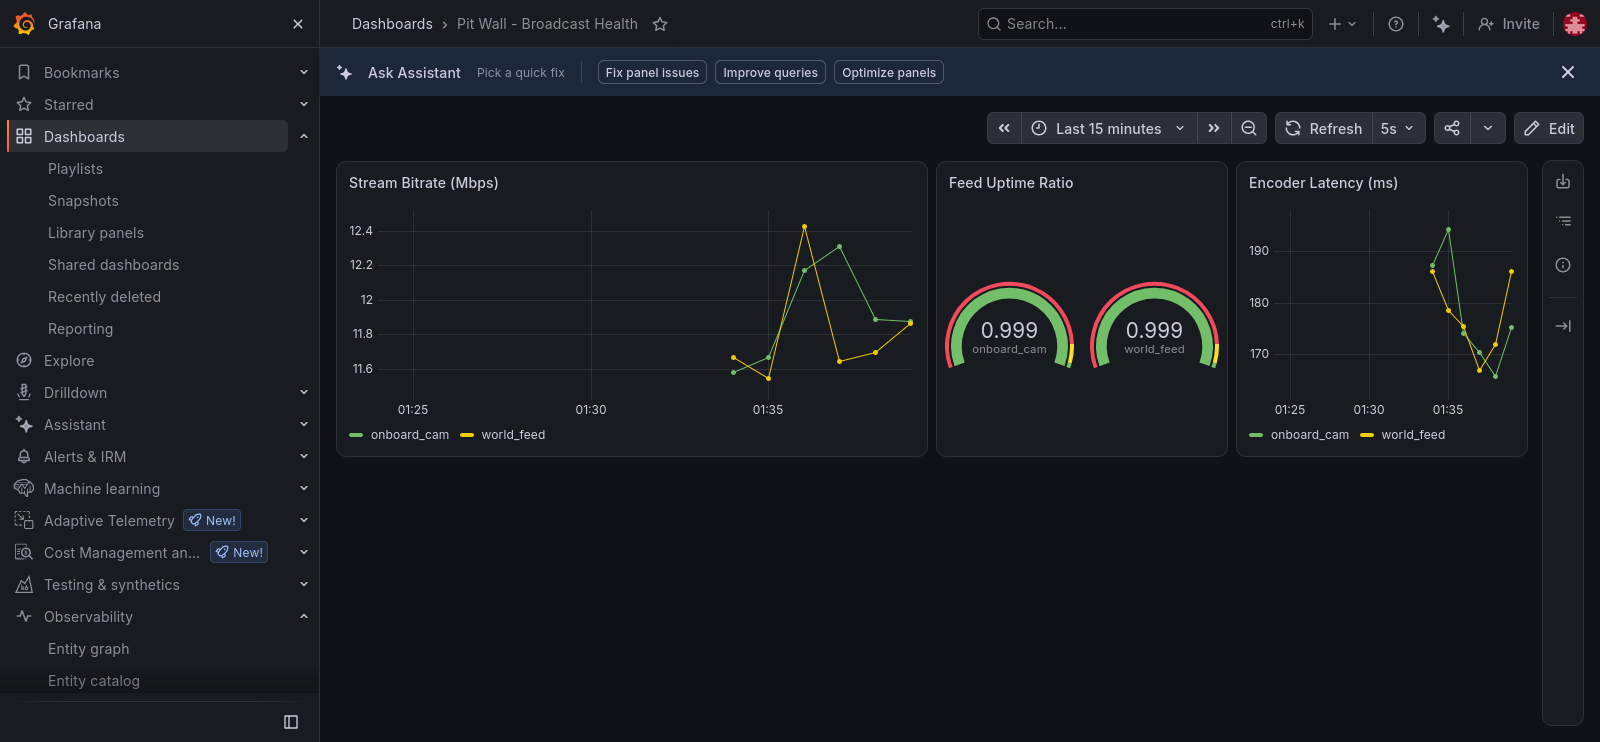
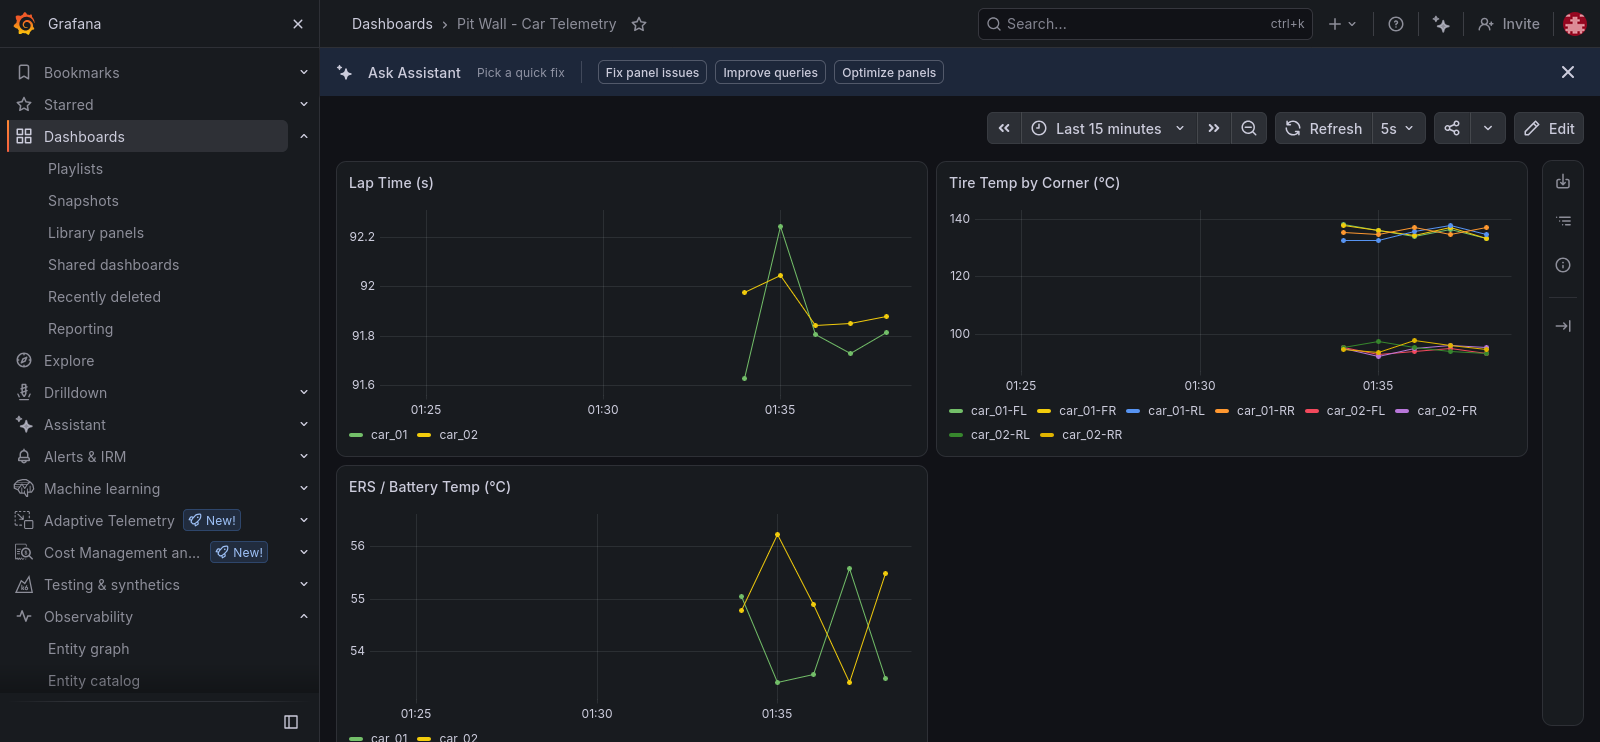
- Watch: polls car telemetry (tire temp, ERS temp, lap time) and broadcast health (stream bitrate, feed uptime, encoder latency) against a deterministic set of thresholds.
- Reason: when something's flagged, Gemini decides the severity and groups related readings into one clear action, rather than firing off duplicate alerts for every individual sensor reading.
- Act: calls Grafana's official MCP server to annotate the dashboard timeline directly, a real API call into a live Grafana Cloud instance, not a simulation.
- Report: summarizes what happened in plain English a non-technical producer could read at a glance.
How I built it
- Agent: Google's Agent Development Kit (ADK), running Gemini, with a custom
FunctionToolfor telemetry checks and anMcpToolsetwired to Grafana's official MCP server (grafana/mcp-grafana). - Data pipeline: a synthetic telemetry generator (Python,
prometheus_client) exposing realistic car and broadcast metrics, scraped by a local Prometheus instance, which pushes to Grafana Cloud viaremote_write. - Detection layer: anomaly thresholds are deterministic Python logic (
agent/anomaly_rules.py), not LLM judgment, this keeps detection reliable and unit-tested. The LLM's job is reasoning about what to do with a flagged anomaly, not deciding whether one exists. - Dashboards: two provisioned Grafana dashboards (car telemetry, broadcast health) that the agent annotates in real time.
Challenges I ran into
- Environment variables silently not reaching a subprocess. Early on, Grafana's MCP server kept reporting
api_key_set=falseeven though my.envfile had the right token. Traced it all the way down through ADK'sStdioServerParametershandling to confirm it does merge custom env vars correctly the actual bug was a missing line in my own.envfile from an earlier edit. - Annotations not appearing on the dashboard. The agent successfully created annotations (confirmed by returned IDs), but they didn't render on the dashboard timeline, because I hadn't told it which
dashboardUIDto target. Fixed by explicitly mapping issue types to dashboard UIDs in the agent's instructions. - Free-tier rate limits, twice over. First hit a 5-requests-per-minute cap (fixed by slowing the poll interval and batching related anomalies into a single tool call instead of one call per sensor reading). Then hit a daily cap of 20 requests, turned out I was using
gemini-flash-latest, which points to an experimental model with tighter limits than the stable release. Switching to a GA model fixed it for good. - A Grafana Cloud backend bug. Incident creation currently fails with a
database constraint erroron Grafana's own backend, unrelated to my code. Annotations still work reliably, so I treated this as a known limitation rather than a blocker.
What's next
With more time, the natural extensions are: incident escalation to on-call once Grafana's backend issue resolves, broadcast-feed-specific alert routing, and multi-race/multi-session support.


Log in or sign up for Devpost to join the conversation.