-
-
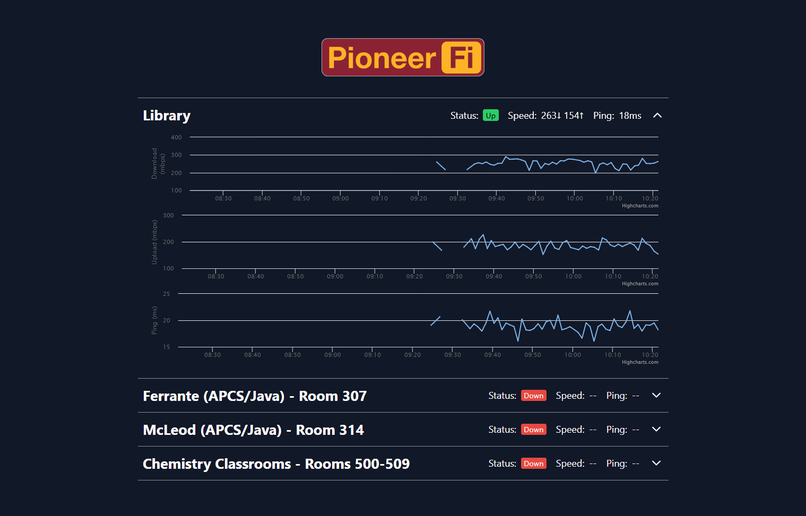
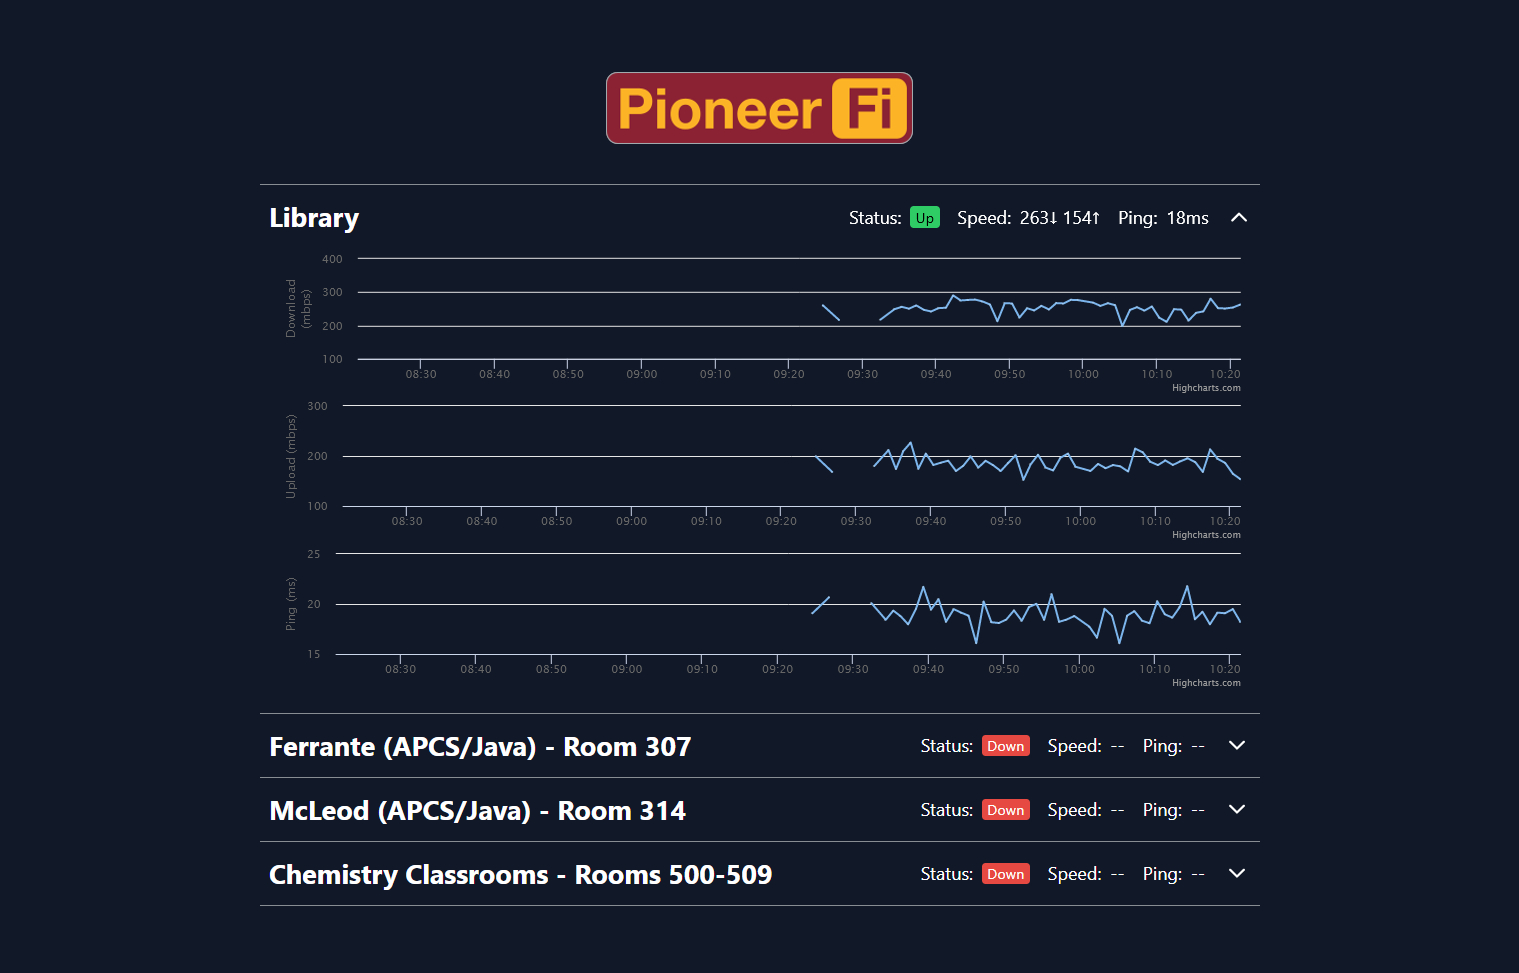
Mock statistics model
-
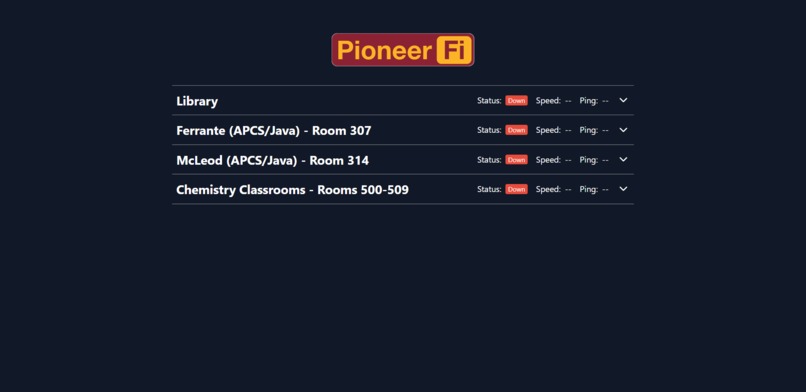
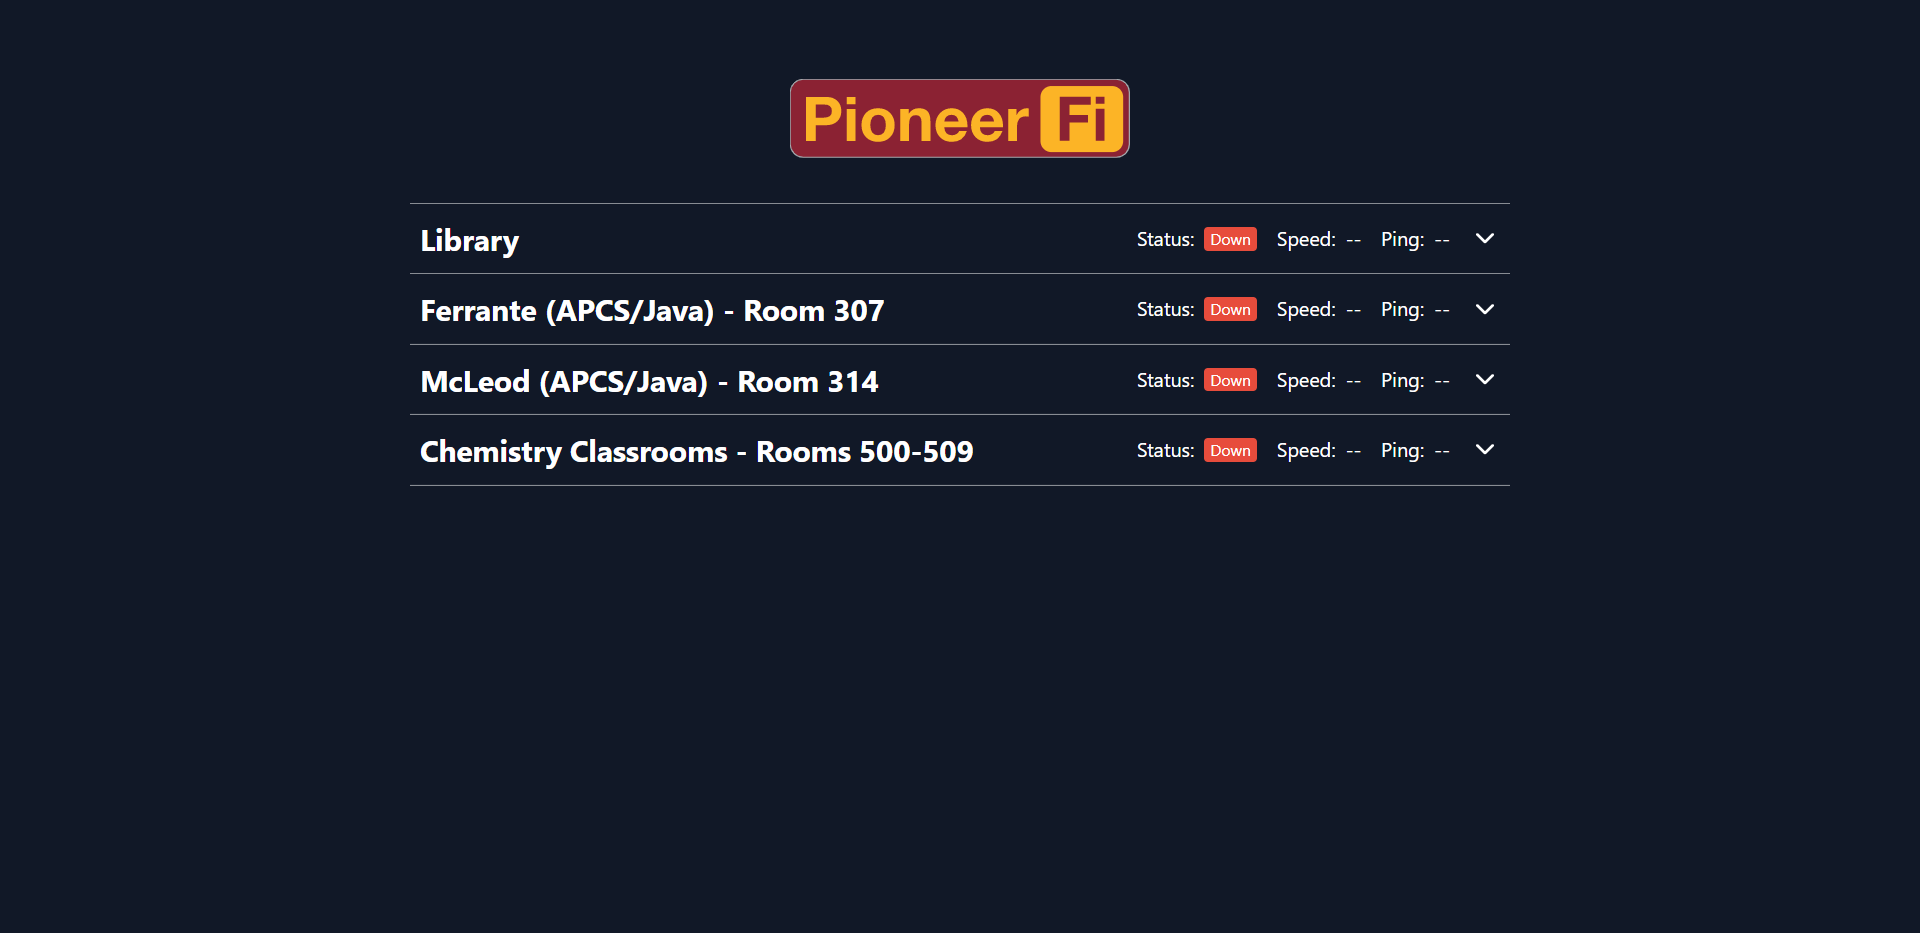
Front-end of the website
Inspiration
My inspiration for this project is a long time coming. I have always gone to crowded classrooms where the Wi-Fi was terribly slow and sometimes the Wi-Fi was down. A utility to view the network performance of various spaces on campus would be a very valuable tool for students, both by saving them time not going to classrooms that lost Wi-Fi only to realize that they have to go back to another classroom, but also for optimizing study time by going to classrooms with higher internet speeds, this would somewhat solve overcrowding in select classrooms during tutorial.
What it does
PioneerFi aggregates data from various nodes monitoring the network speeds of common wireless access points on campus. This data is processed by the server and is displayed via a corresponding graph for each node on my web page. This graph shows both the current network speed, and the trend of this speed over time.
How we built it
My IoT nodes which provide the network data to be displayed use various Python scripts to run diagnostic tools on the network, clean this data into a concise format, and send this cleaned data to the server.
Python powers my server code as well, using Flask to build the REST API that I use to route requests and interface between the database and web page.
The database is an implementation of MongoDB, which I chose due to the extensive use of JSON elsewhere throughout my codebase, which made it sensible to use a DB stack which would allow to keep data as is.
The front end is built using Javascript's Vue framework, which allows it to easily interface with my server-side API. Additionally, I opted to use the Highcharts library for visualizing data in an intuitive and interactive way.
Challenges we ran into
My biggest challenge in developing PioneerFi was how to handle cases of nodes losing connection with the server due to network failures.
The original design had each value on the x-axis of the graph correspond to a single transmission made from the nodes to the server. This created a problem where, since only successful communications were stored in the database, instances of network downtime would never be logged or displayed, which is the entire point of the project.
To remedy this, I instead represented the x-axis as time in minutes. This meant that periods of downtime would be accurately represented with a gap in the graph due to an absence of data, as opposed to said absence being ignored by the system.
Another issue I ran into was launching Vue, it simply refused to work on my machine, but I managed to scrape enough of the site to provide a demo. I managed to fix this by starting from scratch and pasting select files over, and recoding others.
Accomplishments that we're proud of
Throughout the course of PioneerHacks, I was presented with various logistical problems which limited the amount of testing and development time I had. Given those circumstances, I am proud of what I was able to accomplish in such a short amount of time.
I also managed to make a fully functioning (although locally hosted) webpage, and I created an API for the first time. I learned so much during this hackathon, things that I most definitely will apply in the future.
What I learned
I learned a whole lot from this hackathon. This is my first time using Atro and the Vue framework for frontend, as well as mongo dB for the backend. Participating and completing this project gave me a lot of insight into full stack development, which helps to generalize my skills into a far wider range of technology.
On the node side of things, this was my first time dealing with nodes and sending requests to the database.
Through this I also learned about IoT development along with the powerful ways in which IoT technology can be leveraged.
What's next for PioneerFi
My plan is to acquire Raspberry Pi computers to serve as nodes and begin rolling out PioneerFi to the various common spaces around campus. In doing so, along with getting school permission and funding, I can make PioneerFi into a website from which anyone on campus can quickly look up specific classes. If it gets to a point, I will have to create a filtering for specific classes, i.e. a query that brings up a specific classroom/set of classrooms Wi-Fi statistics.

Log in or sign up for Devpost to join the conversation.