-
-

Login
-
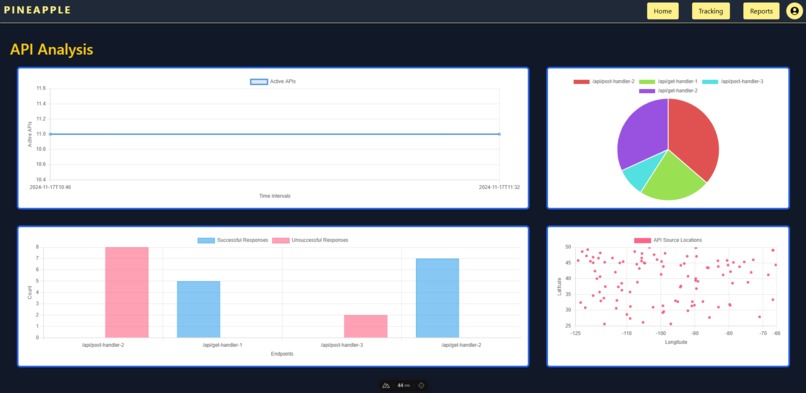
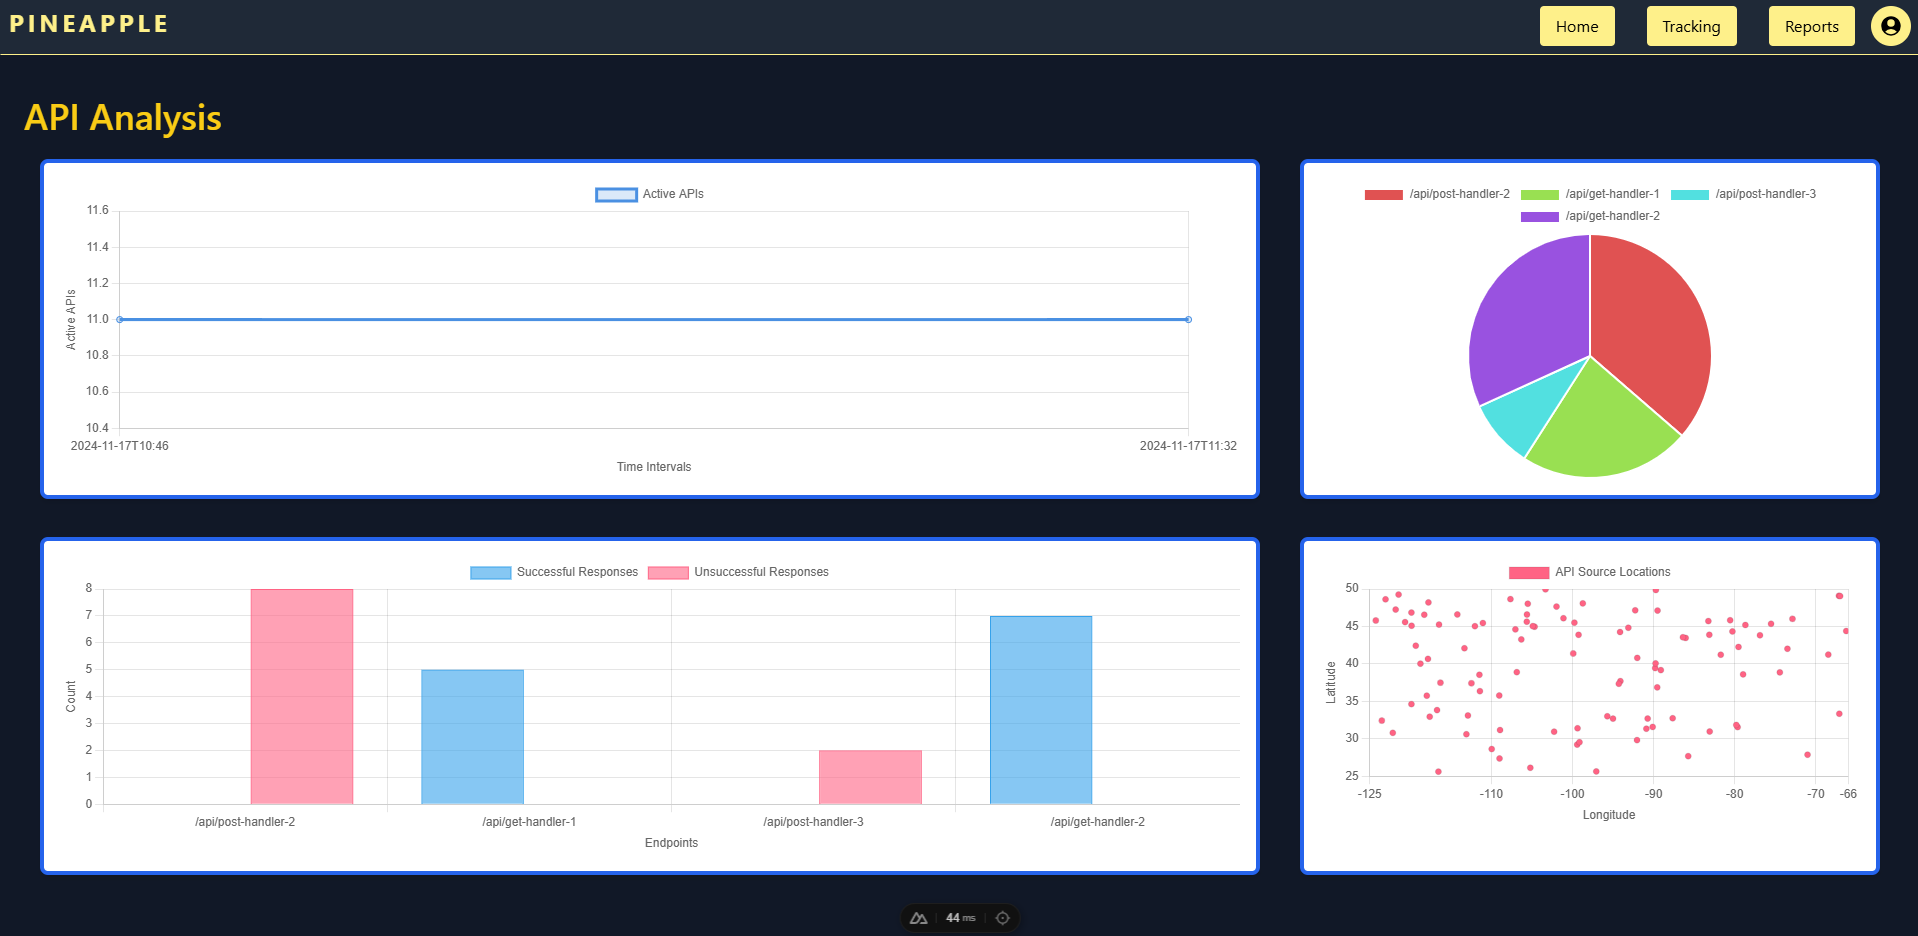
Home Page
-

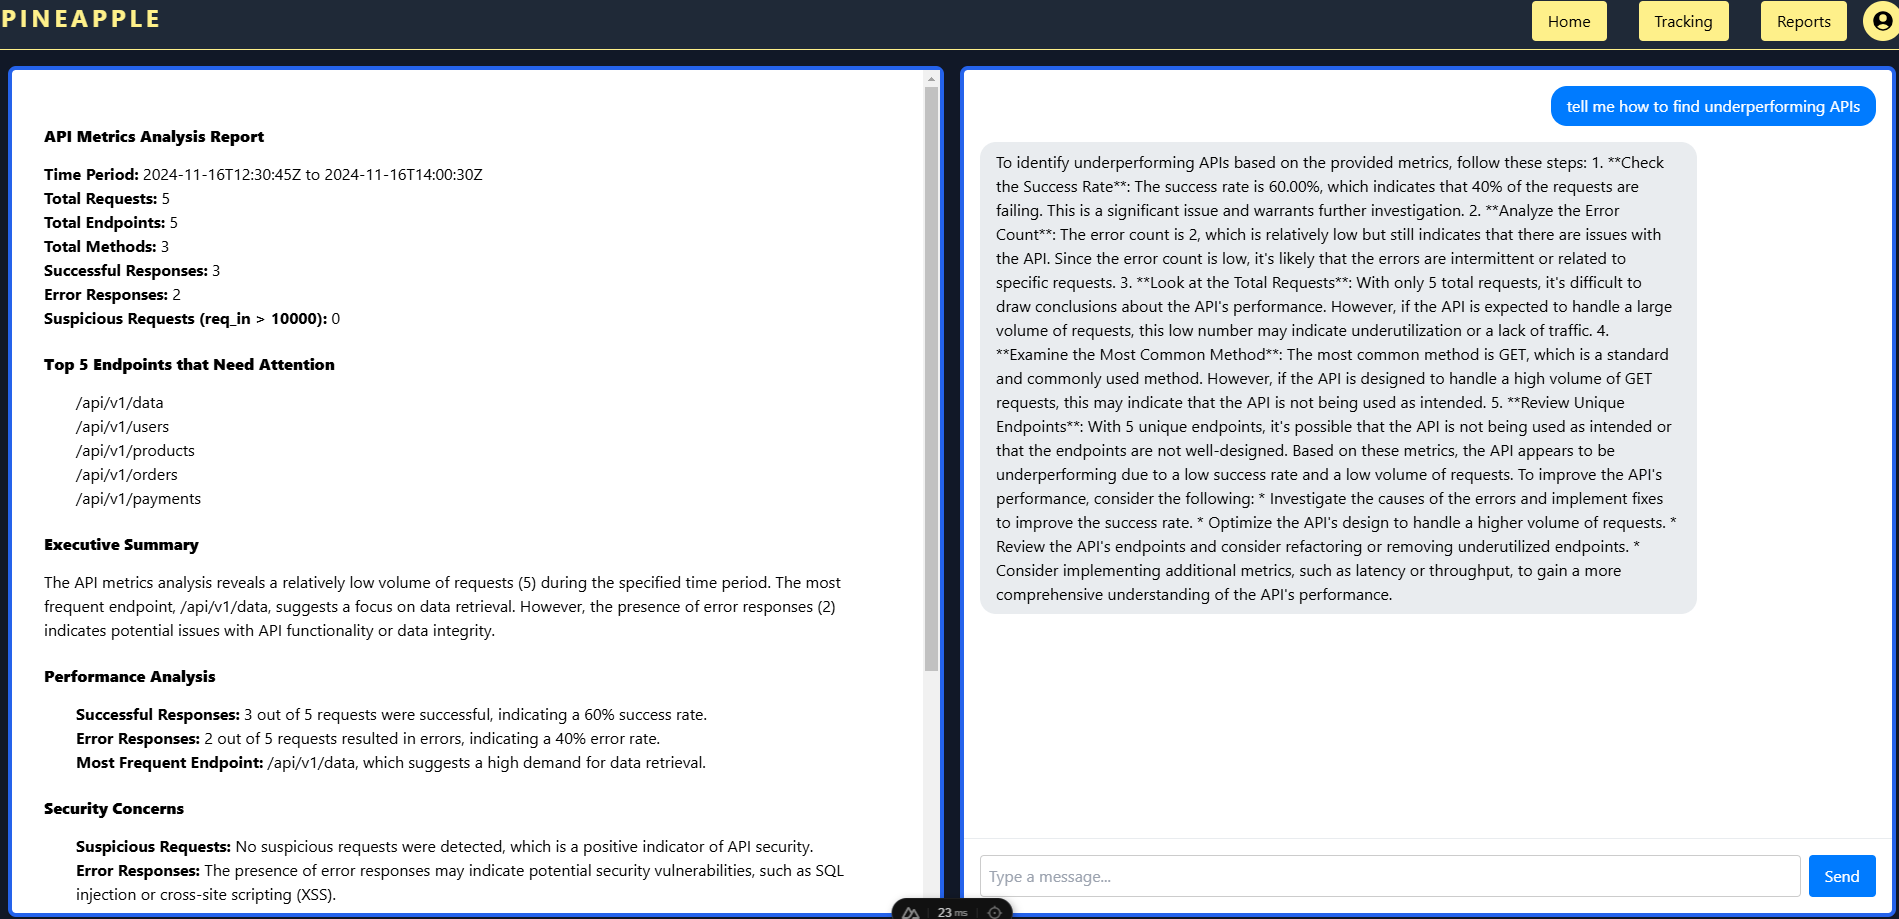
Chatbot + Overview/Report
-
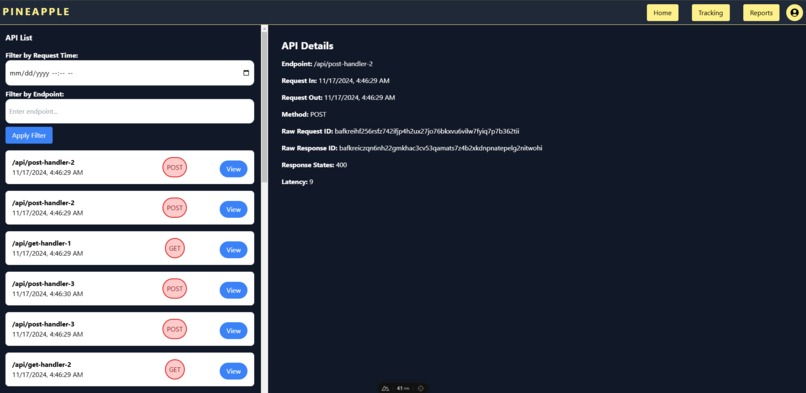
Tracking APIs


Inspiration
API performance monitoring is crucial but often lacks transparency and ease of access for developers.
What it does
It intercepts API calls, logs key data (requests, responses, latency, return codes), and displays it through an analytics dashboard.
How we built it
The middleware collects data, stores it in a PostgreSQL database, and visualizes it through a dynamic analytics dashboard. We store raw API resource dumps in Pinata to allow for ease of access. We also have a page that shows statistics on all the recorded API interactions. An LLM is placed on top of the raw data to generate reports and is available to ask questions relating to the data.
Challenges we ran into
Balancing performance with data logging and ensuring efficient storage and retrieval of large datasets. Also making the LLM reflect accurately to the data that is coming in from the database.
Accomplishments that we're proud of
We created a middleware that provides actionable API performance metrics with next to no impact on API response times. We also implemented a appropriate RAG system that we were able to instruct and direct to return useful conclusions about the data.
What we learned
We learned how to integrate storage solutions and handle large datasets while maintaining system performance. We learned about how to make use of inference APIs and implement them in Python. We also learned how Docker makes it convenient to develop across teams. This was important because we were working on three different languages, Javascript, Golang, and Python.
What's next for Pineapple
Enhancing the dashboard, improving scalability, and releasing it as an open-source tool for the developer community.

Log in or sign up for Devpost to join the conversation.