Inspiration
Every morning, dozens of trucks leave a distribution warehouse carrying hundreds of products headed for bars, restaurants, and retailers across a metropolitan area. The planning behind each trip — which customers go together, in what order, and how everything physically fits inside the truck — is still largely manual. An experienced planner builds routes from memory. A driver restacks the cargo by instinct at the dock.
One wrong call cascades fast: an overloaded vehicle violates weight limits, a badly stacked pallet means 20 extra minutes unloading at a stop, or two fragile items end up crushed under a steel barrel.
We were given a real operational dataset: actual delivery routes, real customer addresses, and real product dimensions from a beverage distributor operating out of Mollet del Vallès. The problem was immediate and tangible. We set out to answer a deceptively simple question: can software load a truck better than an experienced driver?
What We Built
PimPamDamm is a full-stack logistics intelligence platform built around three tightly integrated layers.
🔧 Layer 1 — The Optimization Engine (Python)
The core of the project is a combinatorial optimizer written in Python. It ingests delivery orders from an ERP export, cross-references physical product dimensions from the SAP catalogue, and maps each item to its warehouse location using a spatial model derived from the actual floor-plan layout.
The engine solves several coupled problems simultaneously:
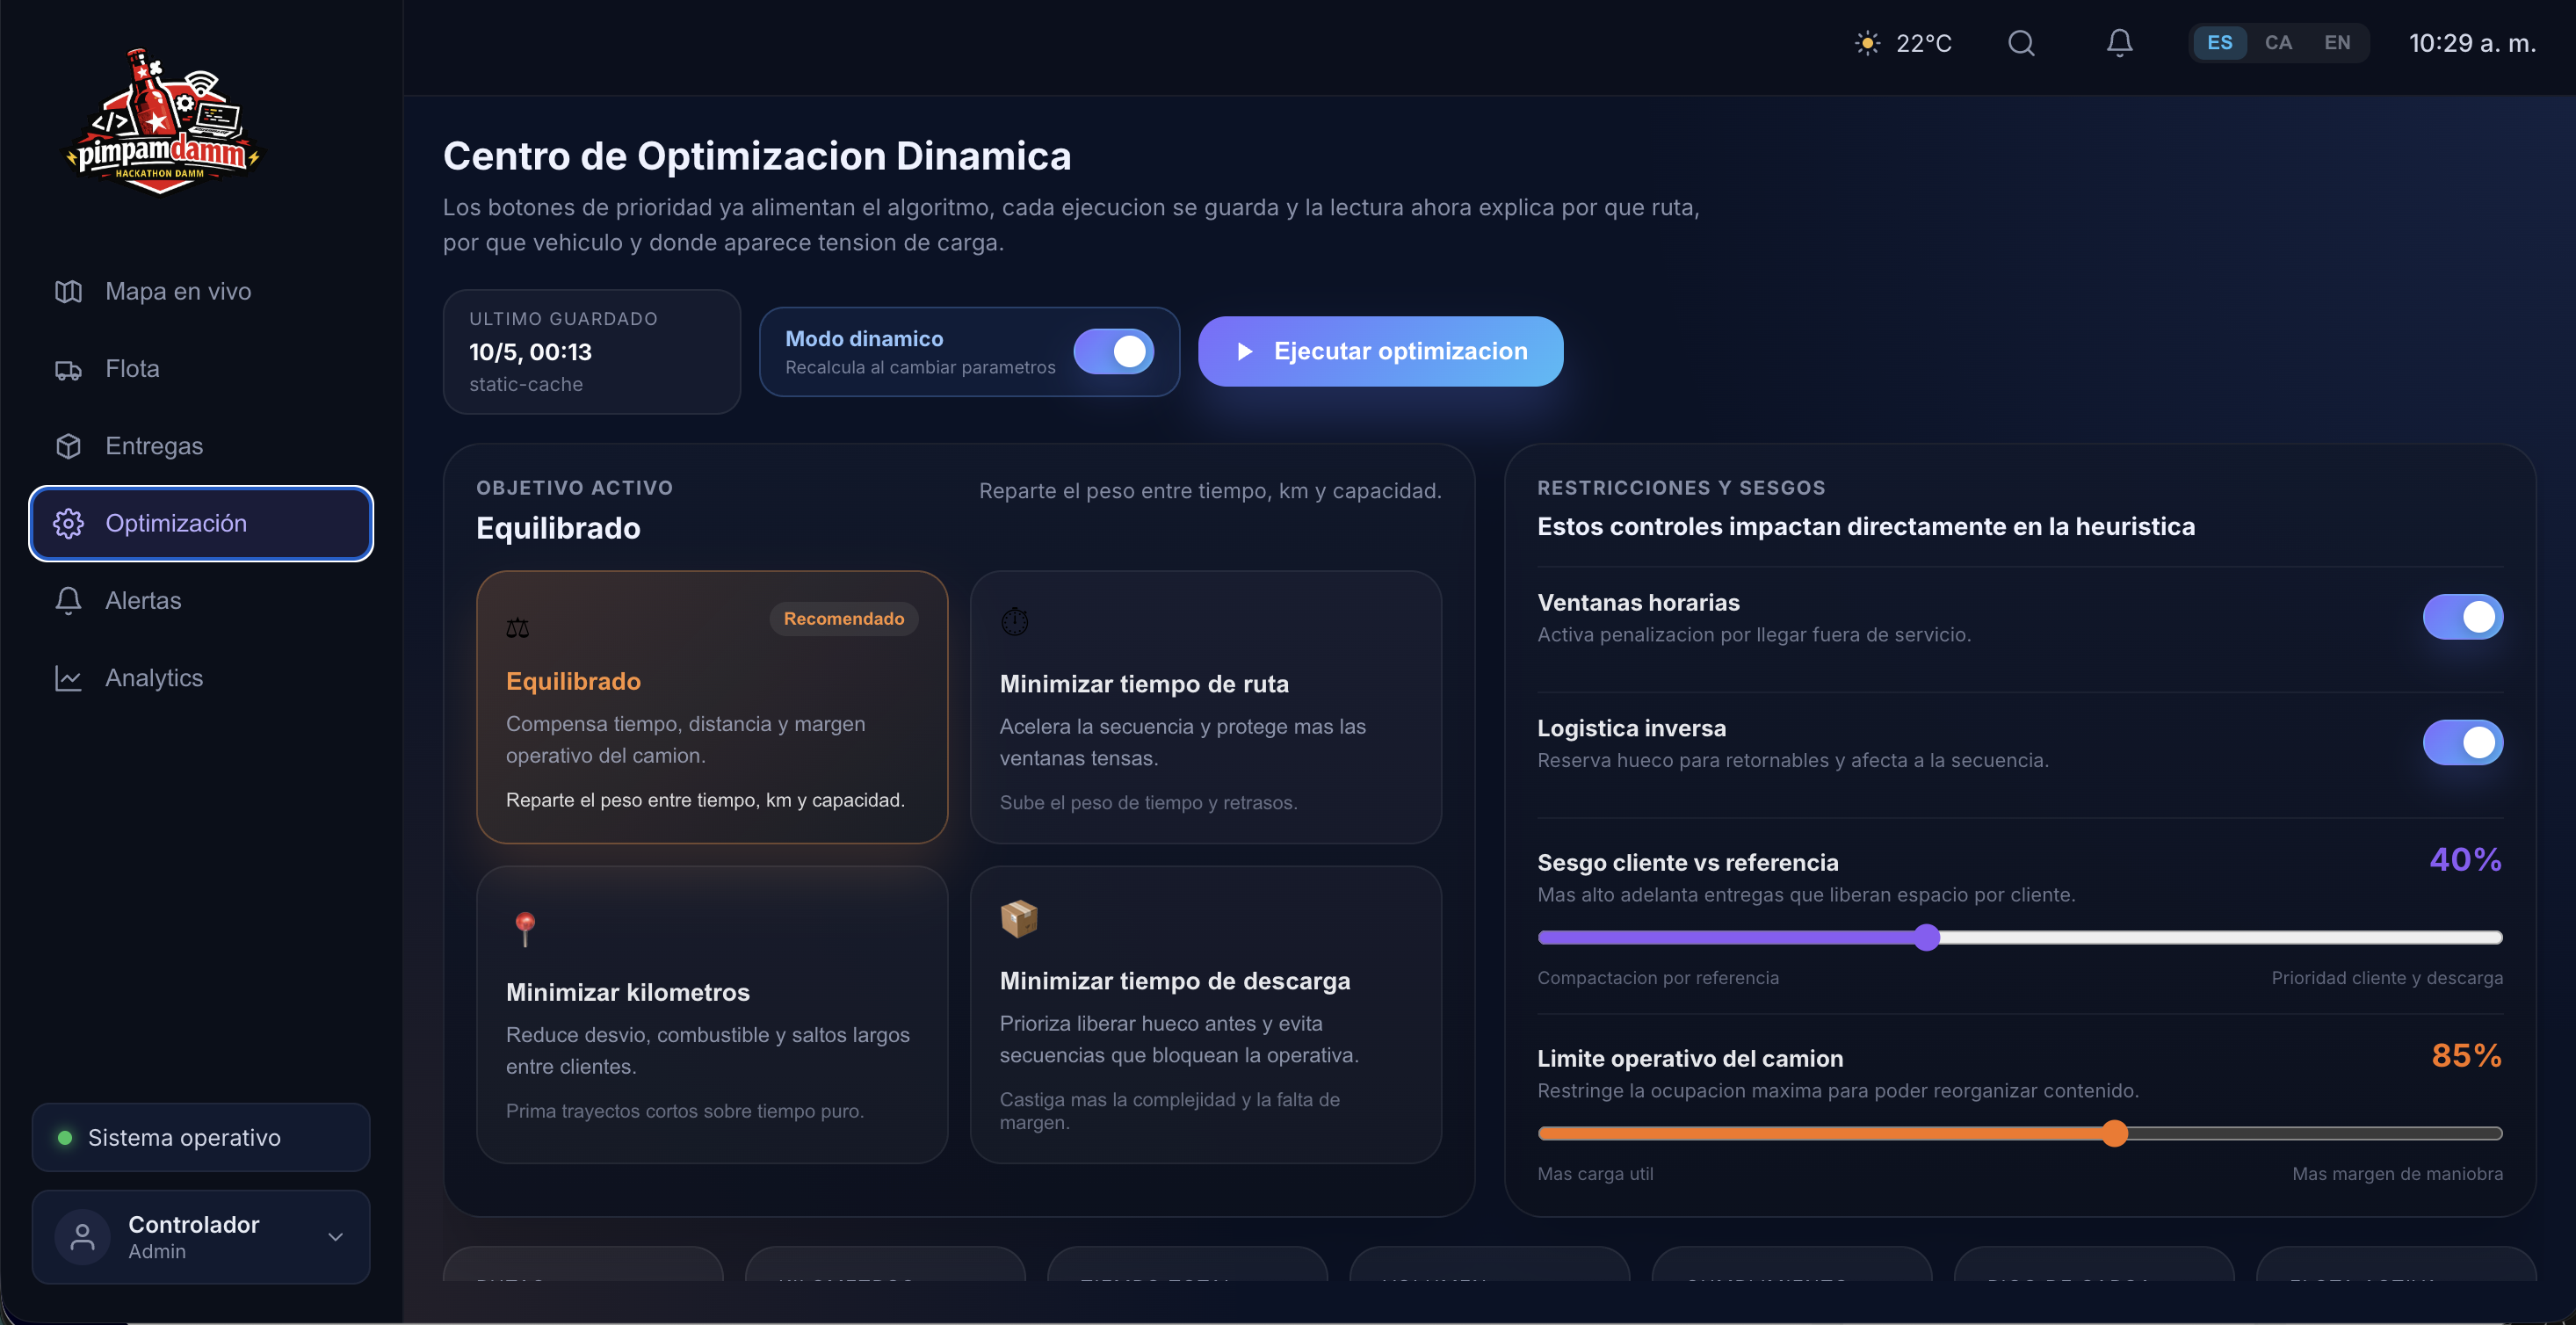
Vehicle Routing (VRP). A greedy constructive heuristic with optional consolidation assigns customers to vehicles. Four configurable objectives are supported — minimize distance, minimize travel time, ease unloading, or a weighted combination — each implemented as a different profile over the same multi-factor scoring function. Time windows, vehicle capacities (6-pallet and 8-pallet trucks), and reverse logistics constraints (empty-container pickups) are all enforced. When there are more routes than available vehicles, the engine runs a second consolidation pass that greedily merges the closest compatible trips.
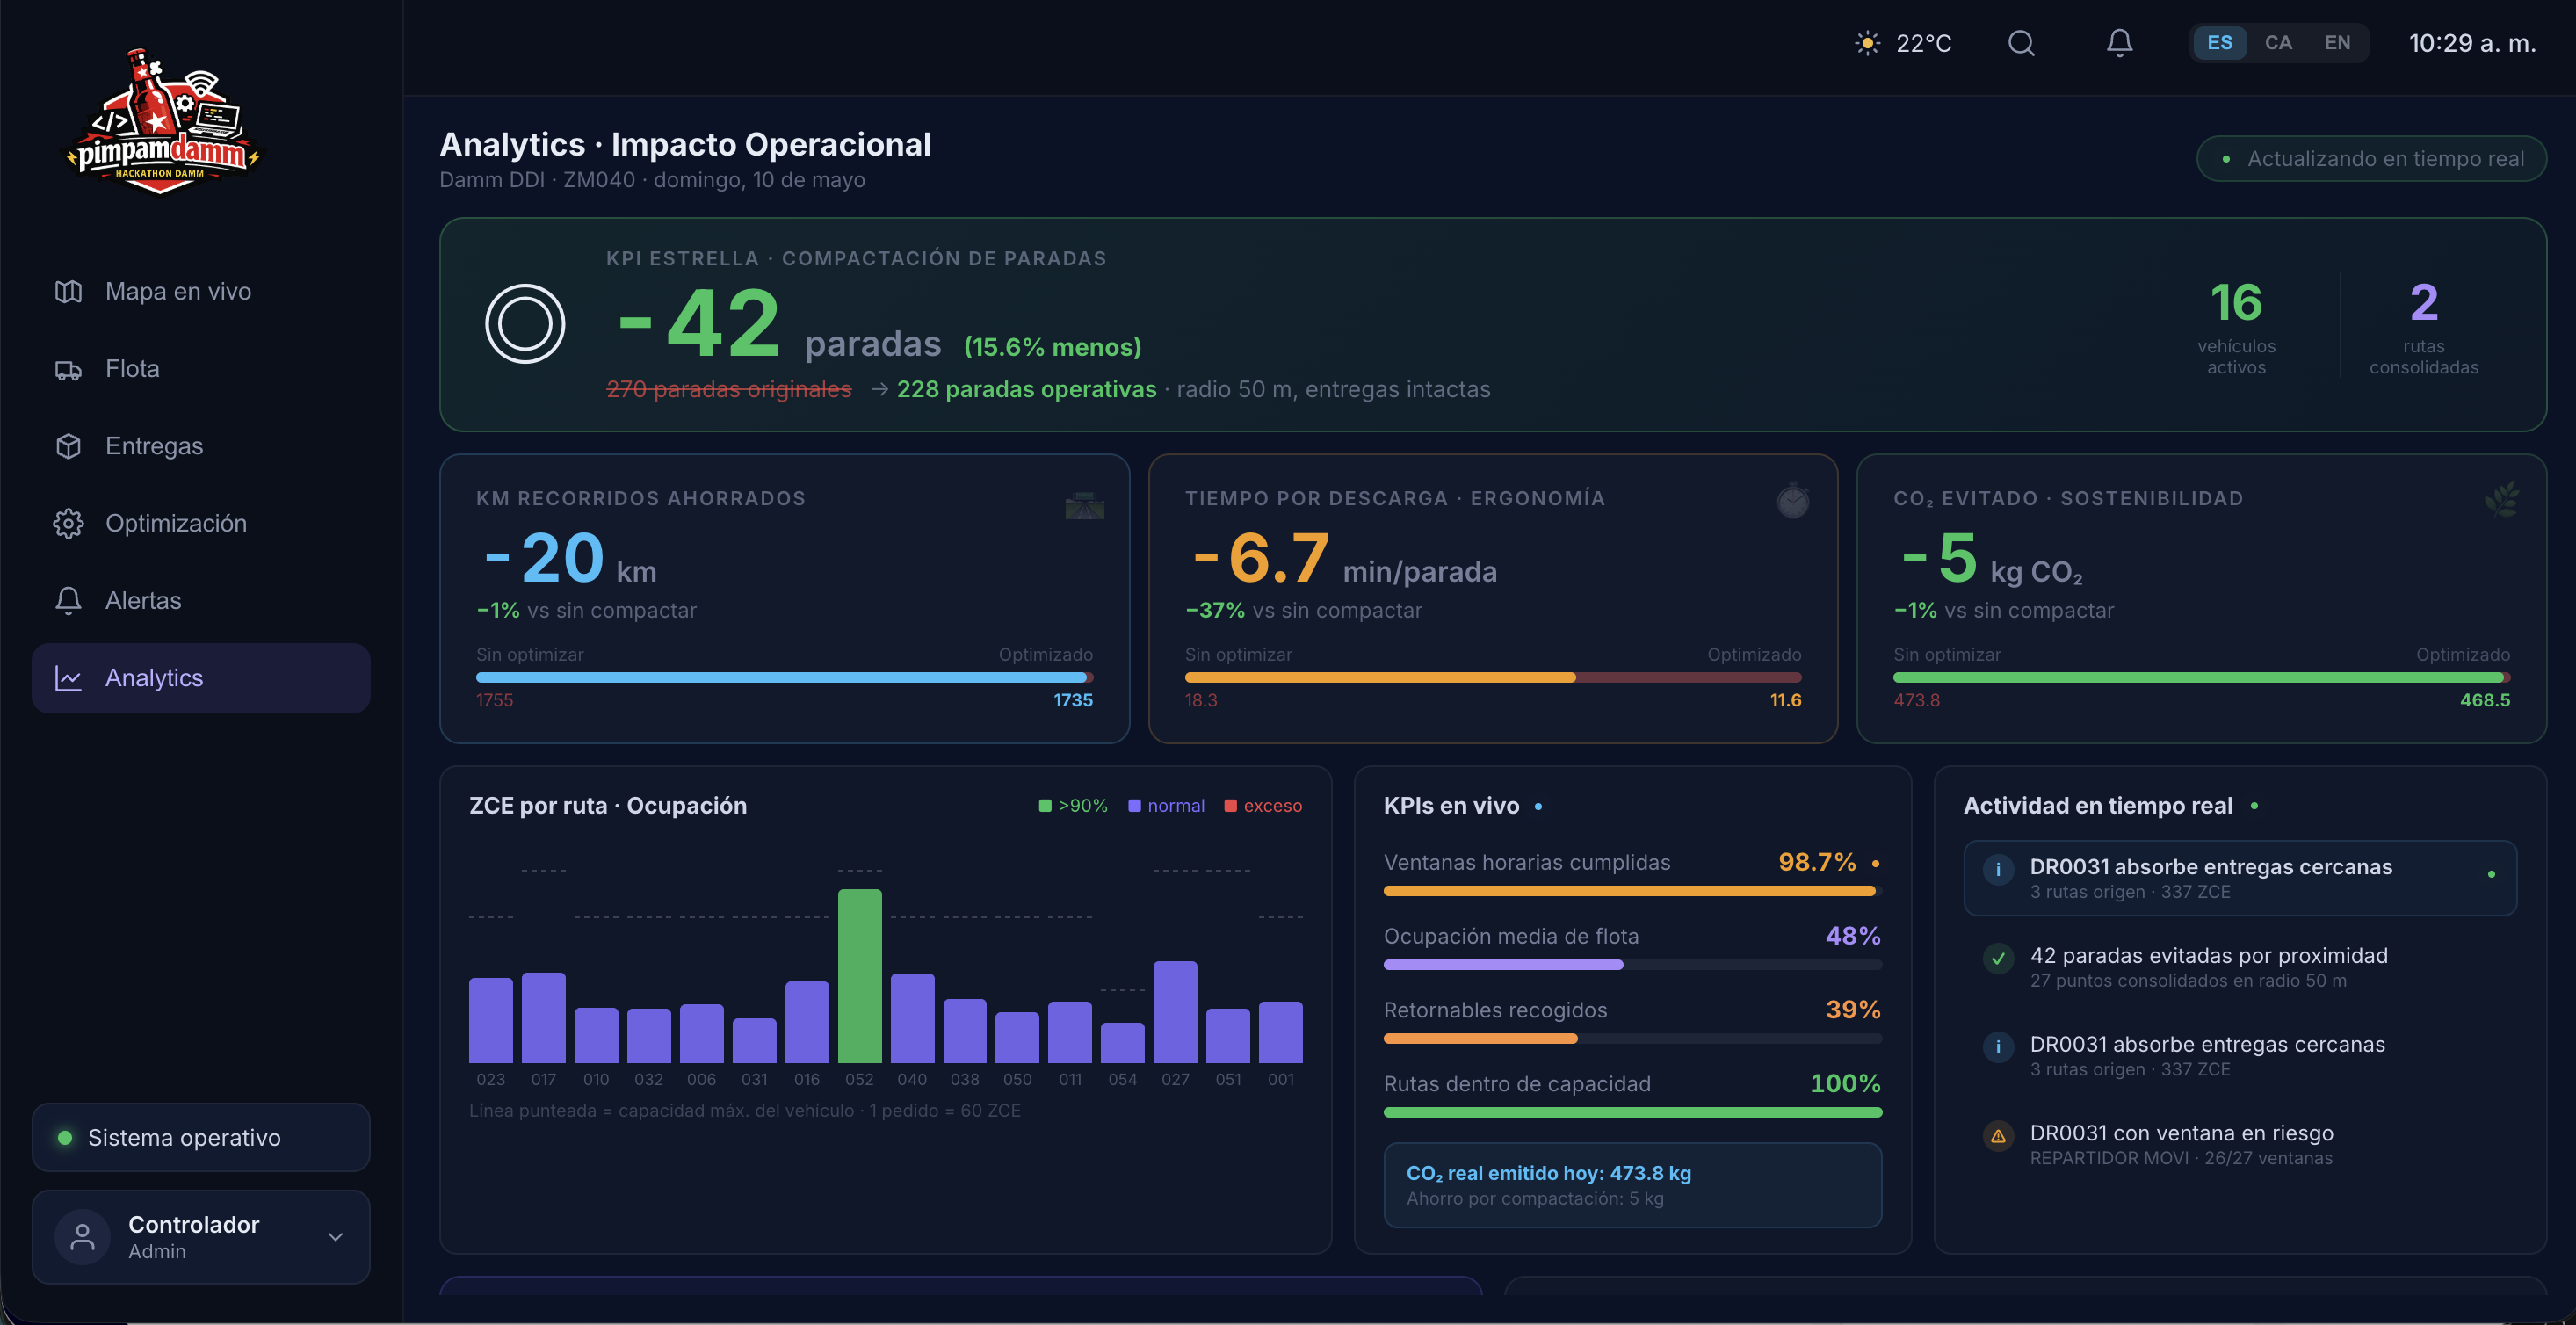
Parking optimization. Before routing, stops within 50 meters of each other are clustered into a single parking point. The driver parks once and walks the last stretch on foot, saving time and avoiding difficult urban maneuvers. The number of stops saved is surfaced directly in the dashboard.
3D Bin Packing. For each trip, a layer-and-shelf packing algorithm places every item into pallet slots. Items are classified by fragility (RESISTENTE, MEDIO, FRÁGIL), oriented to fit within standard European pallet dimensions (120 × 100 × 170 cm), and sorted so that the last delivery stop is loaded first — LIFO order. Fragile items never go under heavy ones.
Dynamic Margin Model. Before committing to a physical load plan, the engine runs a feasibility pre-check that evaluates route complexity, peak return volume, cargo diversity, and bulk-item ratios. The variable safety margin $m_v$ is computed as:
$$m_v = \text{clip}!\left(0.08 + 0.10\,r_{\text{res}} + 0.03\,r_{\text{frag}} + 0.08\,r_{\text{ret}} + 0.06\,d_{\text{fmt}} + 0.03\,d_{\text{mat}} + 0.04\,r_{\text{bulk}} + 0.04\,c_{\text{route}} + 0.14\,\max(0,\,\hat{\rho} - 0.72),\; 0.08,\; 0.32\right)$$
where $\hat{\rho}$ is the nominal load ratio and each $r$ term captures a different risk factor of the cargo mix. This guarantees the planner never commits to a trip so tight that real-world variability — item deformation, driver re-stacking — would cause it to fail in the field.
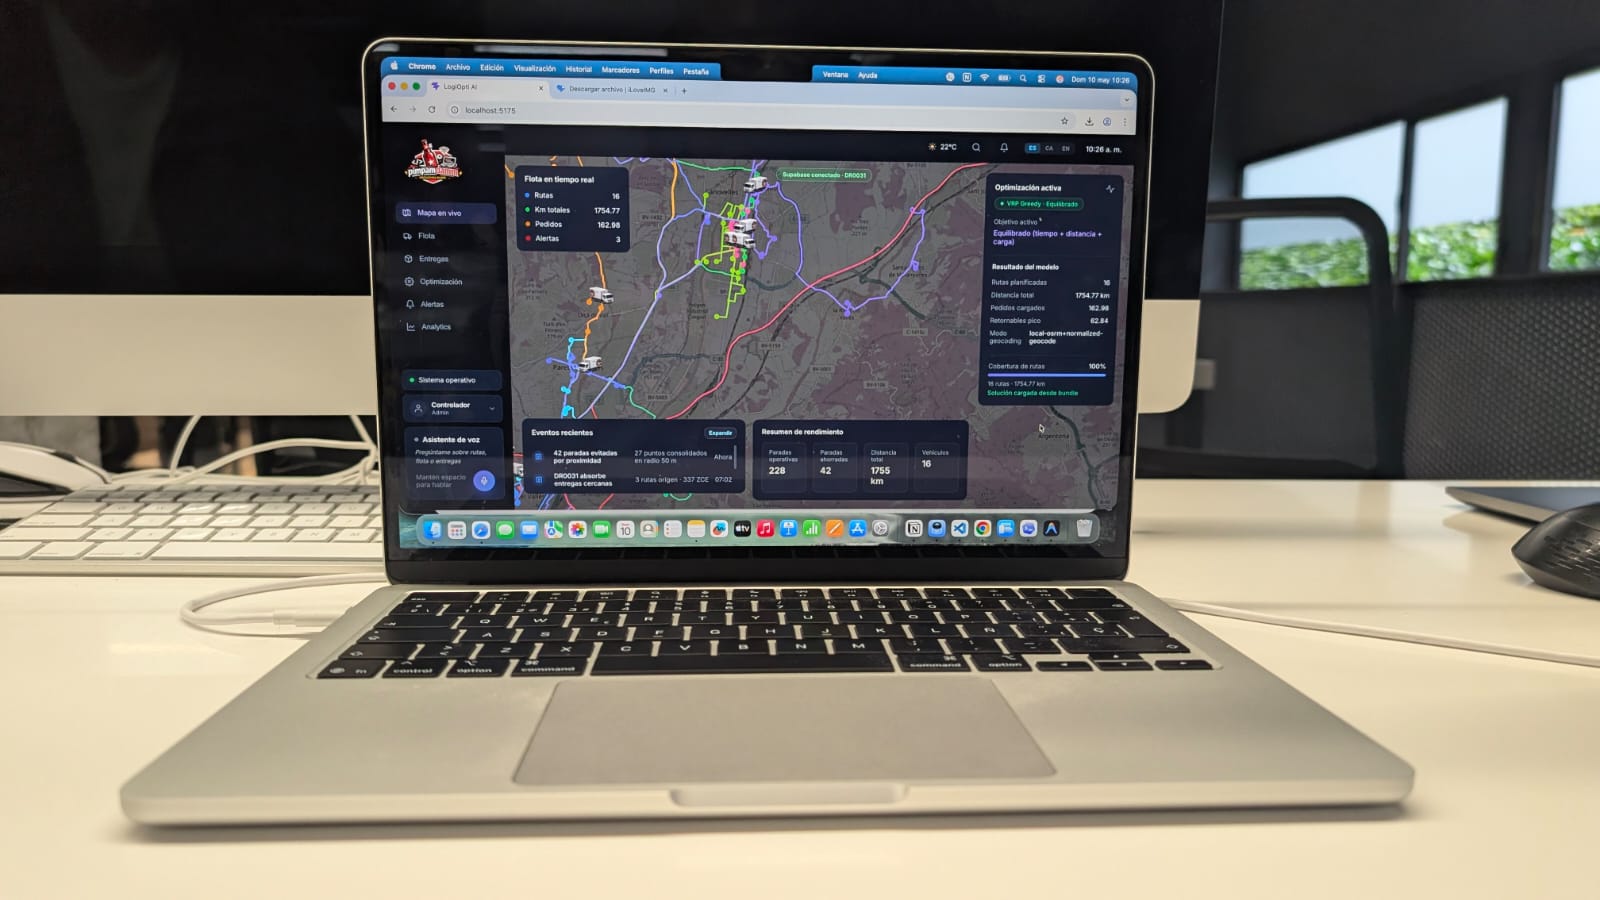
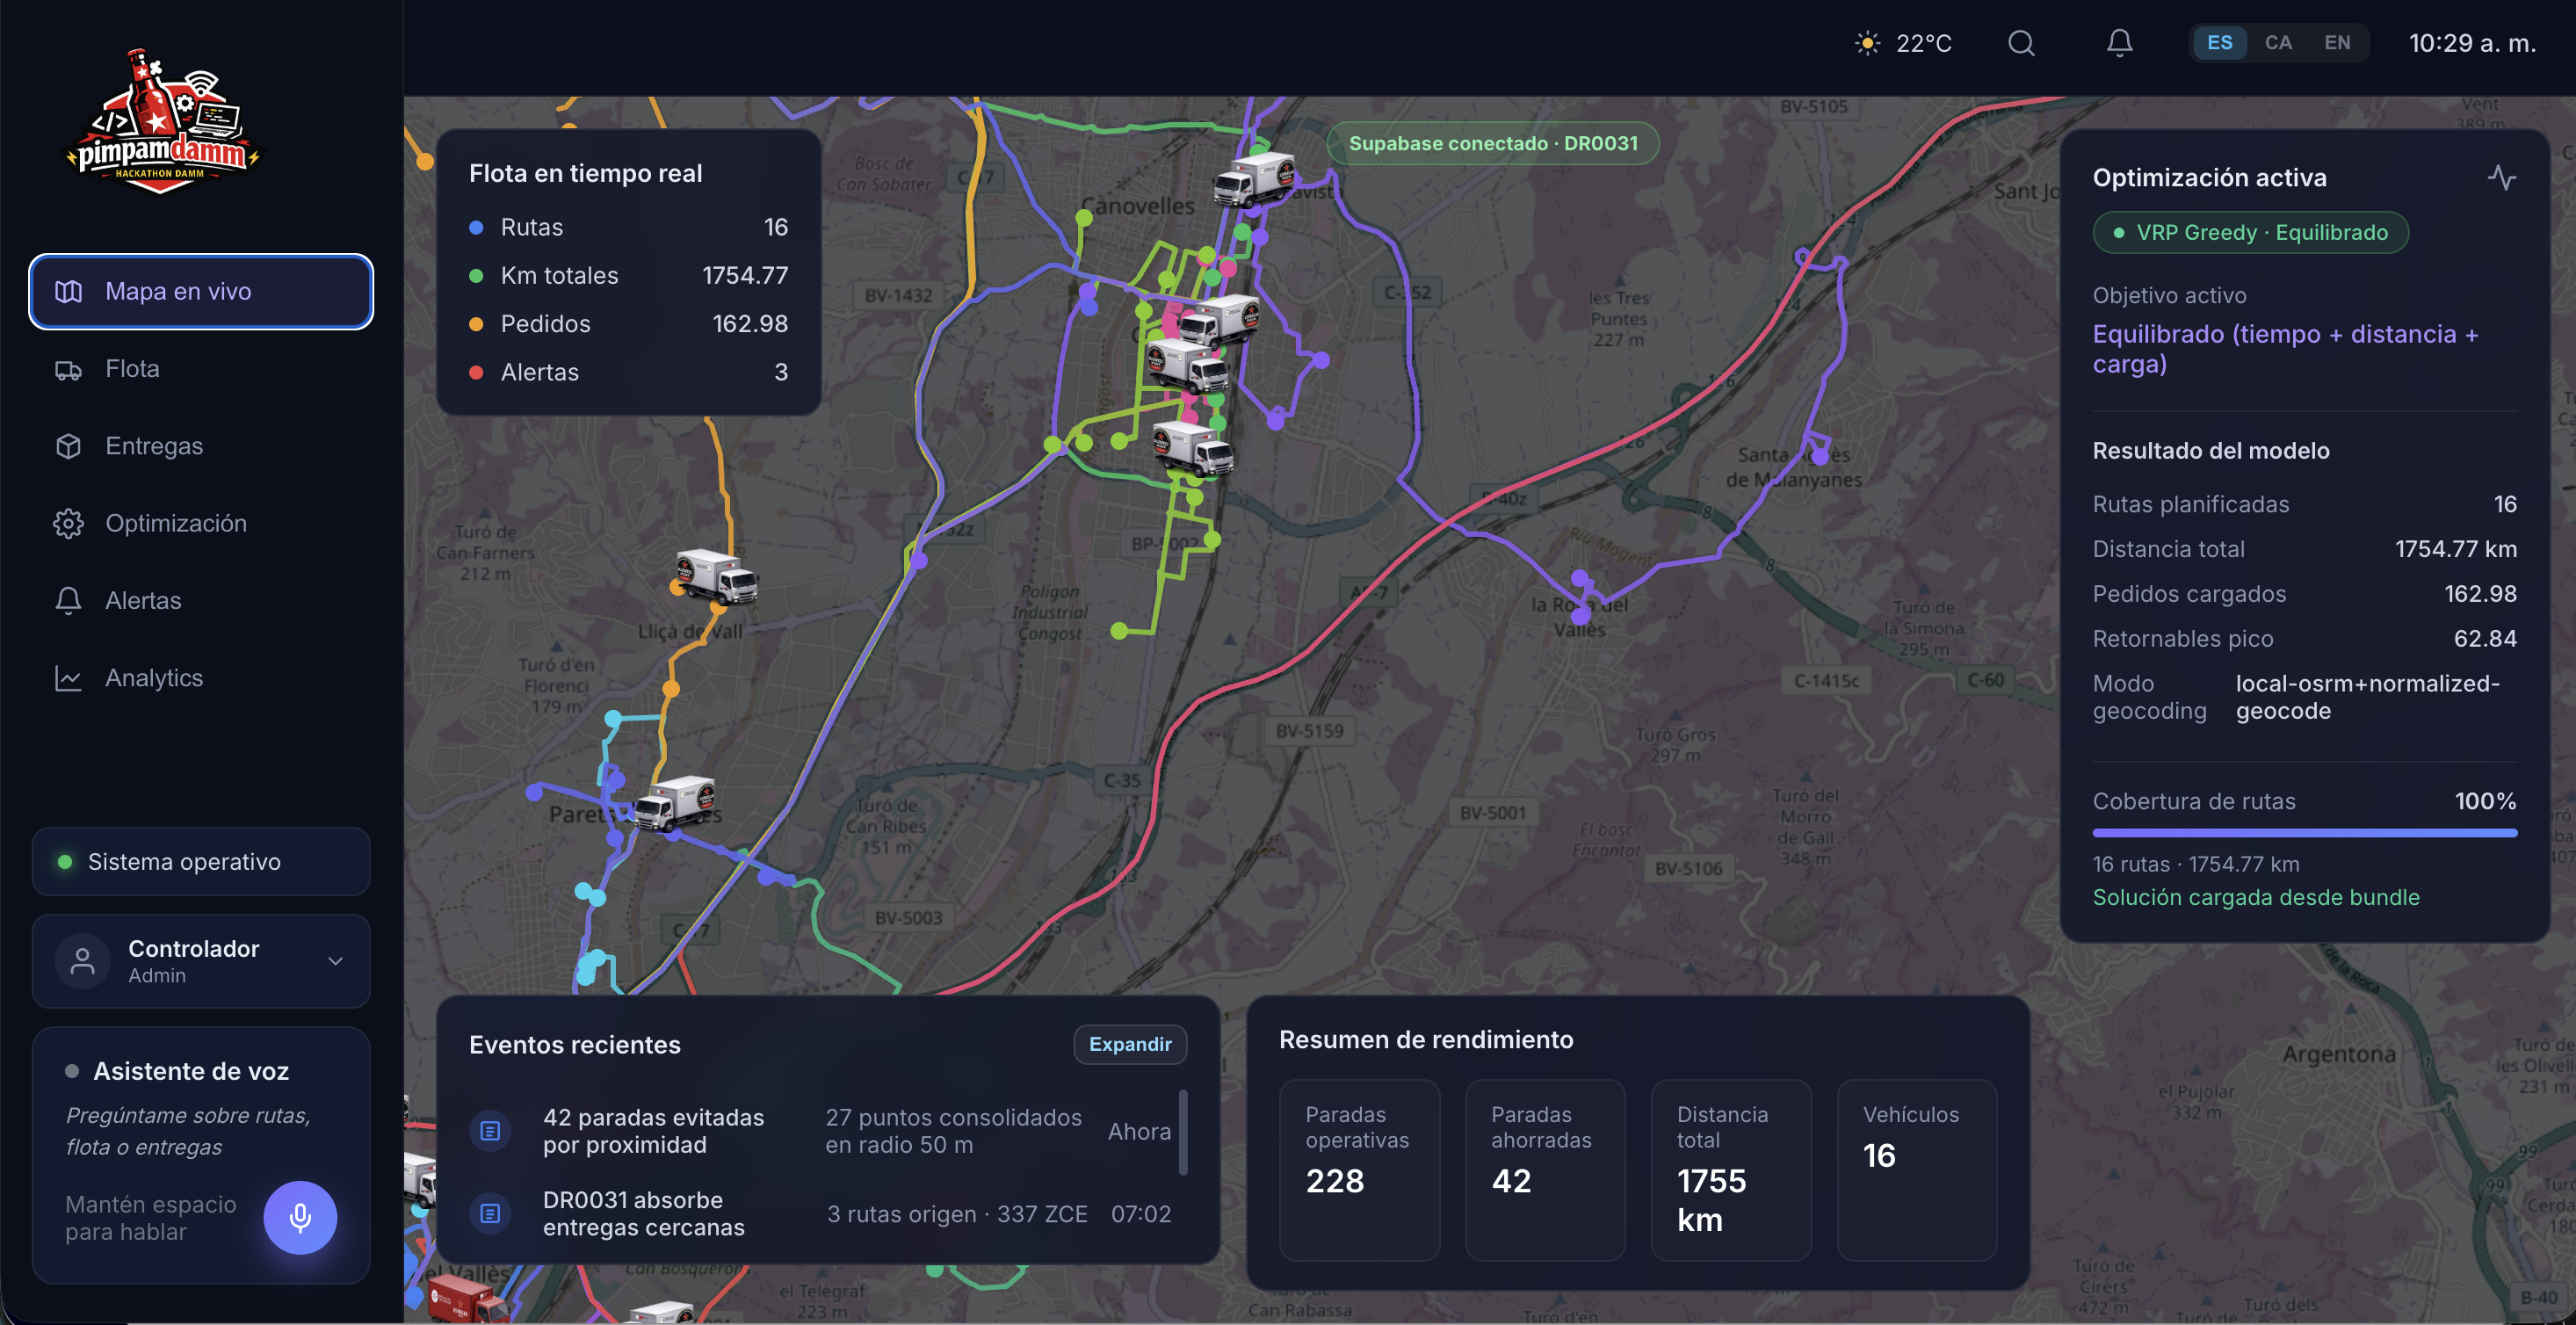
🖥️ Layer 2 — The Control Tower Dashboard (React + Vite)
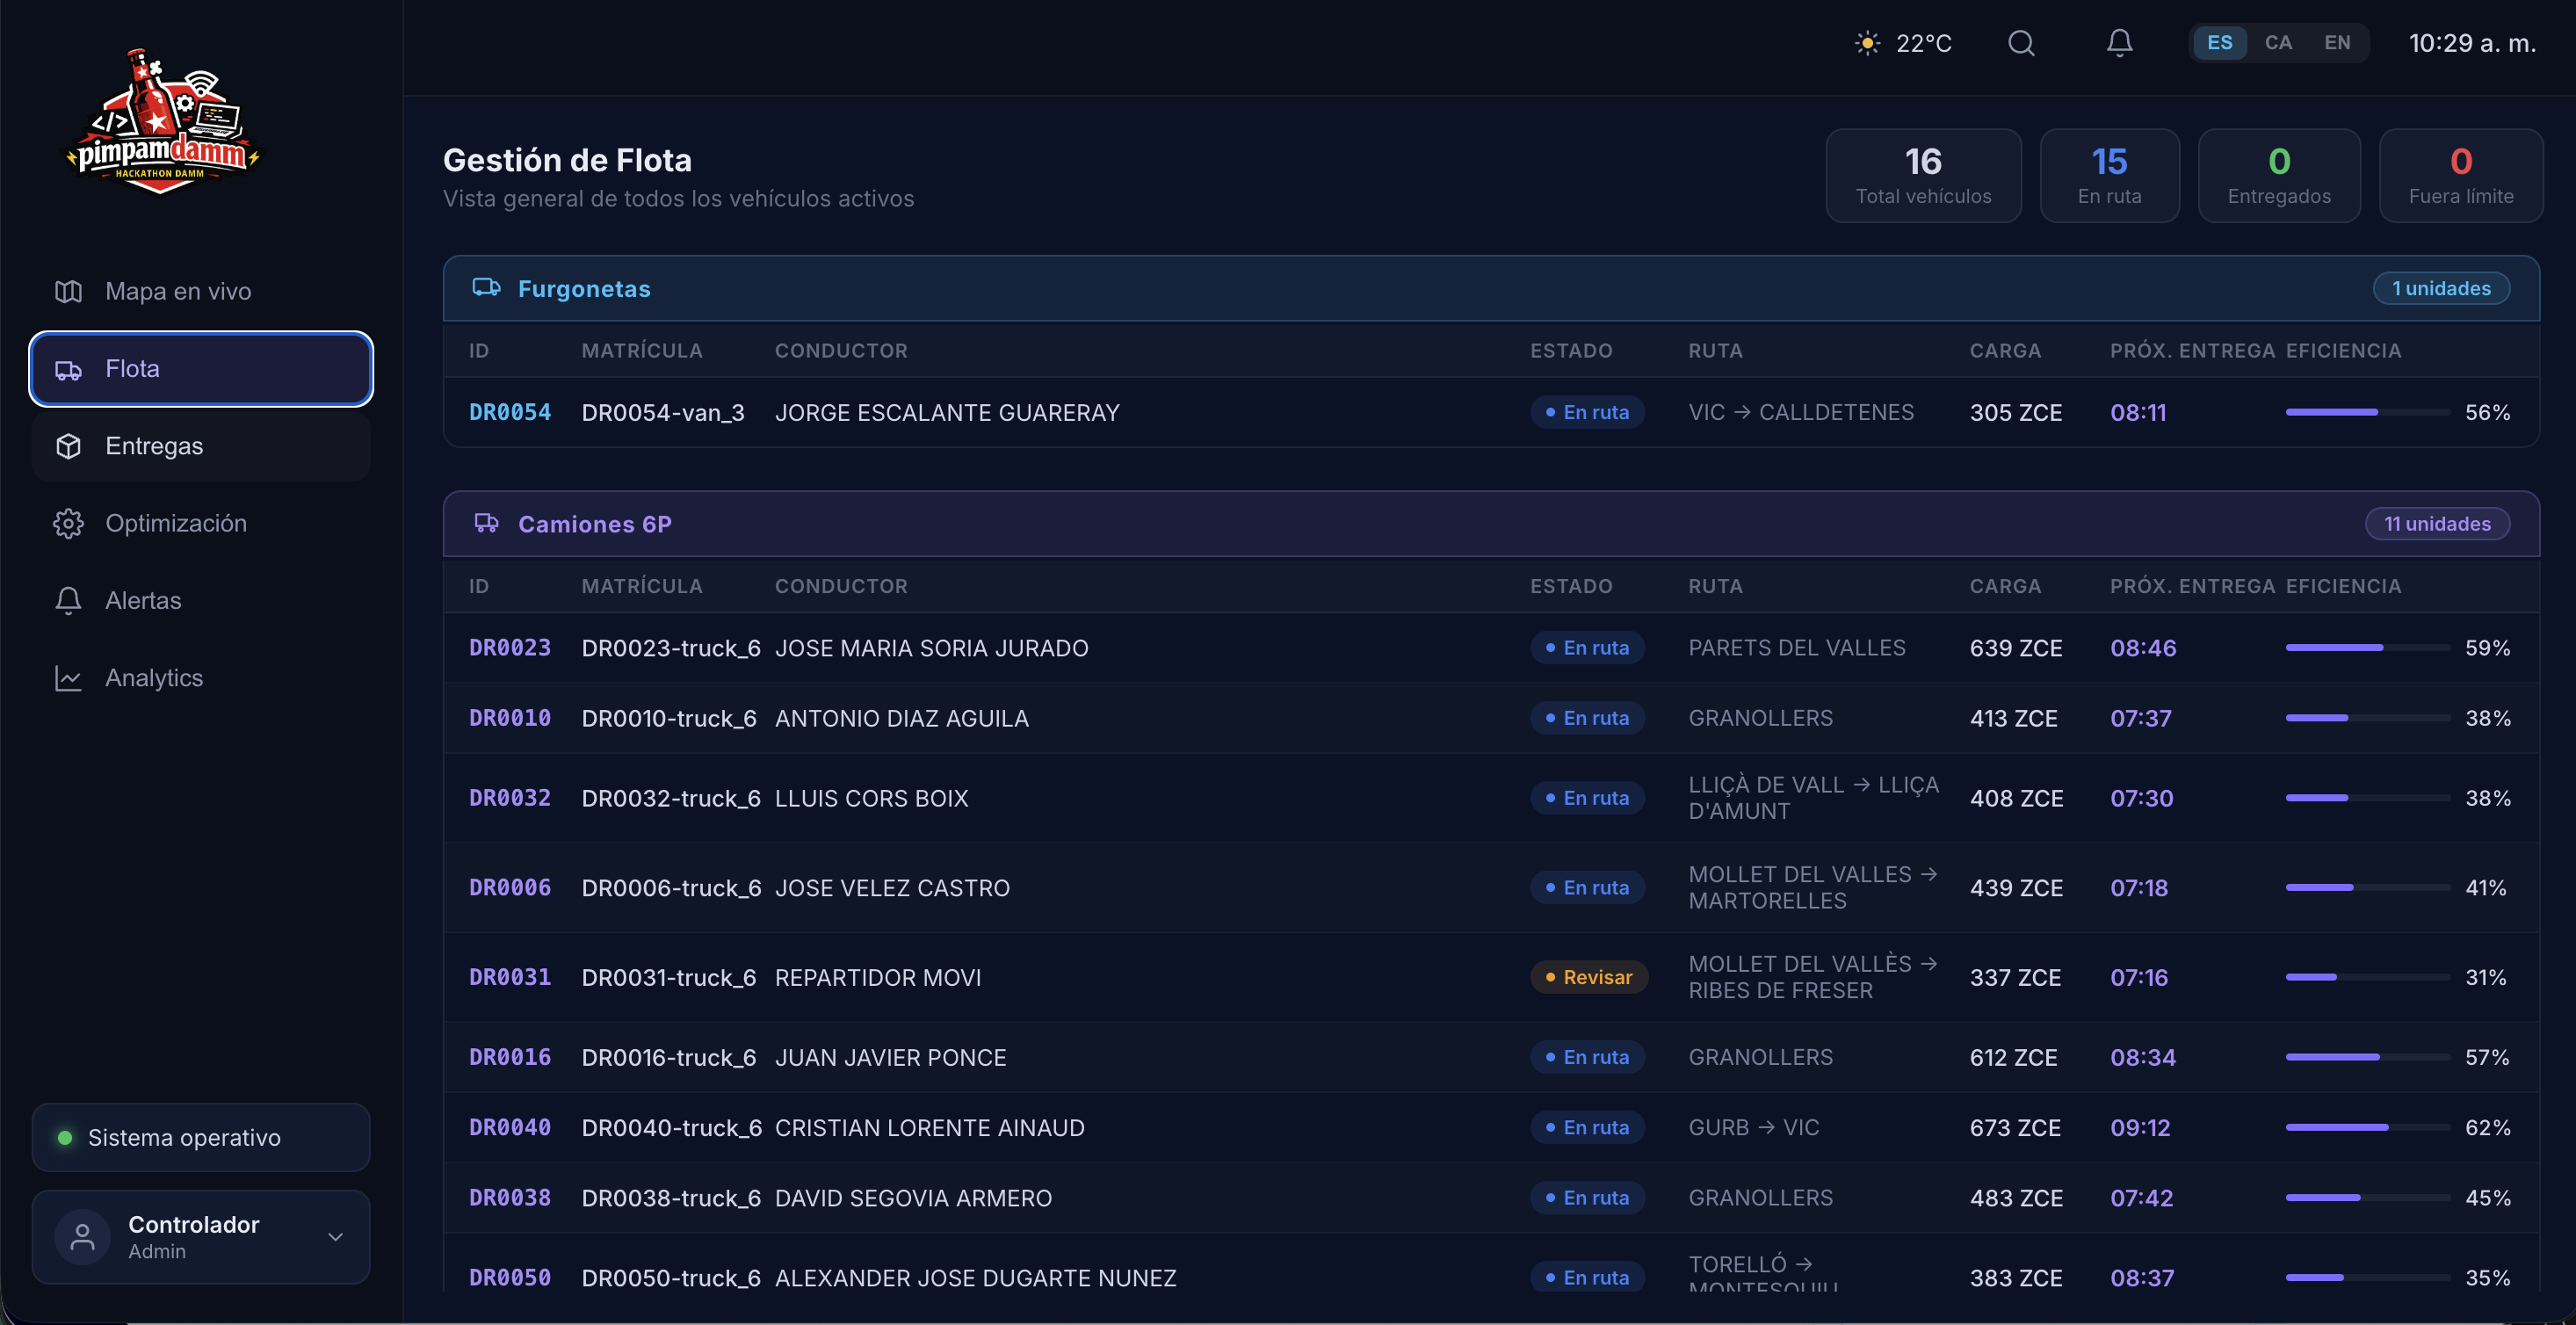
A real-time operations dashboard gives logistics managers a live view of the entire fleet:
- Live Map with animated truck icons moving along their actual planned routes. Operators can click any truck to follow it in real time.
- Voice Assistant in Spanish, Catalan, or English — ask "¿dónde está el camión DR0041?" and the map follows it automatically.
- 3D Truck Viewer that renders the bin-packing solution spatially, showing exactly where each item sits inside the vehicle by pallet slot.
- Optimization Panel where managers can re-run the VRP with different objectives and instantly compare results against the run history.
- Fleet, Deliveries, Alerts, and Analytics panels — all fed by the same optimization bundle.
- SPRO integration provides real-time visibility into urban loading and unloading zones, helping drivers identify legal stopping areas dynamically during route execution. In our optimization model, SPRO availability is incorporated as an additional routing variable to improve parking feasibility and reduce unloading friction in dense urban environments.
📱 Layer 3 — The Driver App (Flutter)
A mobile companion app for the drivers themselves. SmartTruck DDI shows each driver their stop sequence, the items to deliver at each location, and the expected load plan for their vehicle. Built in Flutter for cross-platform deployment on iOS and Android.
Tech Stack
| Layer | Technologies |
|---|---|
| Optimization engine | Python · pandas · openpyxl · FastAPI |
| Route & geocoding | OpenRouteService · Haversine |
| Dashboard | React 18 · Vite · Leaflet.js · Three.js |
| Voice assistant | Web Speech API (multilingual) |
| Driver app | Flutter · Dart · Provider |
| Data persistence | JSON bundles · Supabase |
Challenges We Faced
Real data is messy. The ERP export contained products with missing dimensions, inconsistent unit-of-measure codes (MM, M, and CM all in the same column), and warehouse location codes ranging from clean rack coordinates like AA01A1 to free-text entries like CAMARA, ENVASE, or ZCG. We built a layered dimension resolver that first tries the exact (material, UMA) key in the catalogue, falls back to the smallest known packaging variant for that material, and finally falls back to heuristic estimates based on product description keywords.
3D bin packing is NP-hard. We could not afford an exact solver within hackathon time constraints. Our layer-and-shelf heuristic gives solutions fast enough for real-time re-optimization — sub-second for a 6-pallet truck with 80+ items — while simultaneously respecting LIFO ordering, stacking classes, and two item orientations.
Routing and loading are coupled. Naively, you route first and pack second. But a customer whose items are all large barrels may be infeasible to add to an already-loaded truck even if the nominal volume fits. We introduced the dynamic margin model at the routing stage — before the expensive packing step — so the VRP can reject or split an assignment early.
Animating the live map. Making truck icons move smoothly along real road geometries at 60 fps while keeping the camera locked to a followed vehicle — without the marker "flying" during Leaflet's own flyTo animation — required careful coordination between requestAnimationFrame, Leaflet's internal _animatingZoom flag, and React refs to avoid stale closure bugs.
What We Learned
- Real logistics data messiness is the product. Defensive parsing, fallback hierarchies, and explicit unit normalization are not optional.
- A good feasibility signal computed before the optimization loop is worth more than a perfect algorithm that sometimes times out. Fail fast, fail loud, fail early.
- The gap between a working algorithm and a usable product is the UI. The 3D truck viewer and the voice assistant took a fraction of the total code but drove almost all of the demo impact.
- Hackathons are a forcing function. Three days of focused work on a real dataset produce more insight than months of abstract planning.
What's Next
- Live GPS integration: Replace the simulated truck animation with real telemetry streamed from the driver app.


Log in or sign up for Devpost to join the conversation.