-
-
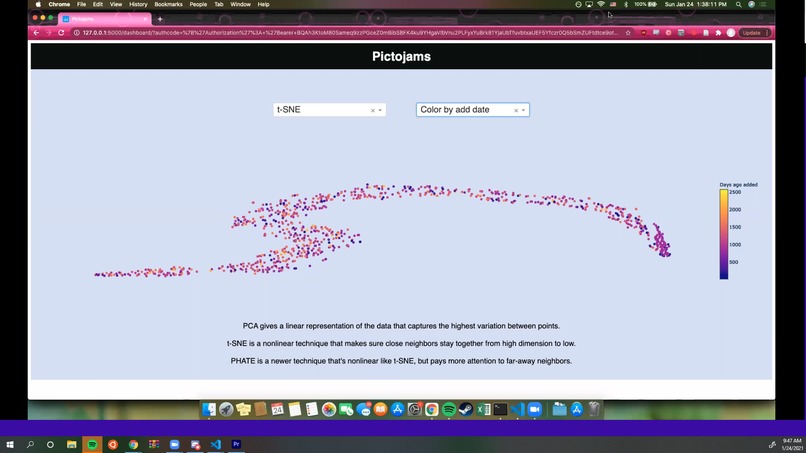
Data Visualization of Playlist

Inspiration
School is temporary, but music is forever. Whether it's listening after school, before school, or even during school, our music playlists are essential. We wanted to give the trusty playlists a twist, by experimenting with Spotify's API and creating a fun visual representation of our playlists.
How we built it
PictoJams was built mainly using Python, Flask, HTML, CSS, and Javascript, as well as integrating the Spotify API, to create the visualization of the playlists.
Challenges we ran into
The integration of the Spotify API was difficult. If it wasn't the incorrect API calls, it was improper language integration with Python and Flask, or an incorrect redirect on the page. Needless to say, we made sure to scavenge all through stack exchange, Spotify Developers, and GitHub to solve our issues.
Accomplishments that we're proud of
A clean Spotify authorization and implementation was hard fought, but successful.
What we learned
How to use the Spotify APIs, how to integrate Node.js and flask, how vectors are used in visualization, what URL parsing and variable passing looks like
What's next for PictoJams
More interactive features in the visualization, cleaning up the CSS for the visualization page, and mastering Spotify token requests and access. We hope to use The Paciello Group's Color Contrast Analyser to ensure that all interface elements meet accessible color contrast ratios and improve keyboard accessibility of the visualization.
Built With
- api
- css
- data-visualiztion
- flask
- html5
- javascript
- jquery
- machine-learning
- python
- spotify

Log in or sign up for Devpost to join the conversation.