-
-
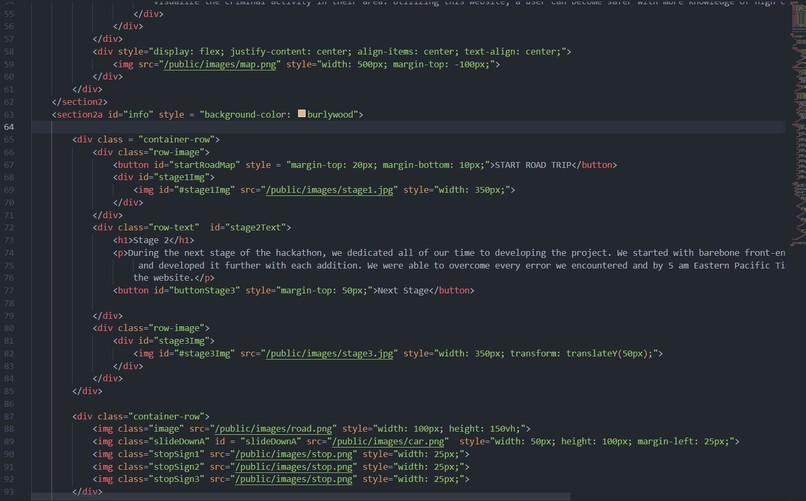
Showing the html
-
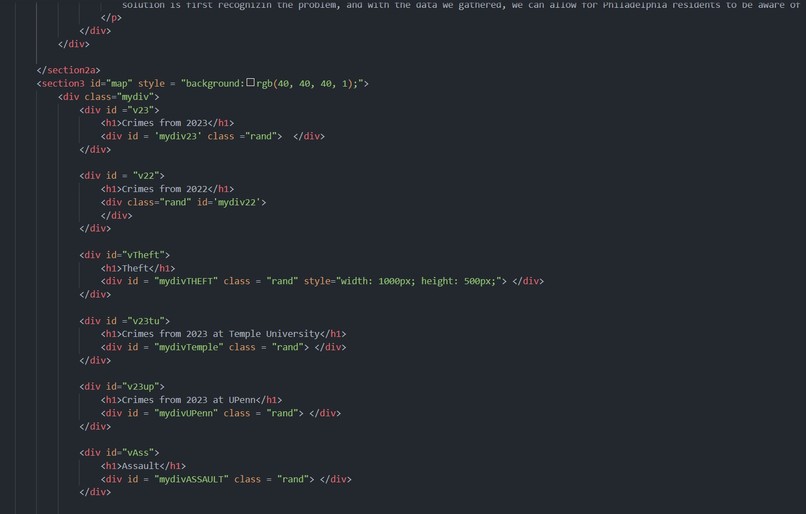
creating the map div for the individual maps
-
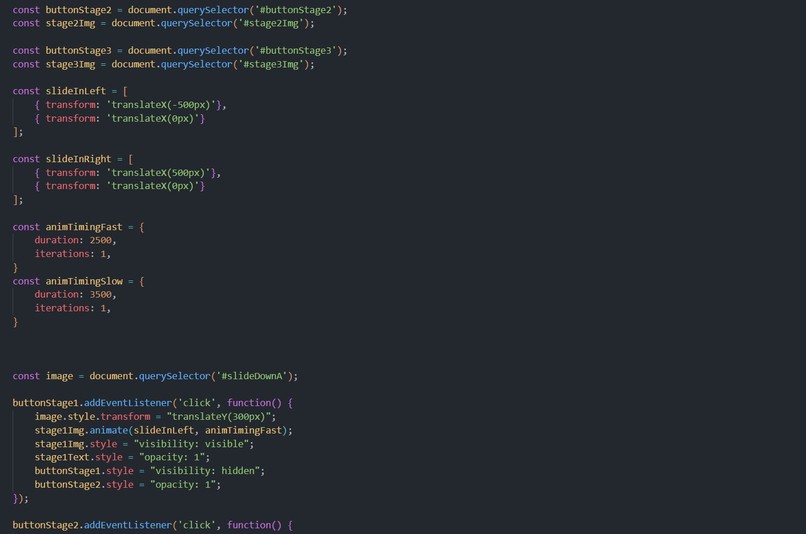
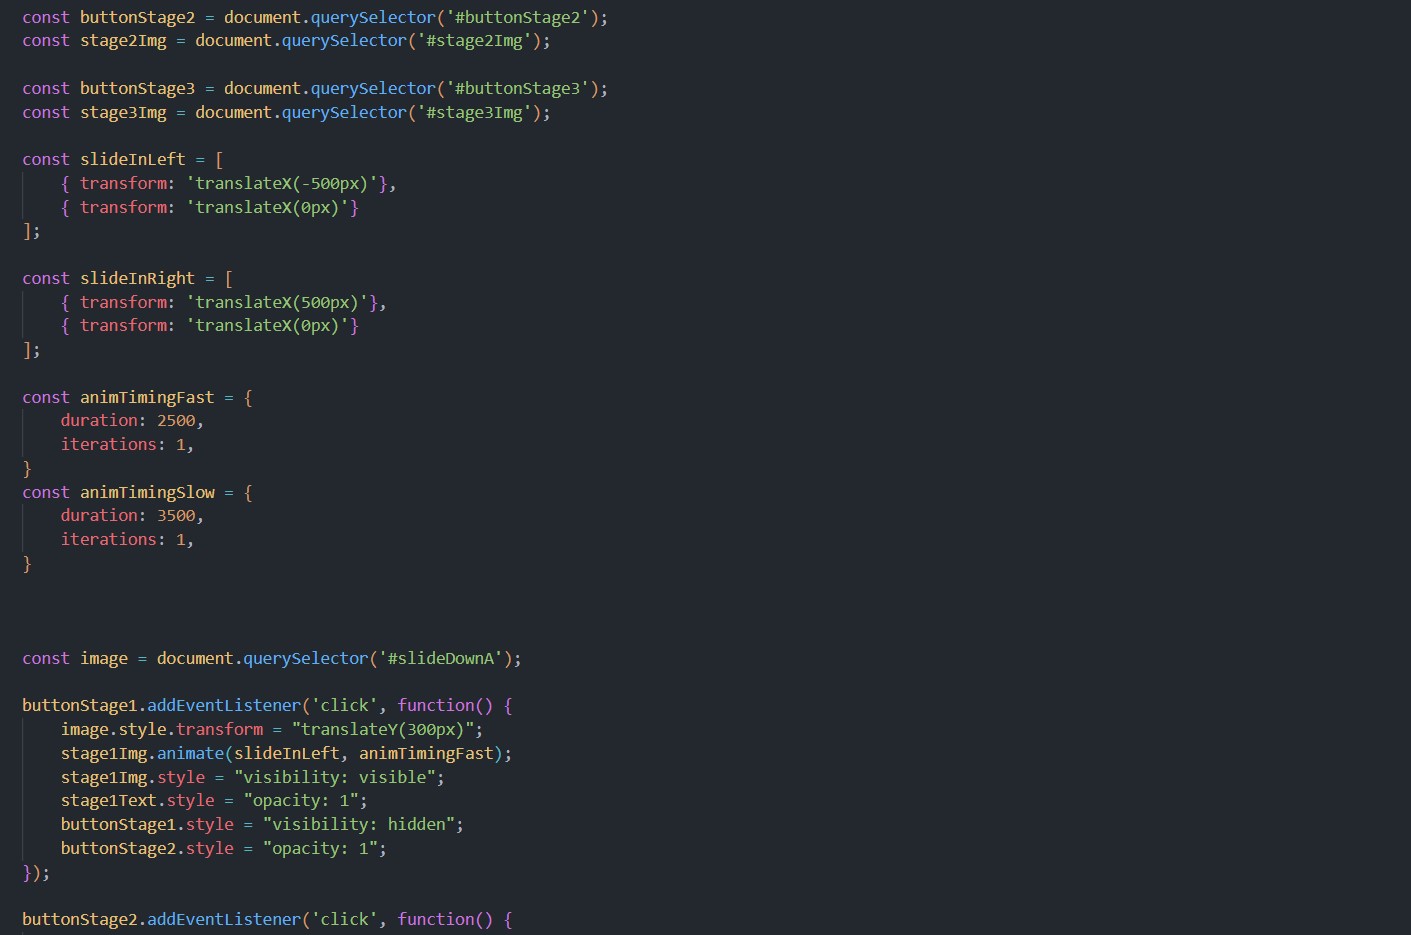
using js to animate
-

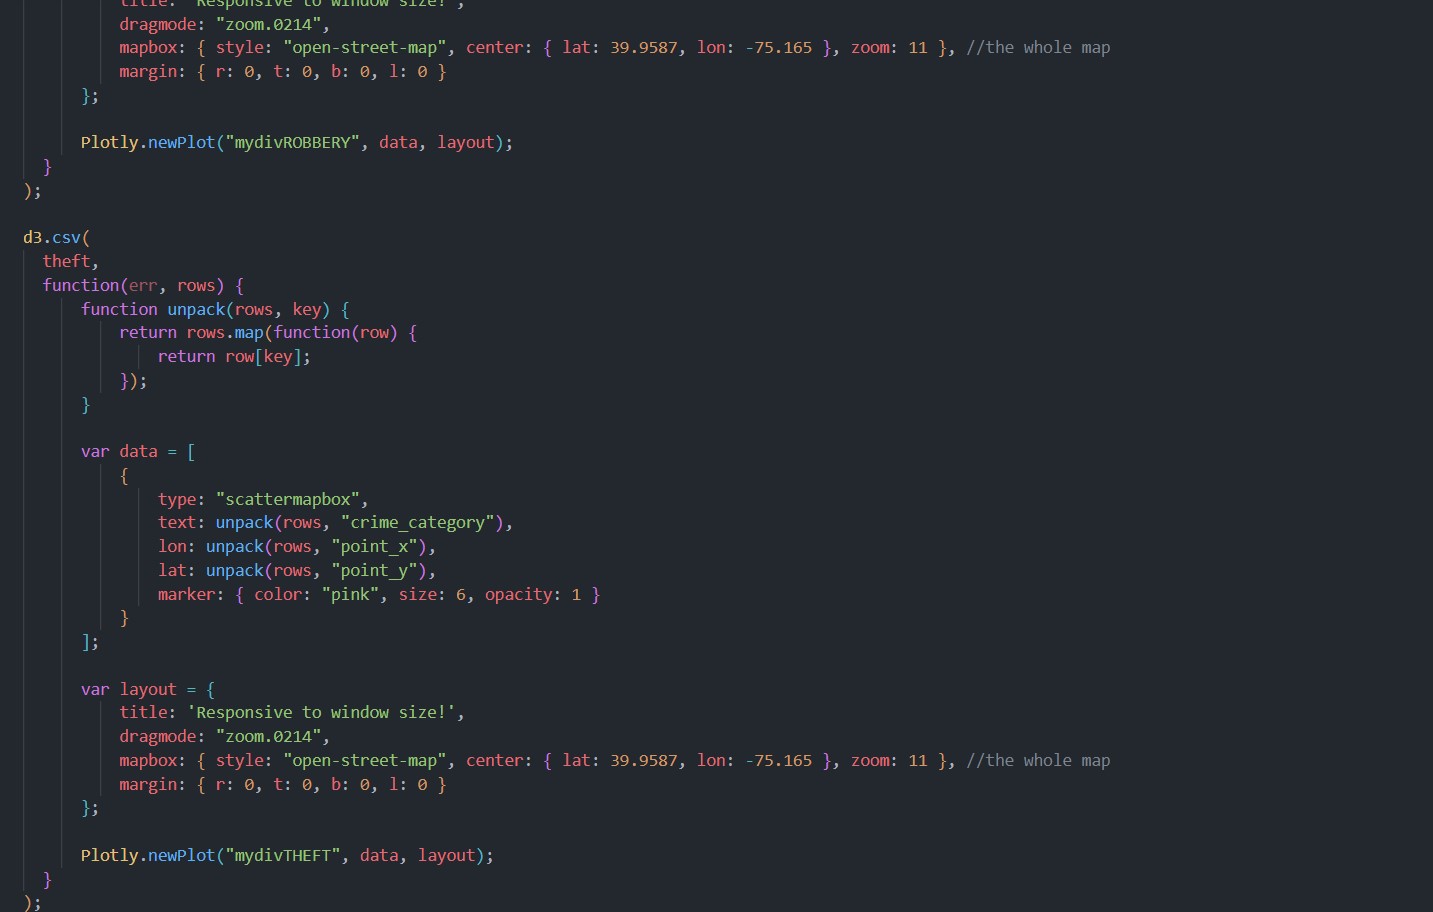
showing the js function for the maps
-
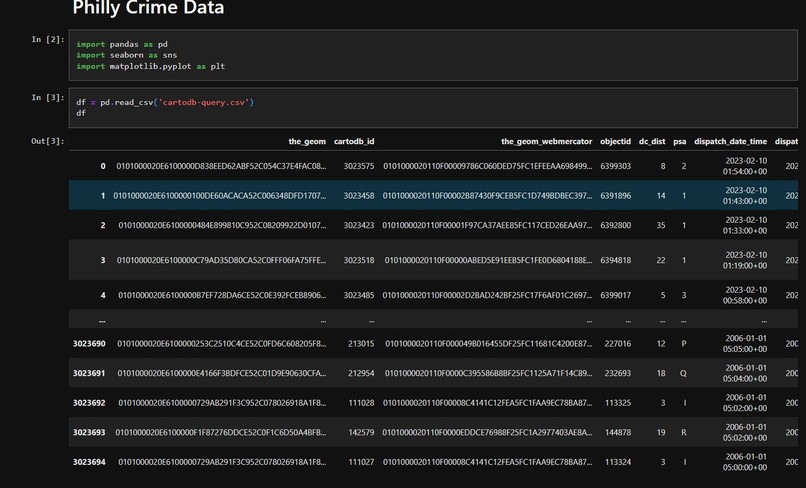
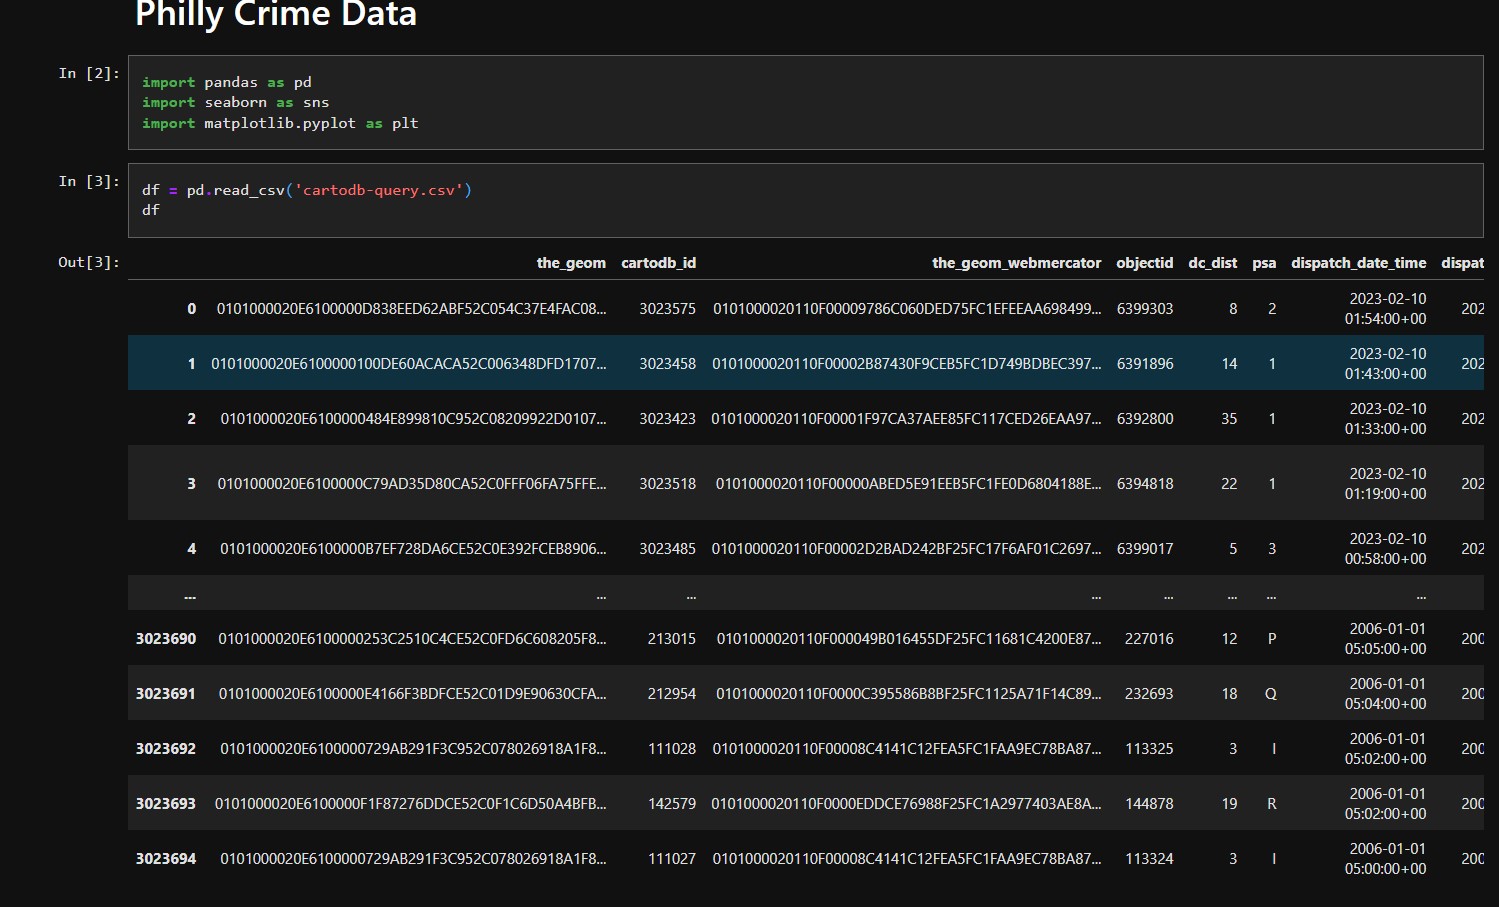
the raw data from the database
-
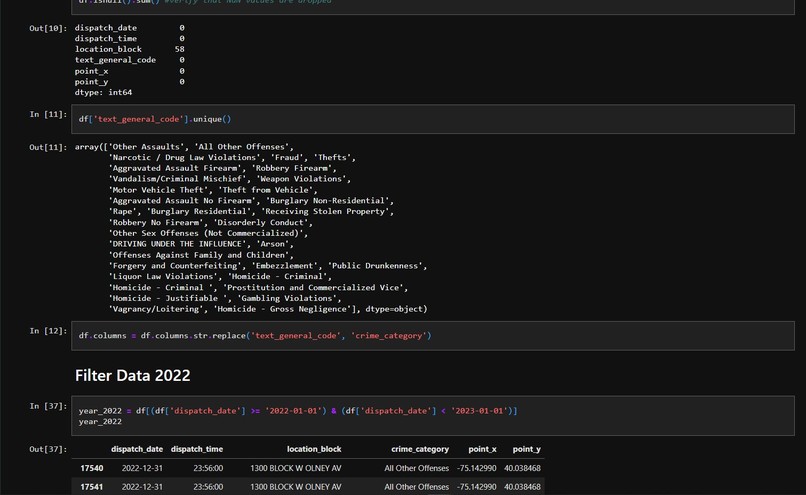
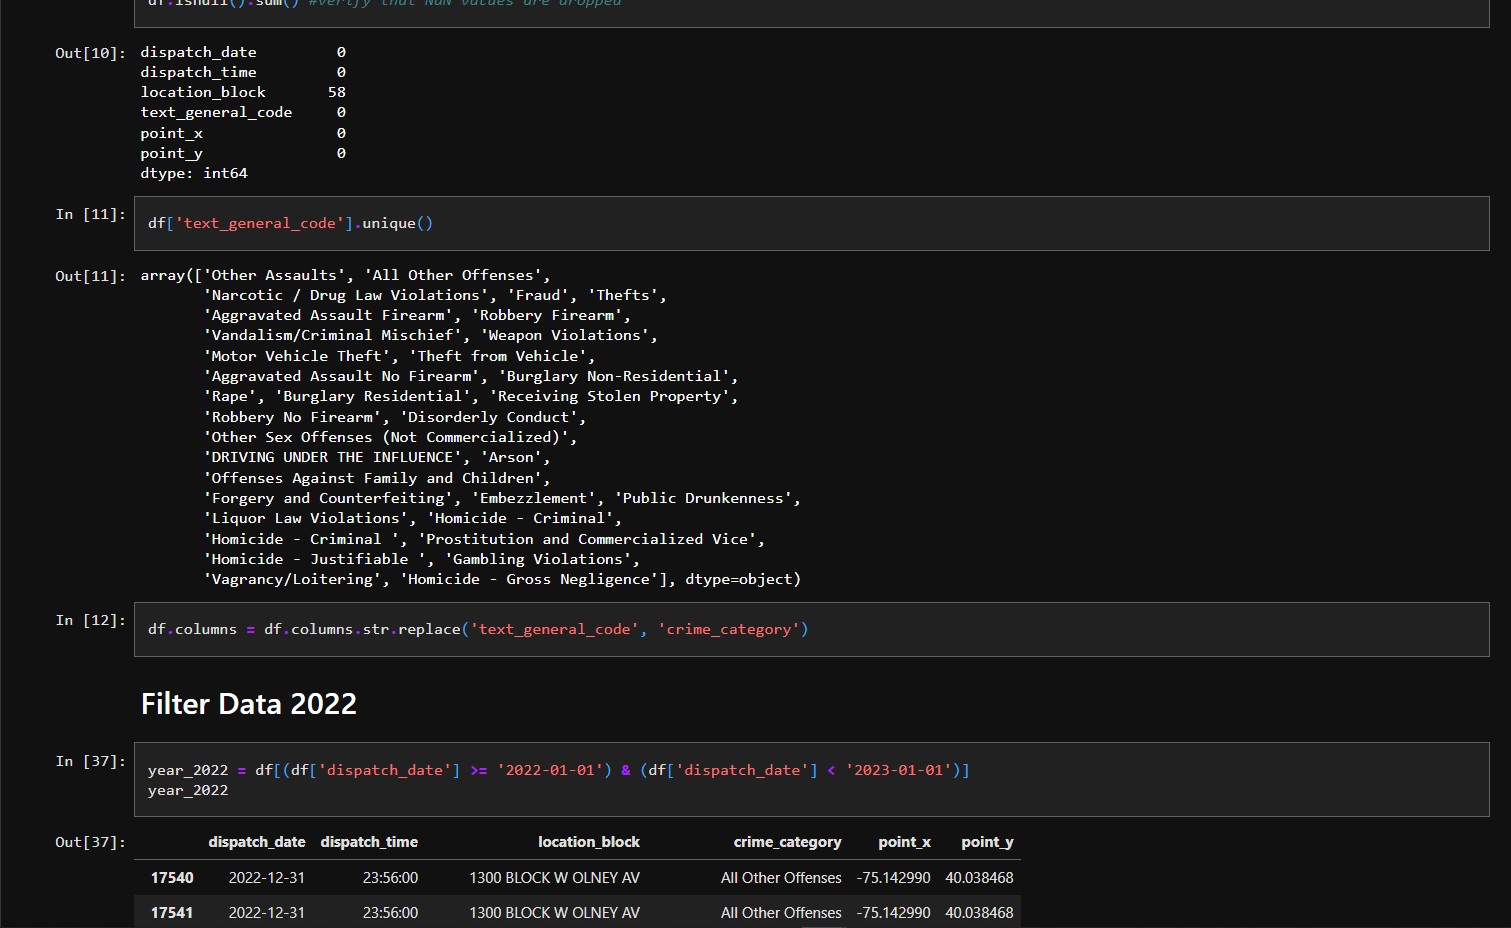
parsing and data cleaning the CSV files


Inspiration
We were inspired by the theme of sustainable communities and wanted to do a project that would benefit not just Temple students but Philadelphia residents as well. This is important to us because we want to provide a platform where everyone can use it to gain awareness for the crimes in their communities.
What it does
PhillyNow takes our visitors on a virtual “road trip” and each “stop” on our trip gives a short description of our team's journey together. We come to our destination towards the foot of our website where our project is at full display, showing the heatmaps for crimes in Philadelphia county.
How we built it
We retrieved our data in a .csv file from [https://data.phila.gov/visualizations/crime-incidents] that contained all crime reports dating back to 2006. The data was then cleaned and manipulated with Pandas in Jupyter Notebook. Then using html, javascript, and css we created the front end. We also used javascript to map the crimes onto our maps.
Challenges we ran into
We ran into some front-end issues as certain things weren’t sitting right or acting in the way we wanted. It was also difficult to find a js library that would help us build the maps that we wanted.
Accomplishments that we're proud of
The website has nice animations, as well as having interactive maps that give the specific locations of the crimes.
What we learned
Some of us did not know how to use Javascript, so it was interesting to learn a new language to implement into our project. We also gained valuable insights on how data connects with the front end to create a visual representation of crime.
What's next for PhillyNow
The website has a lot of potentials. The next step is to add a feature that allows the maps to be updated automatically as new crimes occur. As well as letting users search for crimes in a specific zip code.
Built With
- css
- html5
- javascript
- juypter
- python
- vscode

Log in or sign up for Devpost to join the conversation.