Inspiration
In 2024, a paper was published using Apple's system and Wi-Fi signals for IPhones and other apple devices to find their location, which could then be used to represent issues that arises, as those devices signals would disappear in their database. https://arxiv.org/abs/2405.14975
What it does
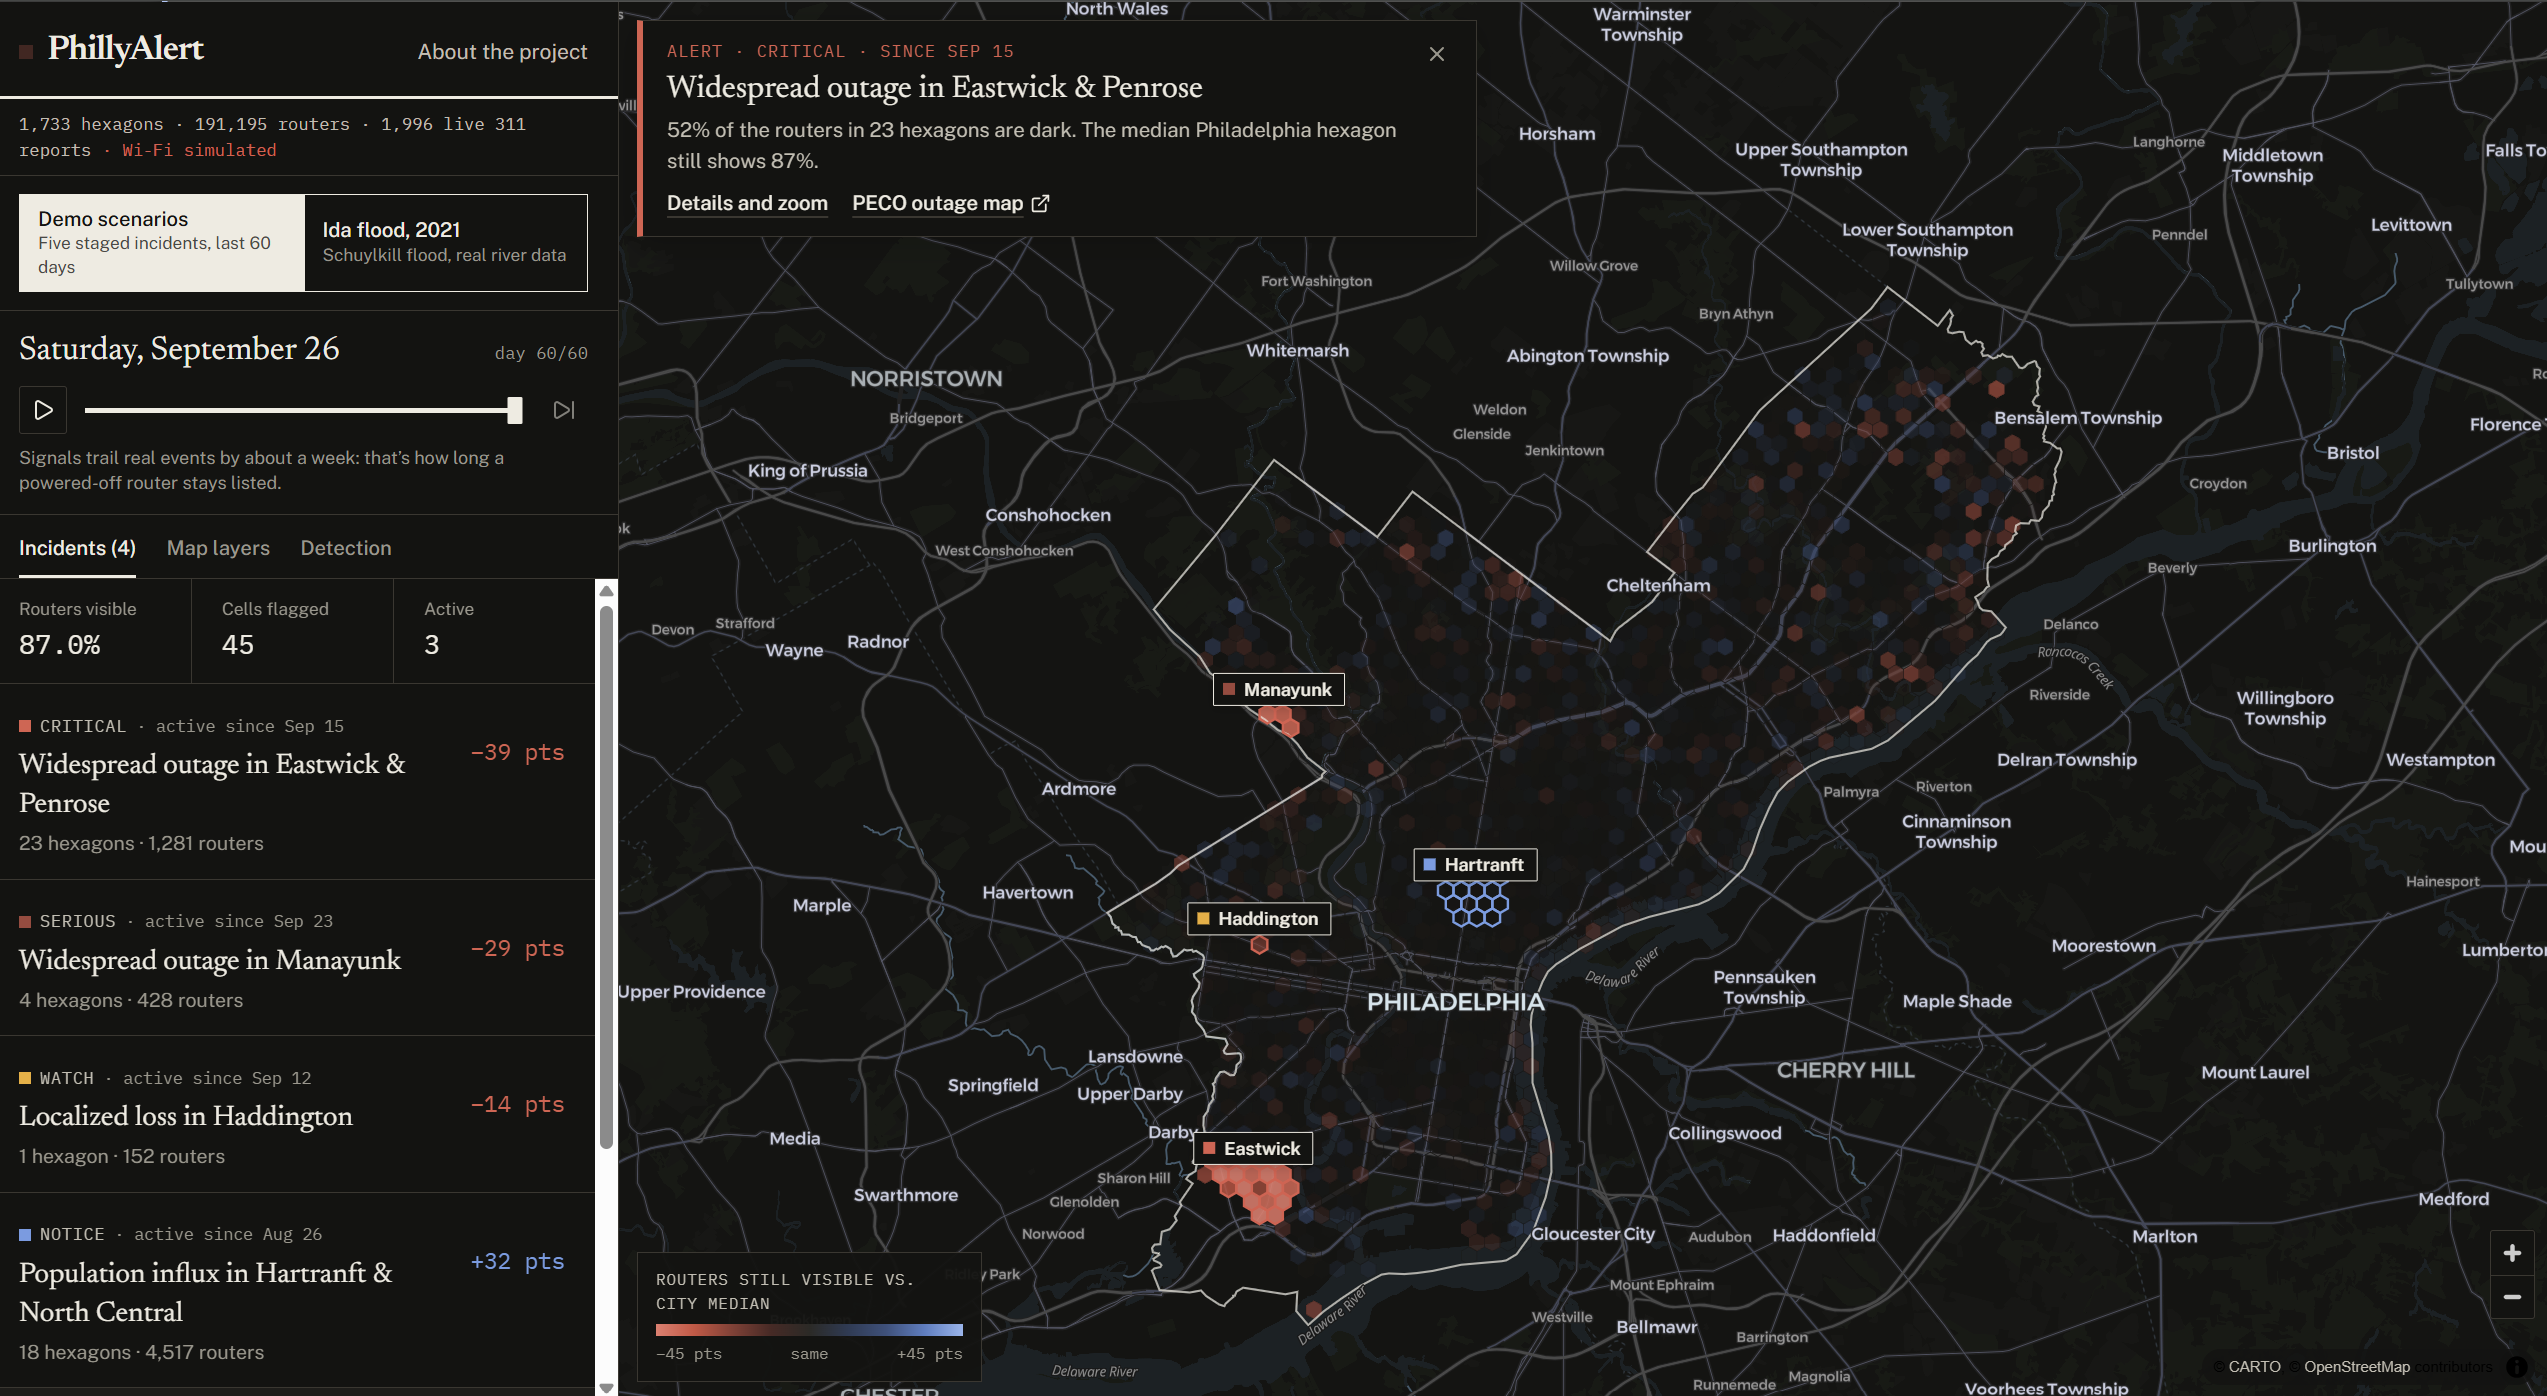
PhillyAlert divides Philadelphia into about 1,700 equal hexagons (~450 m across) and tracks two numbers per hexagon per day: how many of its original routers are still visible, and how many new ones appeared. It compares every hexagon to the city's median hexagon on the same day. When an area falls far behind, it flags it, groups neighboring flags into incidents, and classifies them into three categories:
-Widespread outage(storms, floods) or localized loss(fire, collapse, demolition) -New-router surge (move-in week, new housing) -Restored: once the area rejoins the rest of the city
Each incident gets an area-vs-city chart, the date it was first flagged, the likely start date (correcting for the ~7-day database lag), matching Philly311 infrastructure reports as a second opinion, and a copyable brief. A timeline lets you replay 60 days, and detection sliders let you see the noise floor.
There are two datasets: -Demo scenarios: a simulated city ending today, with five staged events (a storm outage that recovers, a rowhome fire, an Eastwick flood, Manayunk flooding, Temple move-in). -Ida 2021 replay: the real Schuylkill flood. River levels, 38 USGS high-water marks, the flood extent and 2021's 311 reports are all real; only the routers are reconstructed. The detector finds Manayunk and the riverside buildings at the Chestnut Street bridge and dates both to about September 1, the actual storm.
How we built it
-Data pipeline (Python + NumPy): builds the hex grid clipped to the city limits, simulates routers with Philadelphia-shaped density and the paper's measured churn (~8%/month), and outputs only per-hexagon daily counts. It can also ingest real daily observations. -Ida replay example: Used USGS river gauge (15-minute readings), NWS flood stages and the USGS high-water marks surveyed after Ida. Interpolated the water surface between the marks and compared it with USGS 1‑meter elevation data. We then removed river surface using OpenStreetMap, kept only flooded ground connected to the river, and used the City's building footprints so routers only go dark in flooded buildings, not parks or rail yards. -Detection: a size-weighted median control group, binomial and Poisson significance tests, connected-component grouping, and day-to-day incident tracking. It runs client-side, so the sliders re-run it instantly. -Frontend: React, TypeScript, Vite, Tailwind and shadcn/ui, with MapLibre GL for the map, and live 311 data from the City's OpenDataPhilly (Carto) API.
Challenges we ran into
-There's no legitimate public Wi‑Fi churn data. The research paper that mass-querying Apple's database, is the attack the paper warns about and likely violates Apple's terms. -That's why the demo is simulated and the Ida replay reconstructs routers from real flood data instead. -Making the flood footprint honest. Our first version counted flooded land, which flagged rail yards, highways and parkland as places full of routers. Weighting by building footprints, requiring the water to connect to the river, and clipping to the city limits fixed it. We checked the result against the USGS survey data: where marks recorded both water level and depth, the ground they implied matched the elevation data to within about 0.2 m. -The one-week lag as positioning databases take days to forget a router, so signals trail events. Short power blips never show up at all.
Accomplishments that we're proud of
- An end-to-end detector that dates a real 2021 flood to within a day, using nothing but the router signal and the known lag.
- A flood extent built entirely from public government measurements and checked against the USGS survey.
- Privacy: only per-hexagon counts ever leave the pipeline, hexagons with fewer than 25 routers are hidden, opted-out (
_nomap) and randomized addresses are dropped, and router IDs are scrambled with a key that's thrown away after each run.
What I learned
- The same dataset can be surveillance or public good depending on the design decisions.
- Comparing against a control group (the city's median hexagon) beats fixed thresholds, because citywide drift of routers cancels out.
- 311 is a great second opinion for small problems, but a poor detector of disasters.
- Public government data (USGS, NWS, OpenDataPhilly) is incredibly useful.
What's next for PhillyAlert
- **Real router data, collected legitimately: Using something like WiGLE's crowdsourced database or Apple's with permission, to collect routes for real day-to-day churn, and partnerships with networks that already know when their access points are up, such as Temple ITS, the Free Library and city Wi‑Fi. -Alerts for neighborhood groups and city agencies when an area in their district is flagged.

Log in or sign up for Devpost to join the conversation.