-
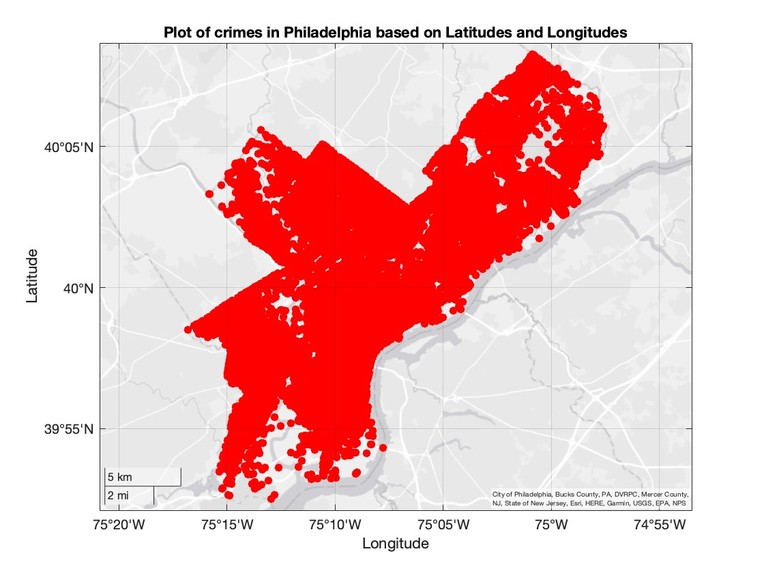
Imposed map of criminal activities in Philadelphia from 2020 to 2023
-

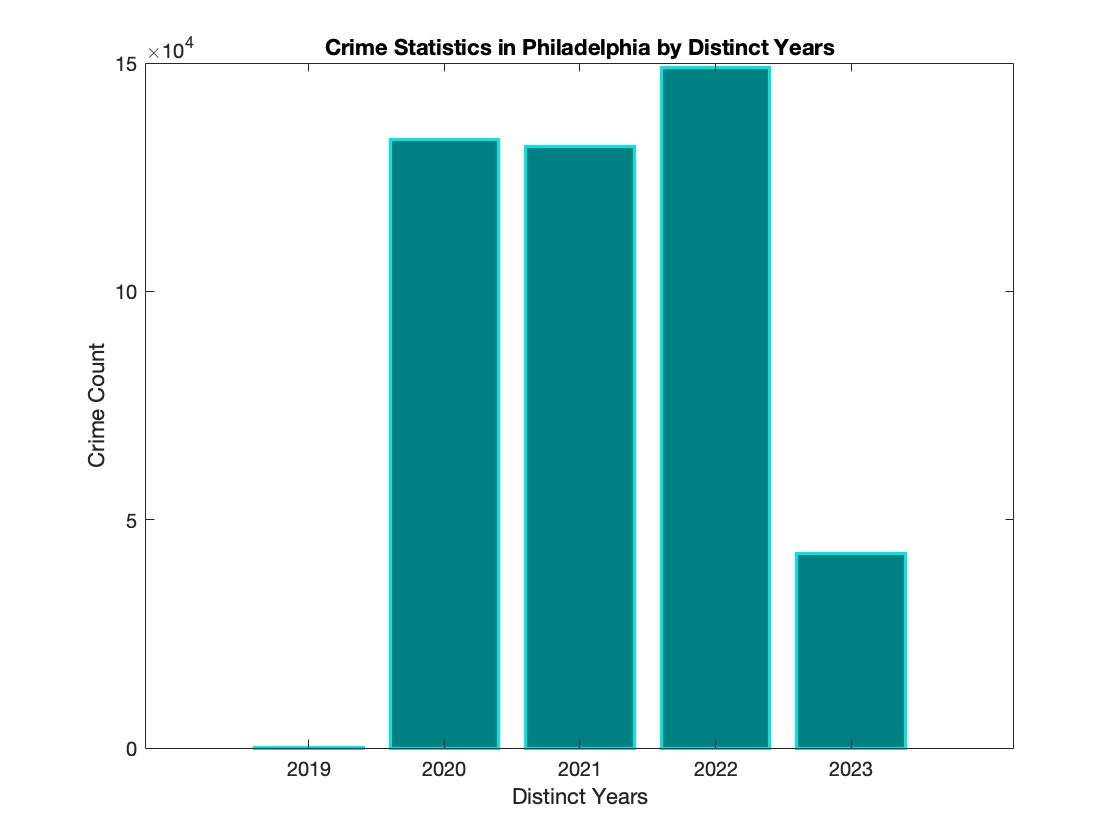
Bar graph of number of crimes committed each year
-
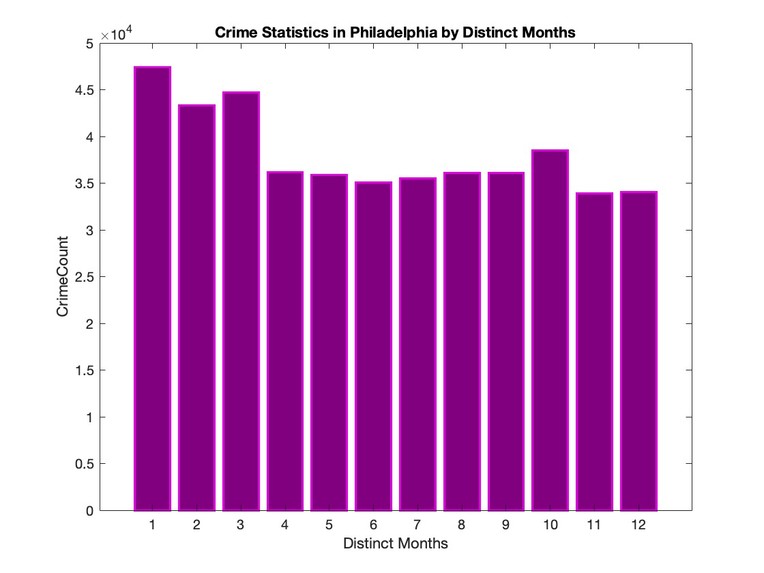
Bar graph of number of crimes committed each month (To determine any visible trend)
-
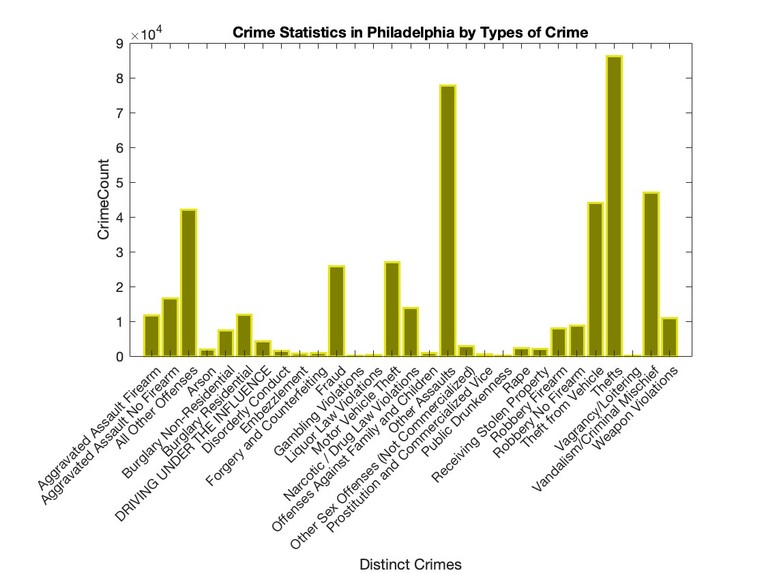
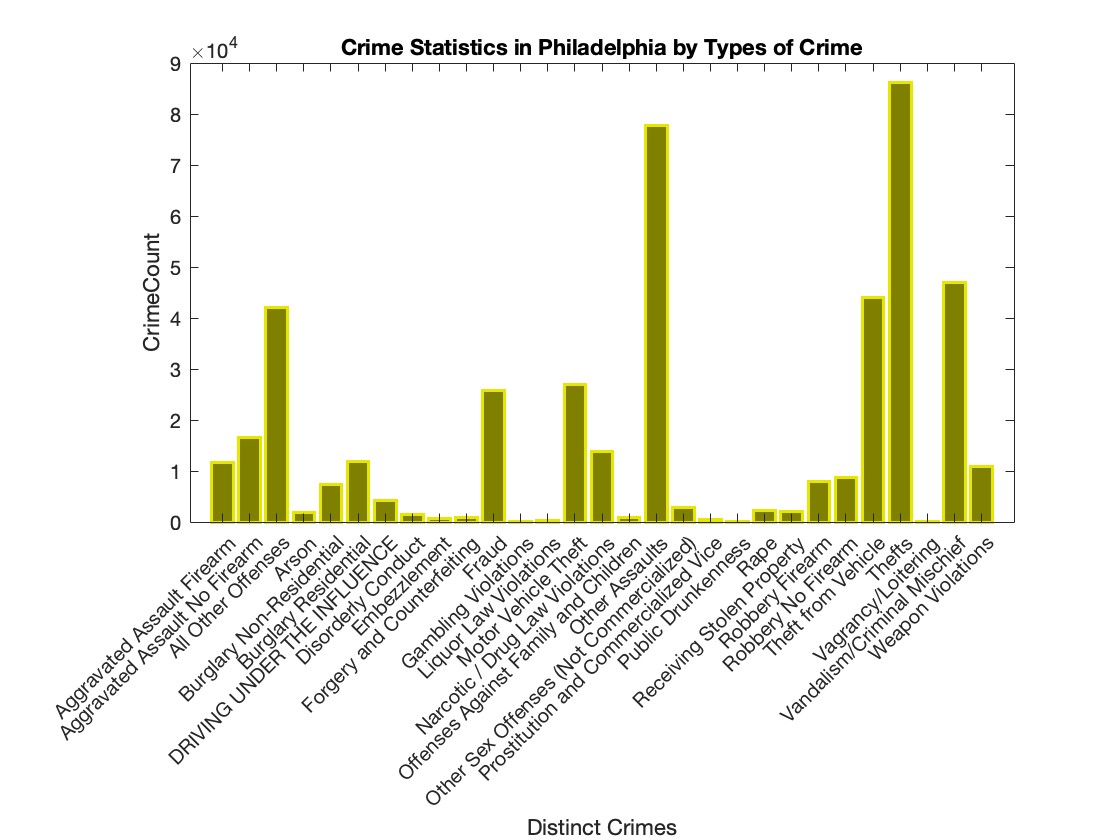
Bar graph of number of crimes committed for each crime type
-
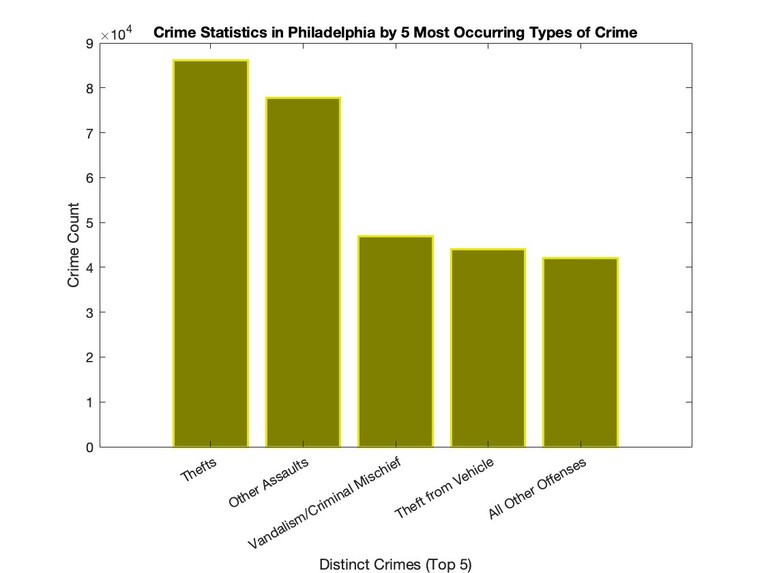
Bar graph of number of crimes committed for the most occurring 5 crime types
-
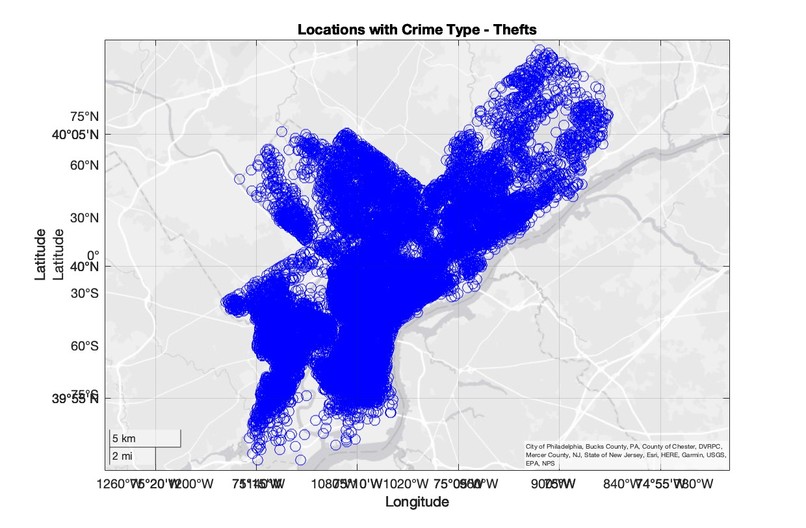
Imposed scatter plot for "theft" crimes committed around Philly in the past 4 years
-
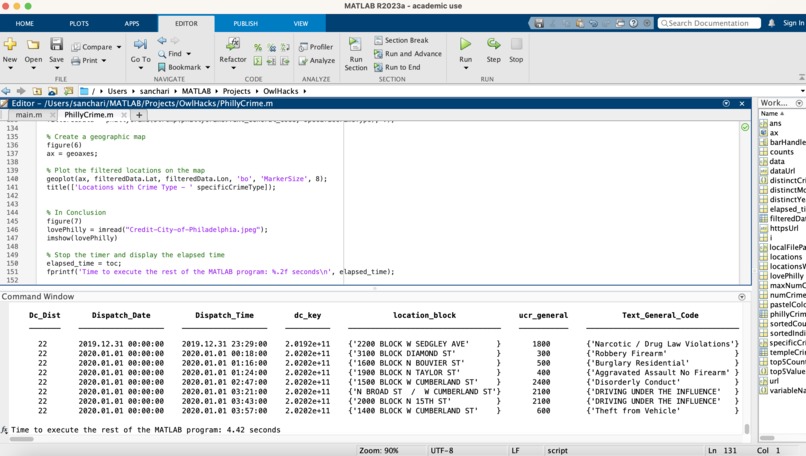
Screenshot of MATLAB console running my algorithm and displaying results and time taken
-

In Conclusion: I love Philly and Temple, and hoping to contribute my bit to making it a safer place


Inspiration
Since my journey began at Temple University in Philadelphia, safety has always been the word of mention by my family, my professors, and my friends - basically everyone around me. With advancements in technology around smart cities, the progress in terms of safety is bifold. On one hand we have apps and automated devices making decisions for us, considering every possible scenario. On the other hand, this same dependency on devices could compromise privacy and security of individuals if improperly handled. Every city, however smart it becomes, ultimately gets its existence from the residences, whose safety is of utmost priority. And only then can we solve issues when we know why and how they exist. My project aggregates and cleans collected rustic data and extracts and visualizes the pertinent information needed to make an informed decision.
As for my choice of MATLAB, it's a tool I first encountered in 2010, and though I haven't used it extensively since then, its versatility and sheer potential have always captivated me. Now, I'm excited to harness the power of MATLAB to address a critical issue and make a positive impact in our community.
What it does
My project addresses the concerning surge in crime rates in Philadelphia, a particularly pertinent issue for Temple University students who regularly receive safety alerts. To effectively combat this rising trend, comprehensive information is crucial. Recognizing that visuals convey information more effectively, my project creates a comprehensive dataset of Philadelphia crime activities from 2020 to 2023 comprising of a whopping 456,683 records, applies rigorous data cleaning techniques to refine and prepare the data, and subsequently employs MATLAB as the primary tool for insightful data visualization. The aim is not only to present crucial information but also to demonstrate the formidable capabilities of MATLAB in handling large data, extending its prowess beyond traditional statistical operations. This project offers a compelling narrative by showcasing how MATLAB can be a powerful and versatile choice for data analysis and visualization, particularly in a domain dominated by other tools like Pandas in Python.
How I built it
Back in 2010, I had my first taste of MATLAB during a single semester, leaving a lasting impression of its remarkable versatility. Since then, I've eagerly awaited an opportunity to revisit it. For this project, I scoured numerous datasets until I uncovered the ideal gem within Open Data Philly's public safety information datasets—an extensive Crime Incidents dataset comprising 456,683 records just in the past four years. Leveraging MATLAB, I meticulously performed comprehensive data cleansing and preprocessing. In contrast to the more widespread use of Pandas, MATLAB's commands, in my eyes, offer enhanced readability and structured workflows. I then embarked on a journey of visualization, dissecting crime rates by year, exploring monthly trends, and categorizing crime activities. Furthermore, I charted some of the most crime-prone locations onto a geo-map for added context. Looking forward, given more time, my ambitions extend to the realm of predictive analytics, where linear regression models (or other fitting methodologies) could foresee future crime rate escalations in the absence of proactive measures.
Challenges I ran into
The most prominent challenge I encountered revolved around the availability of learning resources. While there's a wealth of reference materials for data mining with Python, MATLAB lacks a similarly abundant set of resources in specific data mining areas. Consequently, I had to embark on the exhilarating yet demanding journey of coding the entire project from the ground up. At times, I yearned for a collaborative brainstorming partner and an extra set of eyes, but the lack of available team members left me to tackle the project solo. As a first-time hackathon participant, I would have preferred the support of a team. From a technical perspective, I also grappled with GitHub's file size limitations, which necessitated compressing my dataset for users to unzip—whereas I would have preferred a more seamless "plug-and-play" approach.
Accomplishments that I'm proud of
Participating in my inaugural hackathon, I come from a non-software background with coursework rooted in networks and protocols. Venturing into the realm of data mining presented a personal challenge, yet a rewarding one. Overcoming uncertainties and diving into implementing data mining and visualizations with MATLAB felt like a significant achievement. Throughout the past 24 hours, I tackled challenges, both major and minor, through self-guided learning. This project and hackathon experience have unveiled my strengths in core programming, an uncharted territory until now. Witnessing my program successfully execute its intended tasks fills me with pride. Knowing it has the potential to greatly benefit my neighborhood and extend its impact to other communities amplifies this sense of accomplishment.
What I learned
This hackathon has been a profound learning experience for me. It has illuminated the fact that we possess the ability to devise solutions for the issues that surround us, regardless of their scale. I've come to understand that the true potential of someone or something remains hidden until given an opportunity to shine. I've gained insights into the importance of crafting a well-thought-out plan, diligently following it, while remaining open to adjustments when unexpected challenges arise. My unwavering commitment to addressing the core problem and contributing to societal betterment has been reinforced. Above all, I've discovered a deep affection for Philadelphia and a profound willingness to actively engage in addressing its challenges, even if it means making a modest yet meaningful impact.
What's next for Philly CrimeScape: A MATLAB Story
The next phases of "Philly CrimeScape: A Matlab Story" involve a dual approach:
Predictive Analysis: My goal is to delve into predictive analysis for future crime occurrences within a specific region. This will be based on trends observed in that region during past months.
Scaling Beyond Philly: Additionally, I aspire to extend this algorithm's application to other cities across the nation, contributing to a broader understanding of crime patterns and trends.
Steps to Run
Download the repository on your local system.
Unzip the file phillyLatestCrime.csv.zip to get the csv file phillyLatestCrime.csv in the same folder location as the rest of the repo.
Run the Matlab program PhillyCrime.m on Matlab.
Execution Time of Program
- Time to read full csv file to table of 456,683 records: 3.94 seconds
- Time to execute the rest of the MATLAB program: 4.42 seconds


Log in or sign up for Devpost to join the conversation.