-
-

Homepage
TLDR
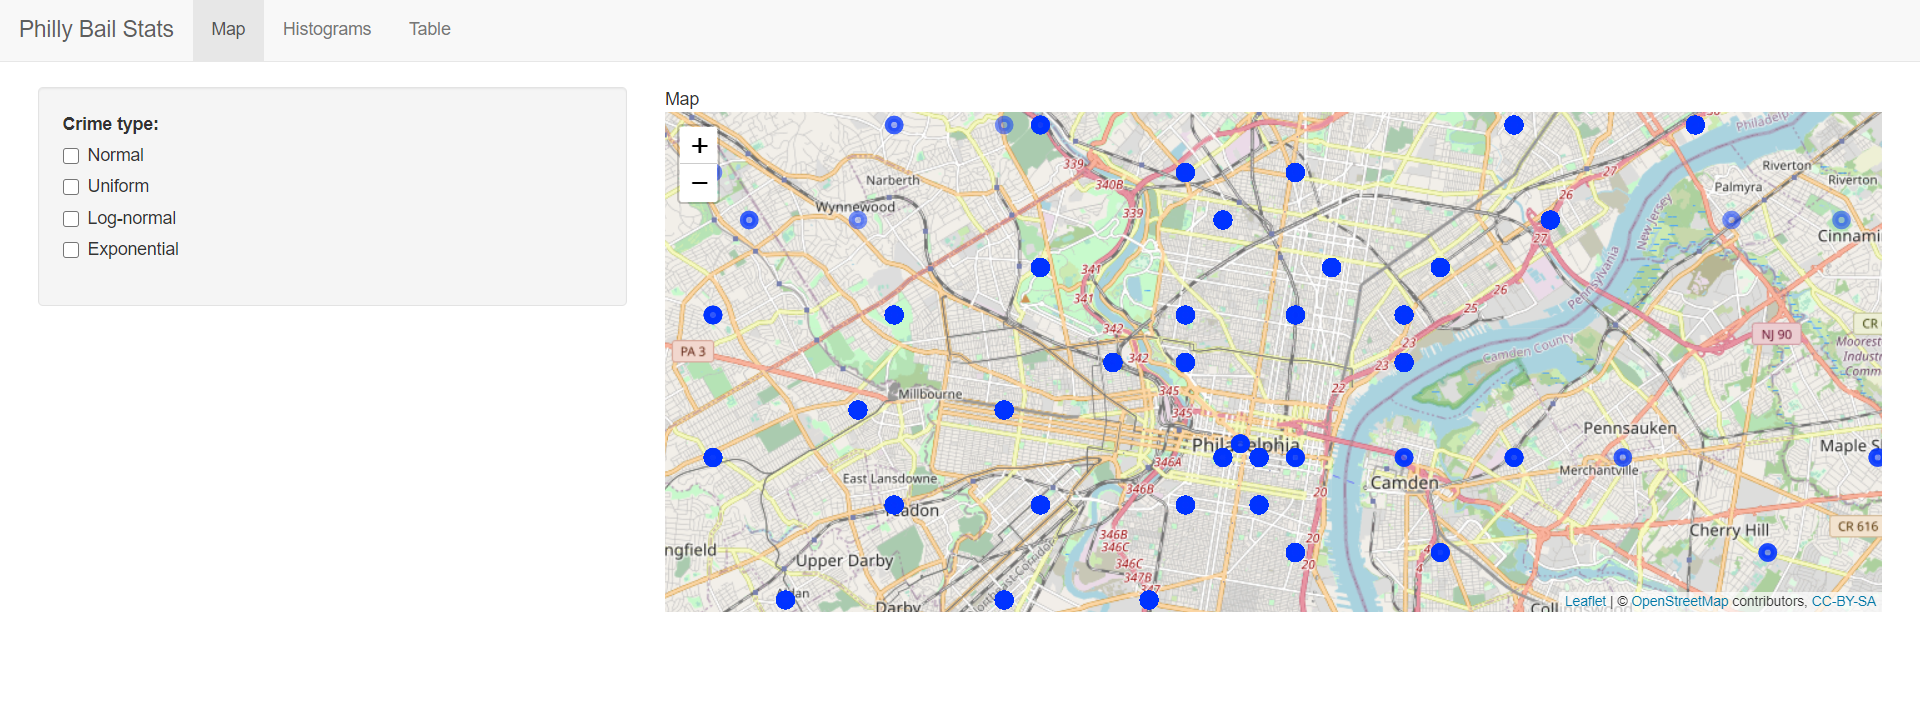
We performed EDA on a dataset provided by the Philadelphia Bail Fund. Our results are deployed as a R Shiny application. Our process is viewable as a Google Colab Notebook.
Inspiration
Our team was interested in doing a data science related project using Pandas or R, so the Philadelphia Bail Fund's challenge provided us with the perfect opportunity to flex our EDA muscles.
Process
We wanted to generate insights from bail data so we split into two groups. One group focused on cleaning the all.csv file provided. Mainly we were interested in extracting how many felonies, misdemeanors and summaries were committed by each subject. Our other group worked on generating visual representation of our parsed dataset. To graph and deploy rapidly, we opted to use R Shiny, which allowed us to quickly deploy our visualizations in R as an interactive web app.
Challenges
We are fairly novice data scientists, and we found that our data science toolsets did not have much overlap. This, alongside remote work, made even EDA really challenging.
What's Next?
If time permits, we would be thrilled to work with CodeForPhilly to continue generating insights from bail data.

Log in or sign up for Devpost to join the conversation.