-
-
home page
-
home page
-
home page
-
home page
-
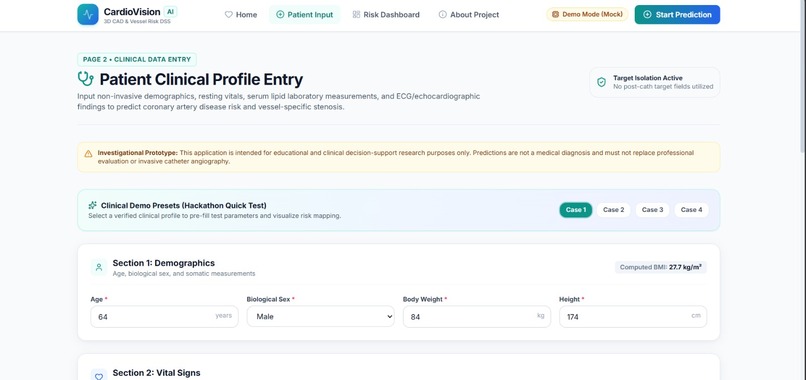
patient input
-
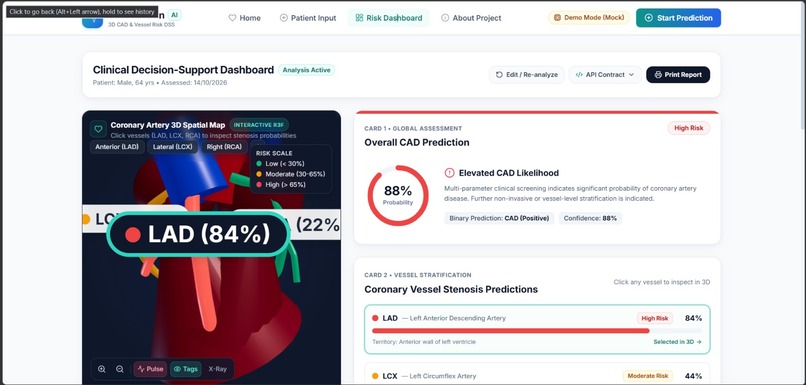
risk dashboard
-
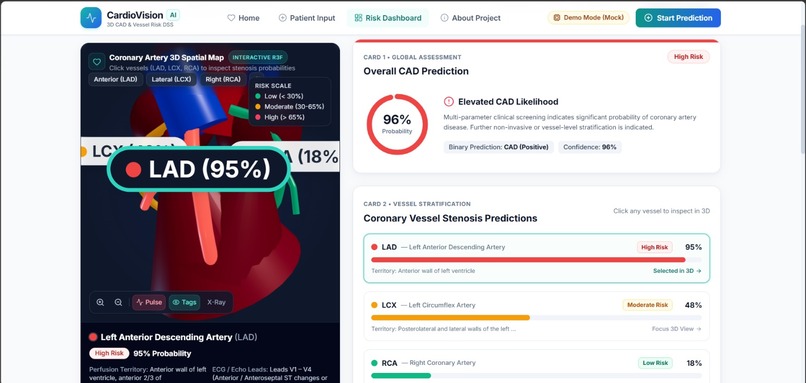
risk dashboard
-
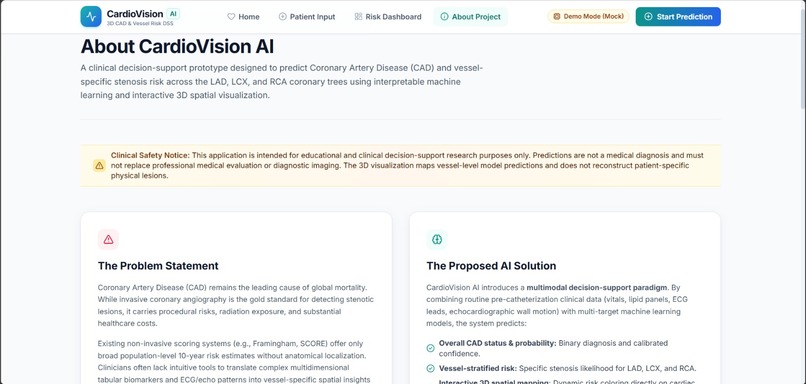
about project
Inspiration
Cardiovascular diseases are among the leading causes of death worldwide. Early identification of coronary artery disease (CAD) can help healthcare professionals make better-informed decisions. However, traditional risk prediction systems often present results as numerical scores, making them difficult for patients and non-specialists to interpret.
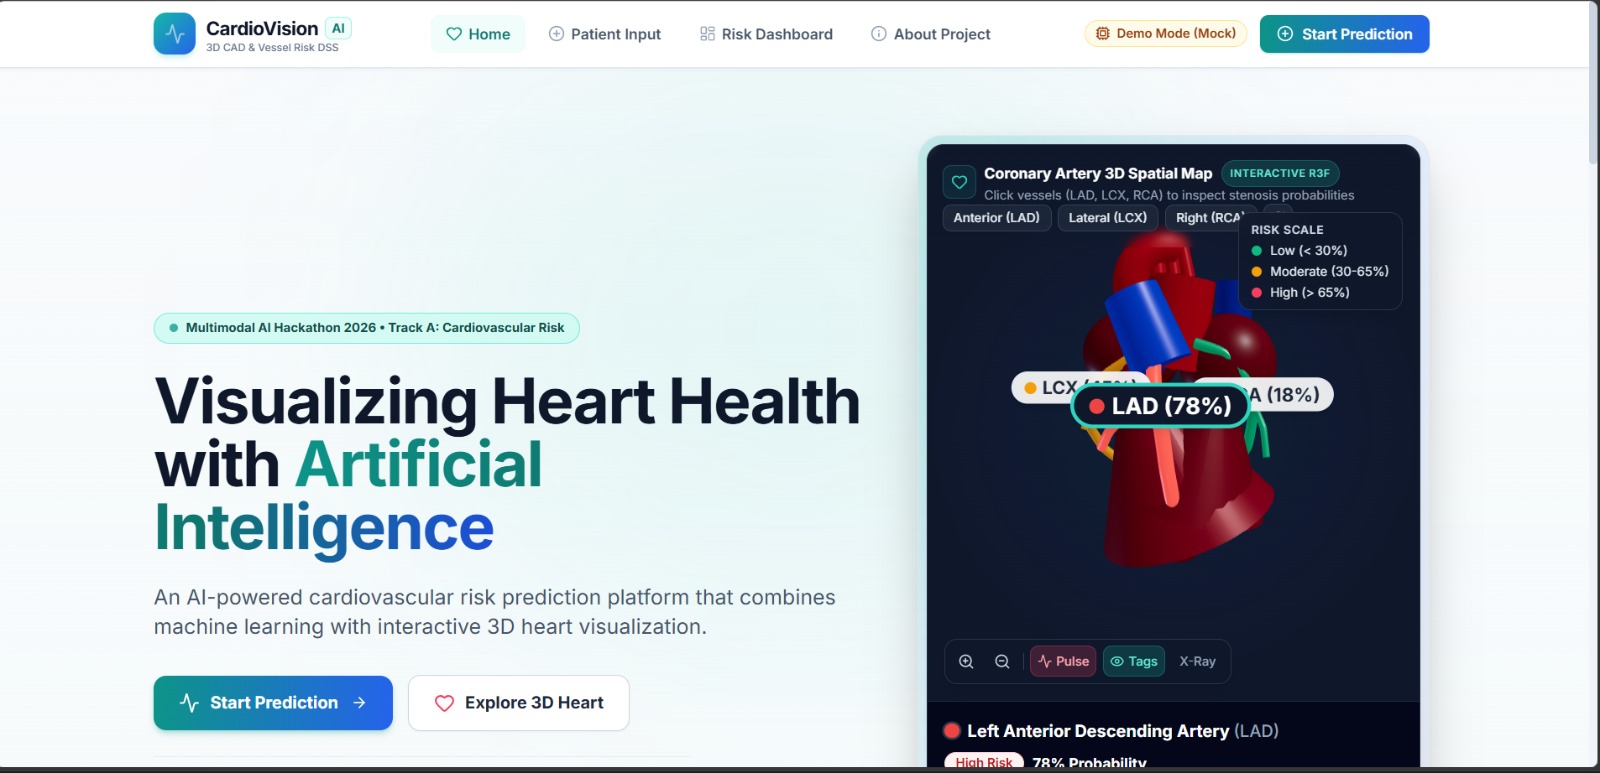
This inspired us to develop Pheonix — CardioVision AI, an intelligent cardiovascular risk prediction and visualization platform that combines Machine Learning, Explainable AI, and interactive 3D visualization.
Our vision is to transform complex clinical data into meaningful visual insights, making cardiovascular risk assessment more accessible, understandable, and interactive.
What it does
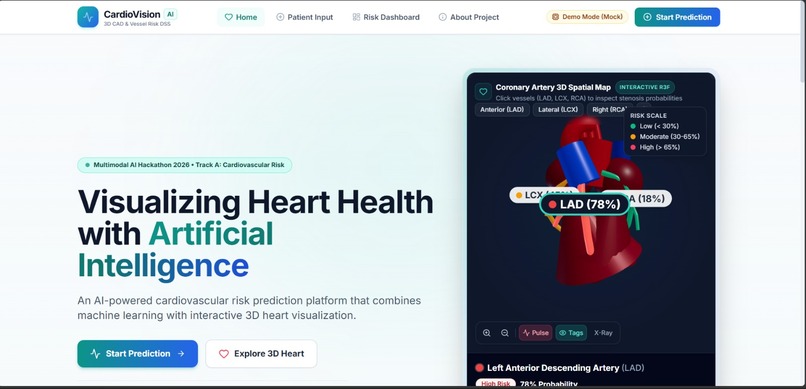
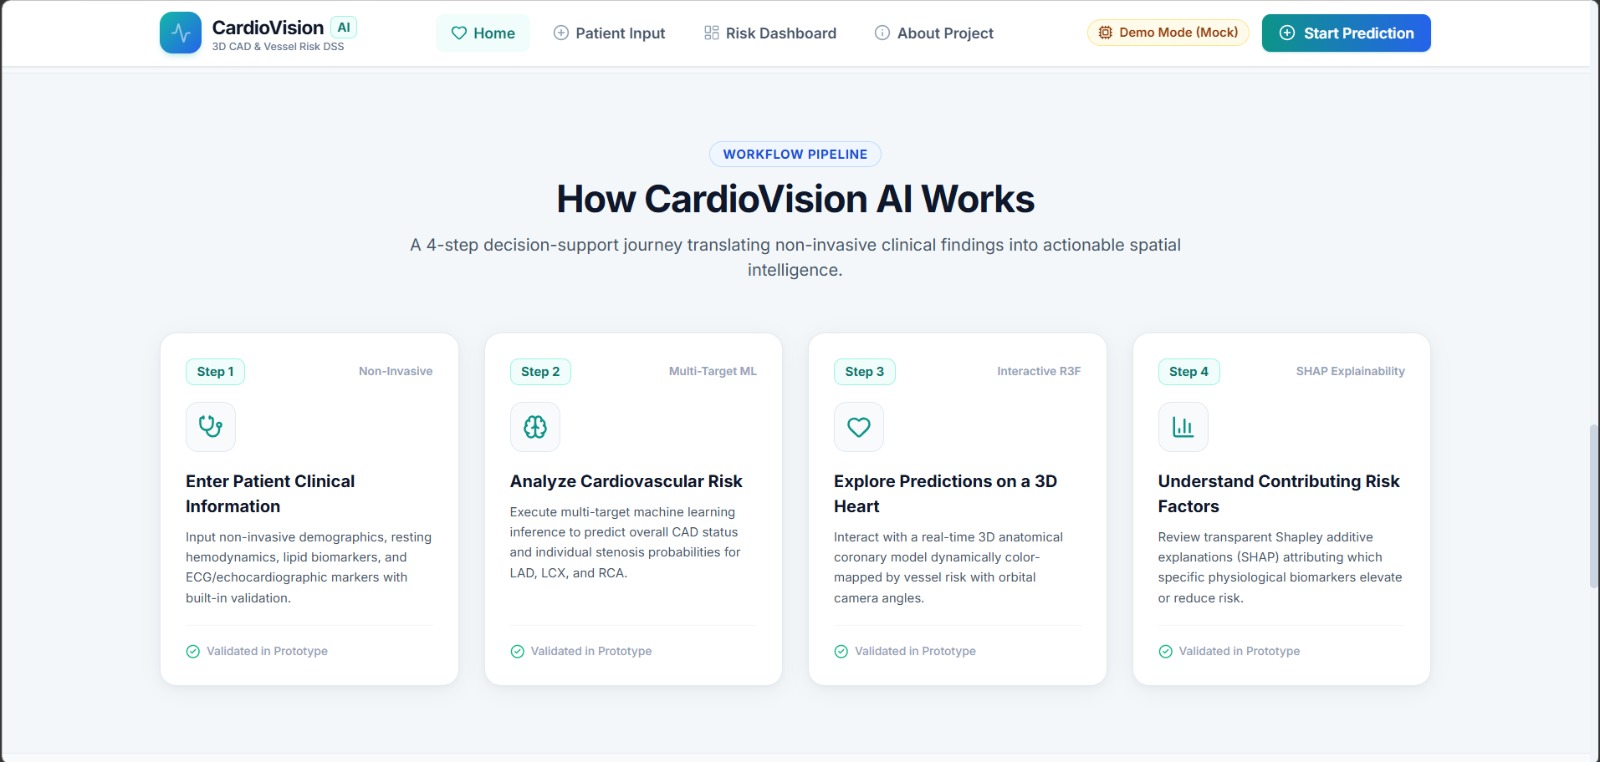
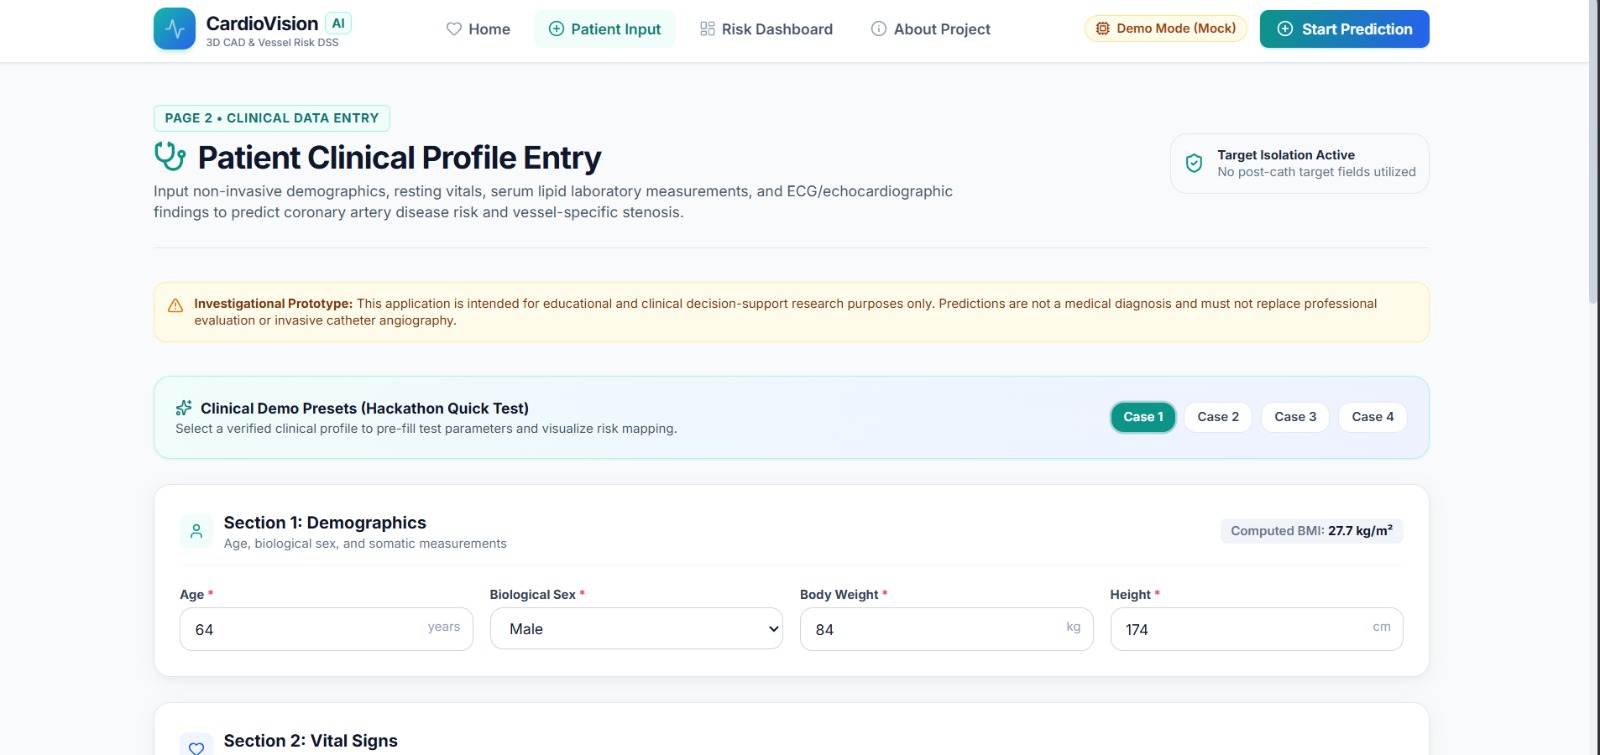
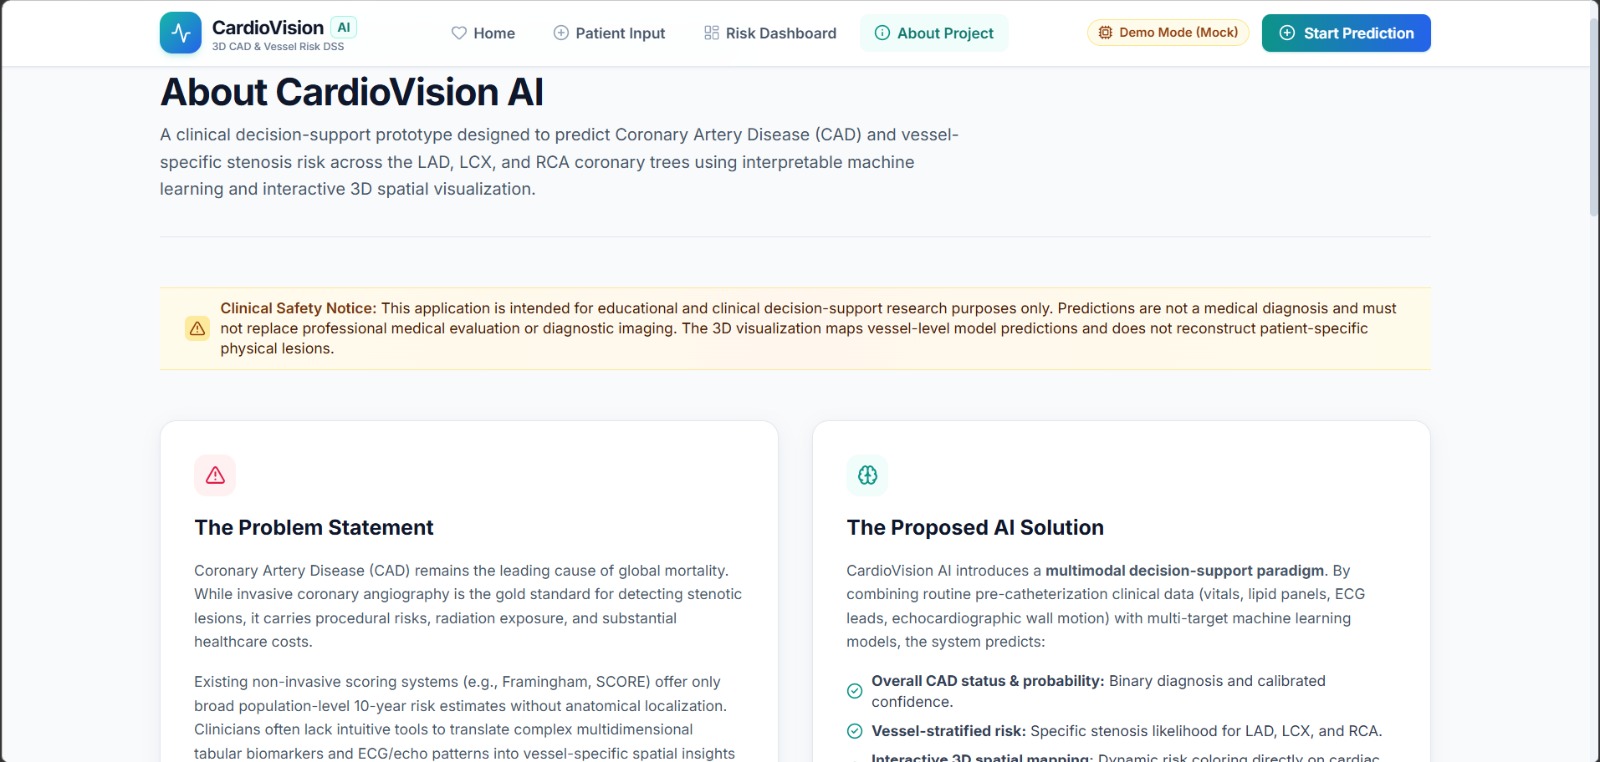
Pheonix is an AI-powered web application designed to predict and visualize cardiovascular risks using patient clinical information.
The platform is designed to provide the following features:
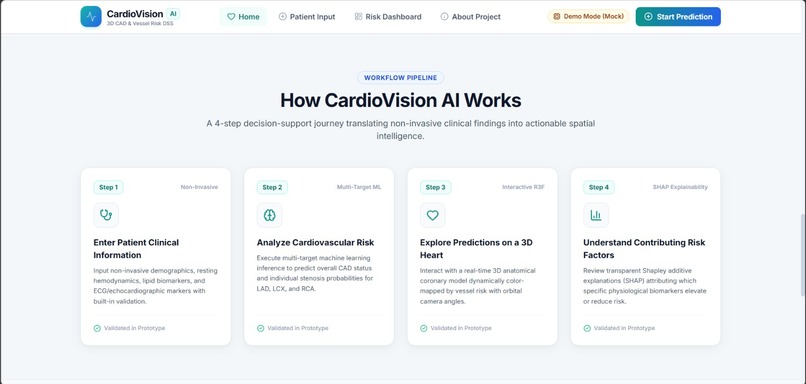
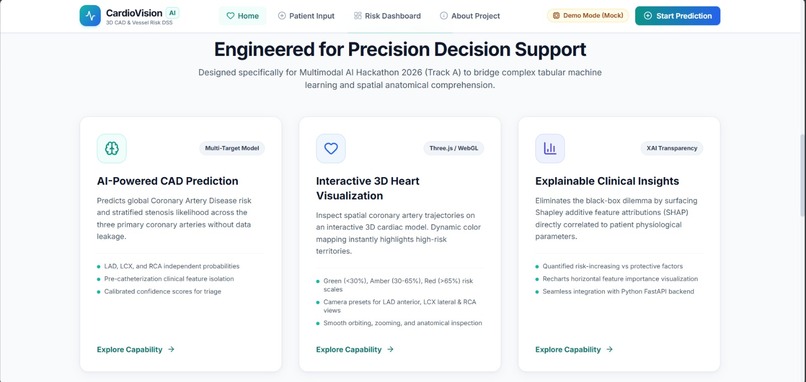
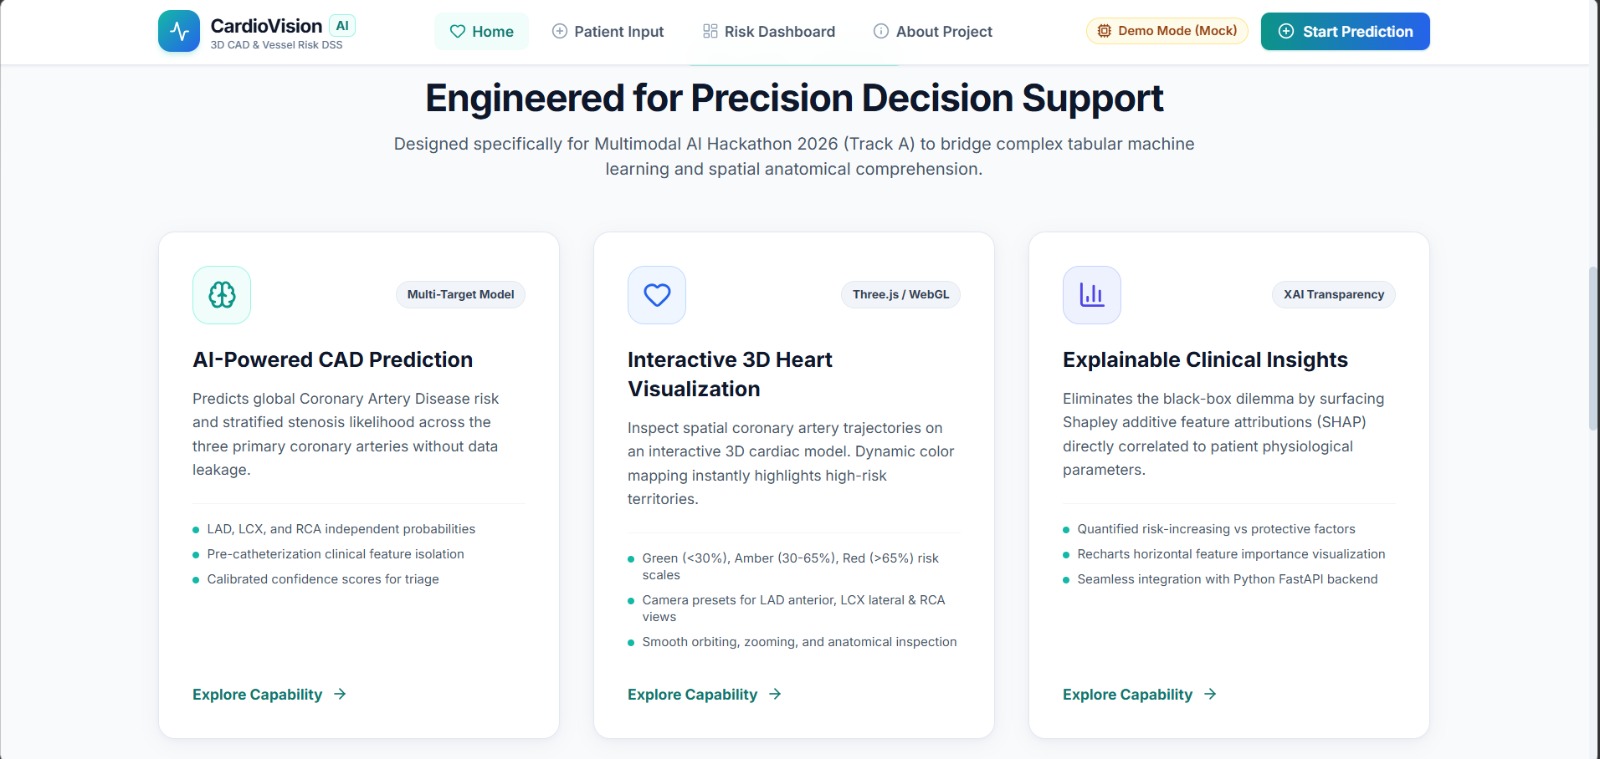
AI-Powered CAD Prediction: Predicts the likelihood of coronary artery disease using demographic, physiological, laboratory, ECG, and echocardiographic data.
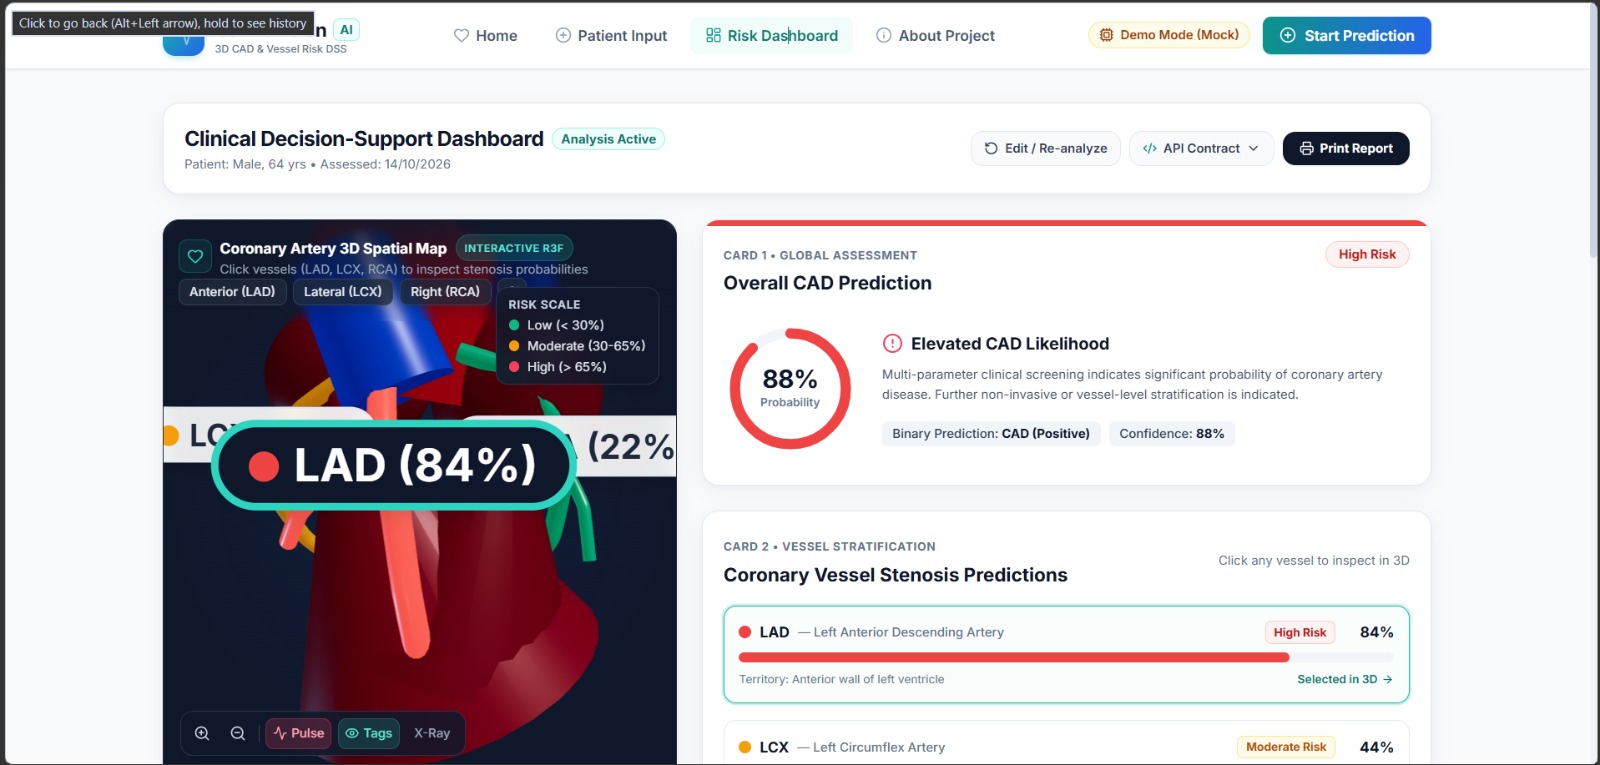
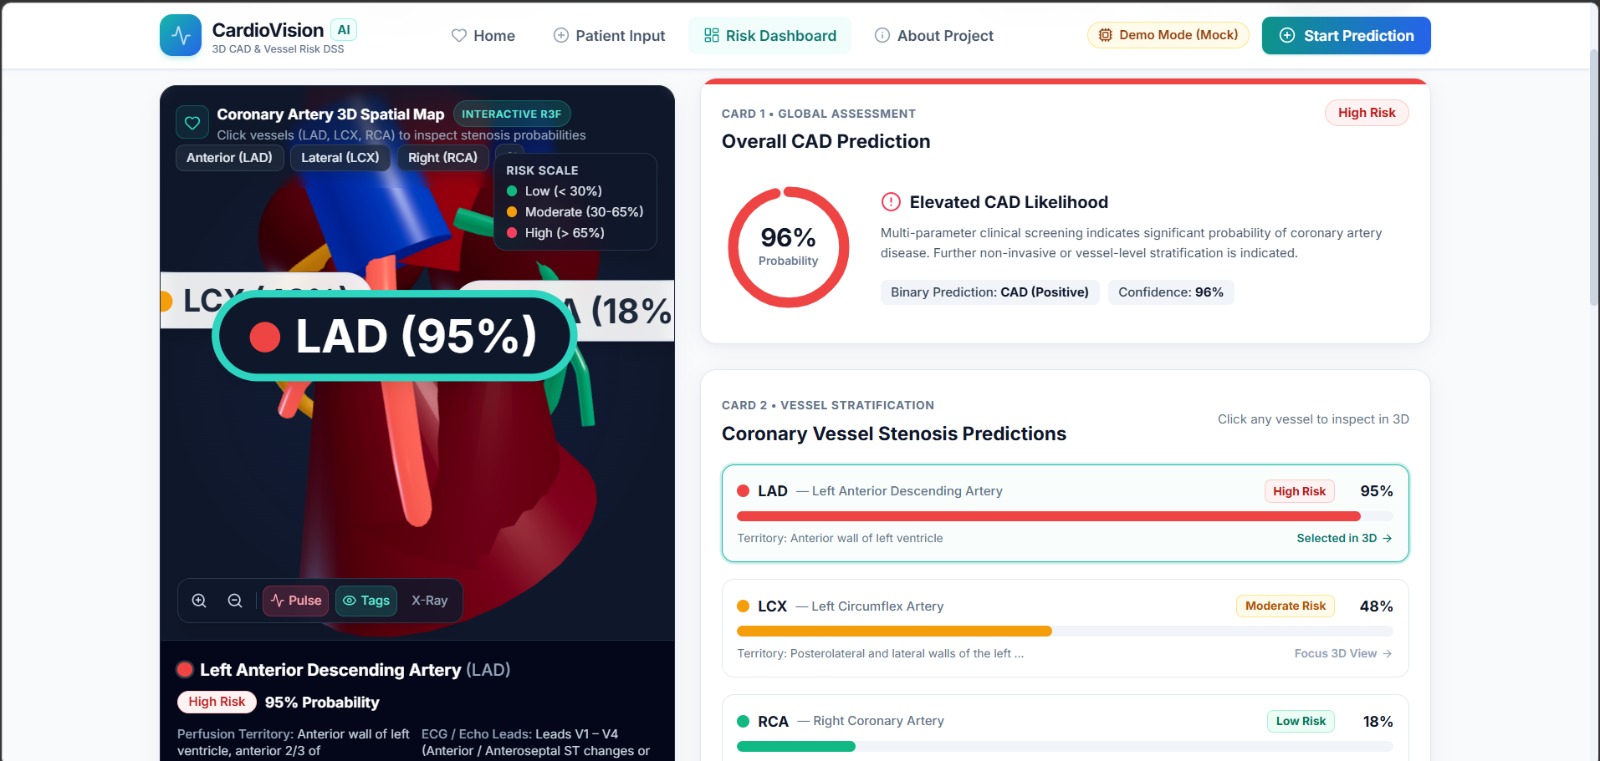
Multi-Vessel Risk Analysis: Estimates stenosis probabilities for three major coronary arteries: LAD (Left Anterior Descending), LCX (Left Circumflex), and RCA (Right Coronary Artery).
Interactive 3D Heart Visualization: Maps vessel-specific predictions onto a 3D anatomical heart model using color-coded risk indicators.
Clinical Dashboard: Presents overall CAD predictions, vessel-specific probabilities, and patient physiological measurements in an intuitive interface.
Explainable AI: Uses feature importance techniques such as SHAP to help users understand the factors influencing predictions.
User-Friendly Interface: Provides a responsive web dashboard for entering patient information and exploring prediction results.
The application is intended for educational and clinical decision-support research, not as a replacement for professional medical diagnosis.
How we built it
We designed Pheonix using a modular architecture that integrates frontend development, machine learning, and interactive visualization.
Frontend Development
React.js and Vite for building a fast, responsive web application.
Tailwind CSS for a modern healthcare-inspired interface.
Three.js and React Three Fiber for interactive 3D heart visualization.
Recharts for displaying risk probabilities and clinical feature contributions.
Machine Learning
Python for data preprocessing and model development.
Pandas and NumPy for handling clinical datasets.
Scikit-learn for training CAD and vessel-specific classification models.
The Z-Alizadeh Sani dataset as the proposed primary source of cardiovascular clinical information.
SHAP for interpreting the influence of individual clinical features on predictions.
Backend Integration
FastAPI for connecting trained machine learning models with the frontend.
REST APIs for processing patient inputs and returning predicted probabilities.
A modular architecture that supports future model improvements and additional clinical features.
3D Visualization
The visualization maps predicted stenosis probabilities to the LAD, LCX, and RCA arteries. Users can rotate, zoom, and inspect individual coronary vessels to explore their predicted risk levels.
The visualization represents vessel-level predictions rather than patient-specific diagnostic imaging.
Challenges we ran into
Developing an AI-powered cardiovascular visualization platform involves several technical and practical challenges.
- Handling complex medical data
Clinical datasets contain numerical and categorical measurements that require careful preprocessing, encoding, and validation before they can be used for machine learning.
- Predicting multiple cardiovascular outcomes
Predicting overall CAD status alongside stenosis in three separate coronary arteries requires multiple classification outputs and careful evaluation.
- Integrating AI with 3D visualization
Connecting prediction probabilities to the correct anatomical structures while maintaining smooth and responsive 3D interactions is a significant technical challenge.
- Making AI predictions interpretable
Medical AI applications require more than prediction scores. Presenting meaningful feature contributions in a way that non-technical users can understand is an important design challenge.
- Preventing data leakage
Ensuring that target-related variables such as LAD, LCX, RCA, and Cath are excluded from prediction inputs is essential for reliable model evaluation.
Accomplishments that we're proud of
Our key accomplishments and project milestones include:
Designing a unified concept that combines cardiovascular risk prediction with interactive anatomical visualization.
Creating a modular architecture for connecting machine learning models with a modern web interface.
Designing an intuitive workflow from patient data entry to cardiovascular risk interpretation.
Planning separate predictions for overall CAD and the LAD, LCX, and RCA coronary arteries.
Incorporating explainable AI into the platform design to make model outputs more transparent.
Prioritizing clinical safety by distinguishing predictive visualization from formal medical diagnosis.
We are especially proud of the project's focus on making complex AI predictions easier to understand through visual interaction.
What we learned
Working on Pheonix has helped us explore the intersection of Artificial Intelligence, Healthcare Technology, and Full-Stack Development.
Some of our most valuable learning areas include:
Understanding coronary artery disease and the importance of vessel-specific stenosis assessment.
Exploring clinical data preprocessing and machine learning classification techniques.
Learning how explainable AI methods such as SHAP can support interpretation of model predictions.
Understanding how Three.js and React Three Fiber can be used for interactive anatomical visualization.
Designing scalable architectures that connect Python-based AI models with React applications.
Recognizing the importance of responsible AI, model validation, and clear medical disclaimers.
Most importantly, this project reinforced the idea that AI becomes more useful when its outputs are not only accurate but also understandable and accessible.
What's next for Pheonix
We envision Pheonix evolving into a more advanced cardiovascular AI research and visualization platform.
Our future roadmap includes:
Improved Prediction Models: Experimenting with ensemble learning and advanced classification algorithms to improve predictive performance.
Enhanced 3D Anatomy: Integrating more detailed anatomical heart models and improved coronary artery visualization.
Advanced Explainable AI: Expanding SHAP-based explanations and patient-level feature contribution analysis.
Clinical Data Integration: Supporting additional validated clinical measurements and datasets.
Model Validation: Conducting more extensive cross-validation, calibration analysis, and external evaluation where suitable datasets are available.
Personalized Risk Reports: Generating downloadable summaries of model predictions and contributing clinical features.
Deployment: Making the platform accessible through a secure, cloud-hosted web application.
Our long-term goal is to make Pheonix a powerful, interpretable, and visually engaging cardiovascular AI platform that helps bridge the gap between complex machine learning predictions and meaningful clinical insights.
Pheonix — Turning Cardiovascular Data into Visual Intelligence.
Built With
- artificial-intelligence
- css3
- data-visualization
- fastapi
- html5
- javascript
- machine-learning
- numpy
- pandas
- python
- react
- react-three-fiber
- recharts
- scikit-learn
- shap
- tailwindcss
- three.js
- vite
- webgl


Log in or sign up for Devpost to join the conversation.