-
-
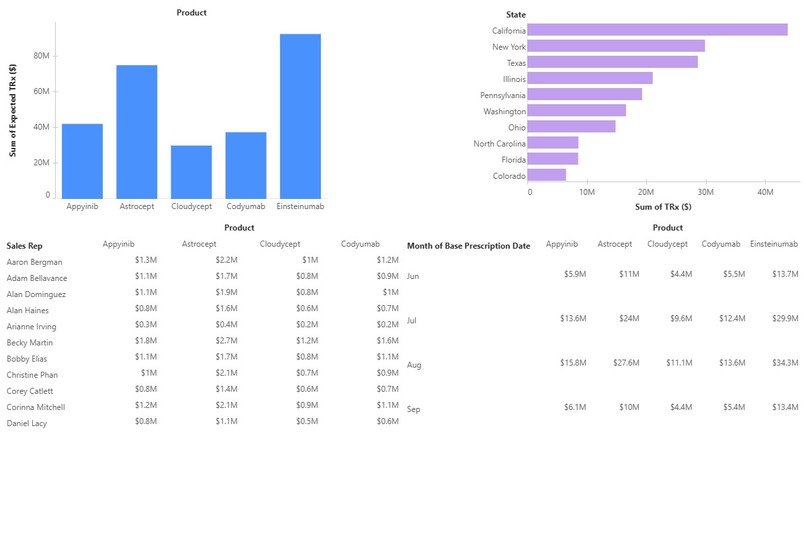
Dashboard Page 2
-

Dashboard Page 1

Inspiration:
Pharma companies deal with complex data — from prescriptions to rep performance — but often lack real-time, actionable insights. We wanted to bridge that gap. Our inspiration was to empower decision-makers with a unified dashboard that not only shows what happened but also why it happened and where opportunities exist. With Salesforce Data Cloud and Tableau Next, we saw an opportunity to create a semantic analytics layer that transforms raw data into strategy.
What it does:
- Our solution delivers:
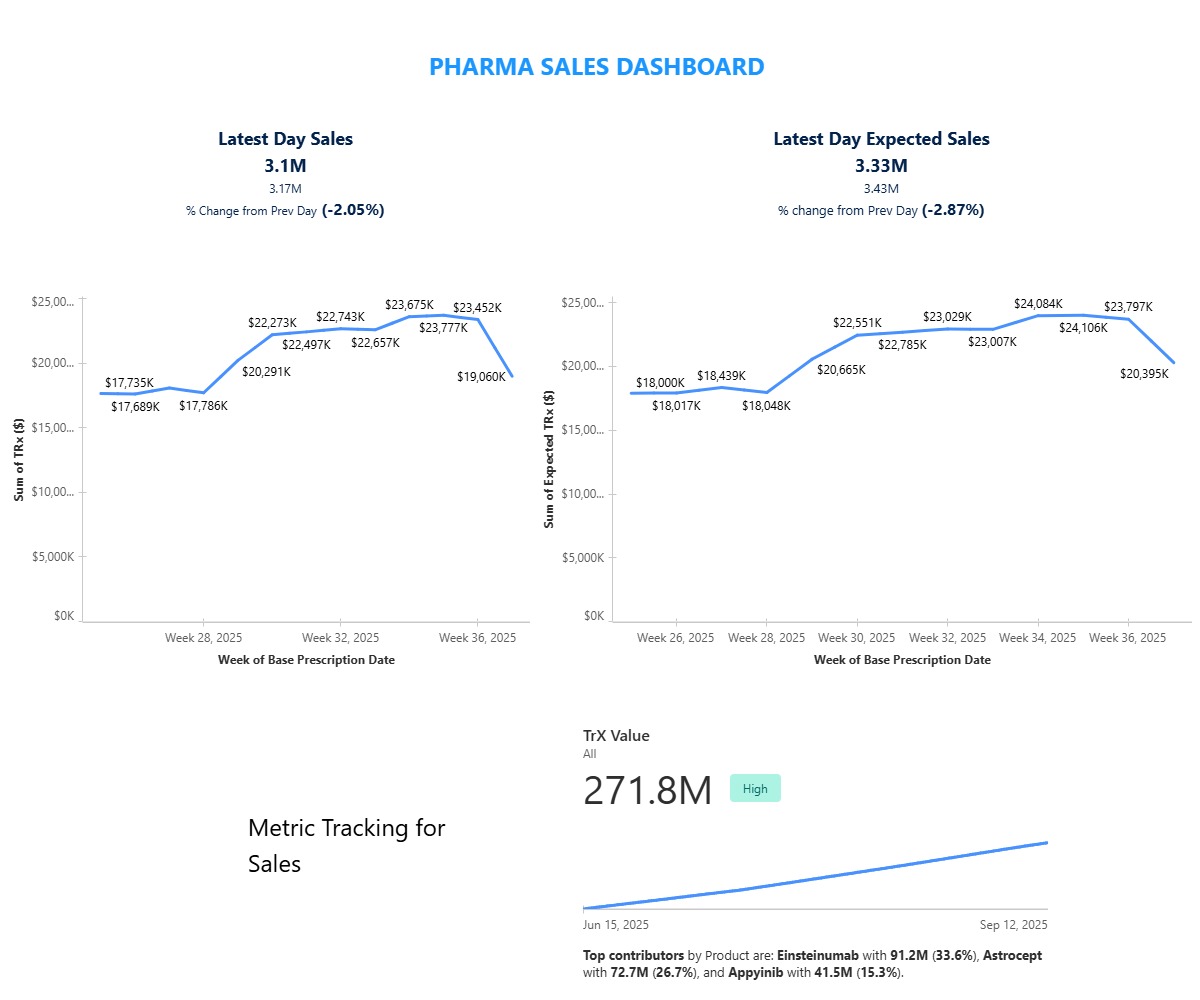
- Real-time KPIs (today vs. yesterday’s sales, weekly sales growth).
- Market Share & TRx gap analysis by state, city, and product.
- Drilldowns into sales rep–level performance to track contribution and highlight underperformance.
- A semantic layer for consistent business metrics across Salesforce Data Cloud and Tableau Next.
- Actionable dashboards that support rep allocation, territory planning, and growth strategies.
How we built it:
- Data Integration: Ingested pharma sales data into Salesforce Data Cloud with incremental refresh pipelines.
- Semantic Layer: Defined KPIs and calculations (e.g., TRx Gap, Market Share %) in Tableau Next’s semantic model.
- Visualization: Built interactive dashboards in Tableau Next: Market Share Heatmaps Sales Rep Leaderboards Product Growth Trends
- Interactivity: Enabled proportional brushing, filter + URL actions, and drilldowns to drive user engagement.
- Integration: Connected insights back to Salesforce CRM for actionability.
Challenges we ran into
- Learning curve with Tableau Next semantic layer and its integration with Salesforce Data Cloud.
- Managing large pharma datasets while ensuring real-time performance with incremental refresh.
- Designing dashboards that balance granularity (rep-level data) with clarity for executives.
- Implementing proportional brushing and URL actions in a hackathon timeframe.
Accomplishments that we're proud of
- Built a working end-to-end pipeline from Salesforce Data Cloud → Tableau Next → CRM insights.
- Delivered dashboards that judges and end-users can interact with live during the hackathon.
- Created a semantic layer that ensures consistent, reusable KPIs across visualizations.
- Showcased real-world value for pharma companies by turning raw data into strategy.
What we learned
- How to design for both executives and reps by layering high-level KPIs with drilldown capabilities.
- Best practices for semantic modeling in Tableau Next to make dashboards scalable.
- The importance of storytelling with data — beyond charts, explaining the “so what” factor.
- Hands-on skills in Salesforce Data Cloud integration, Tableau Next actions, and incremental refresh pipelines.
What's next for Pharma Sales Analyzer
- Add AI-driven insights with Einstein GPT to automatically highlight anomalies or opportunities.
- Expand to predictive analytics (e.g., forecast sales growth using time-series models).
- Integrate call center datasets for a 360° customer view (sales + service).
- Deploy as a ready-to-use solution package on Salesforce AppExchange for pharma businesses.


Log in or sign up for Devpost to join the conversation.