-
-
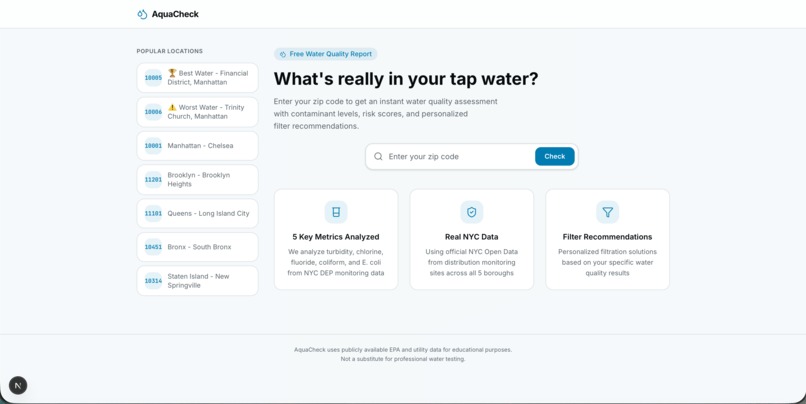
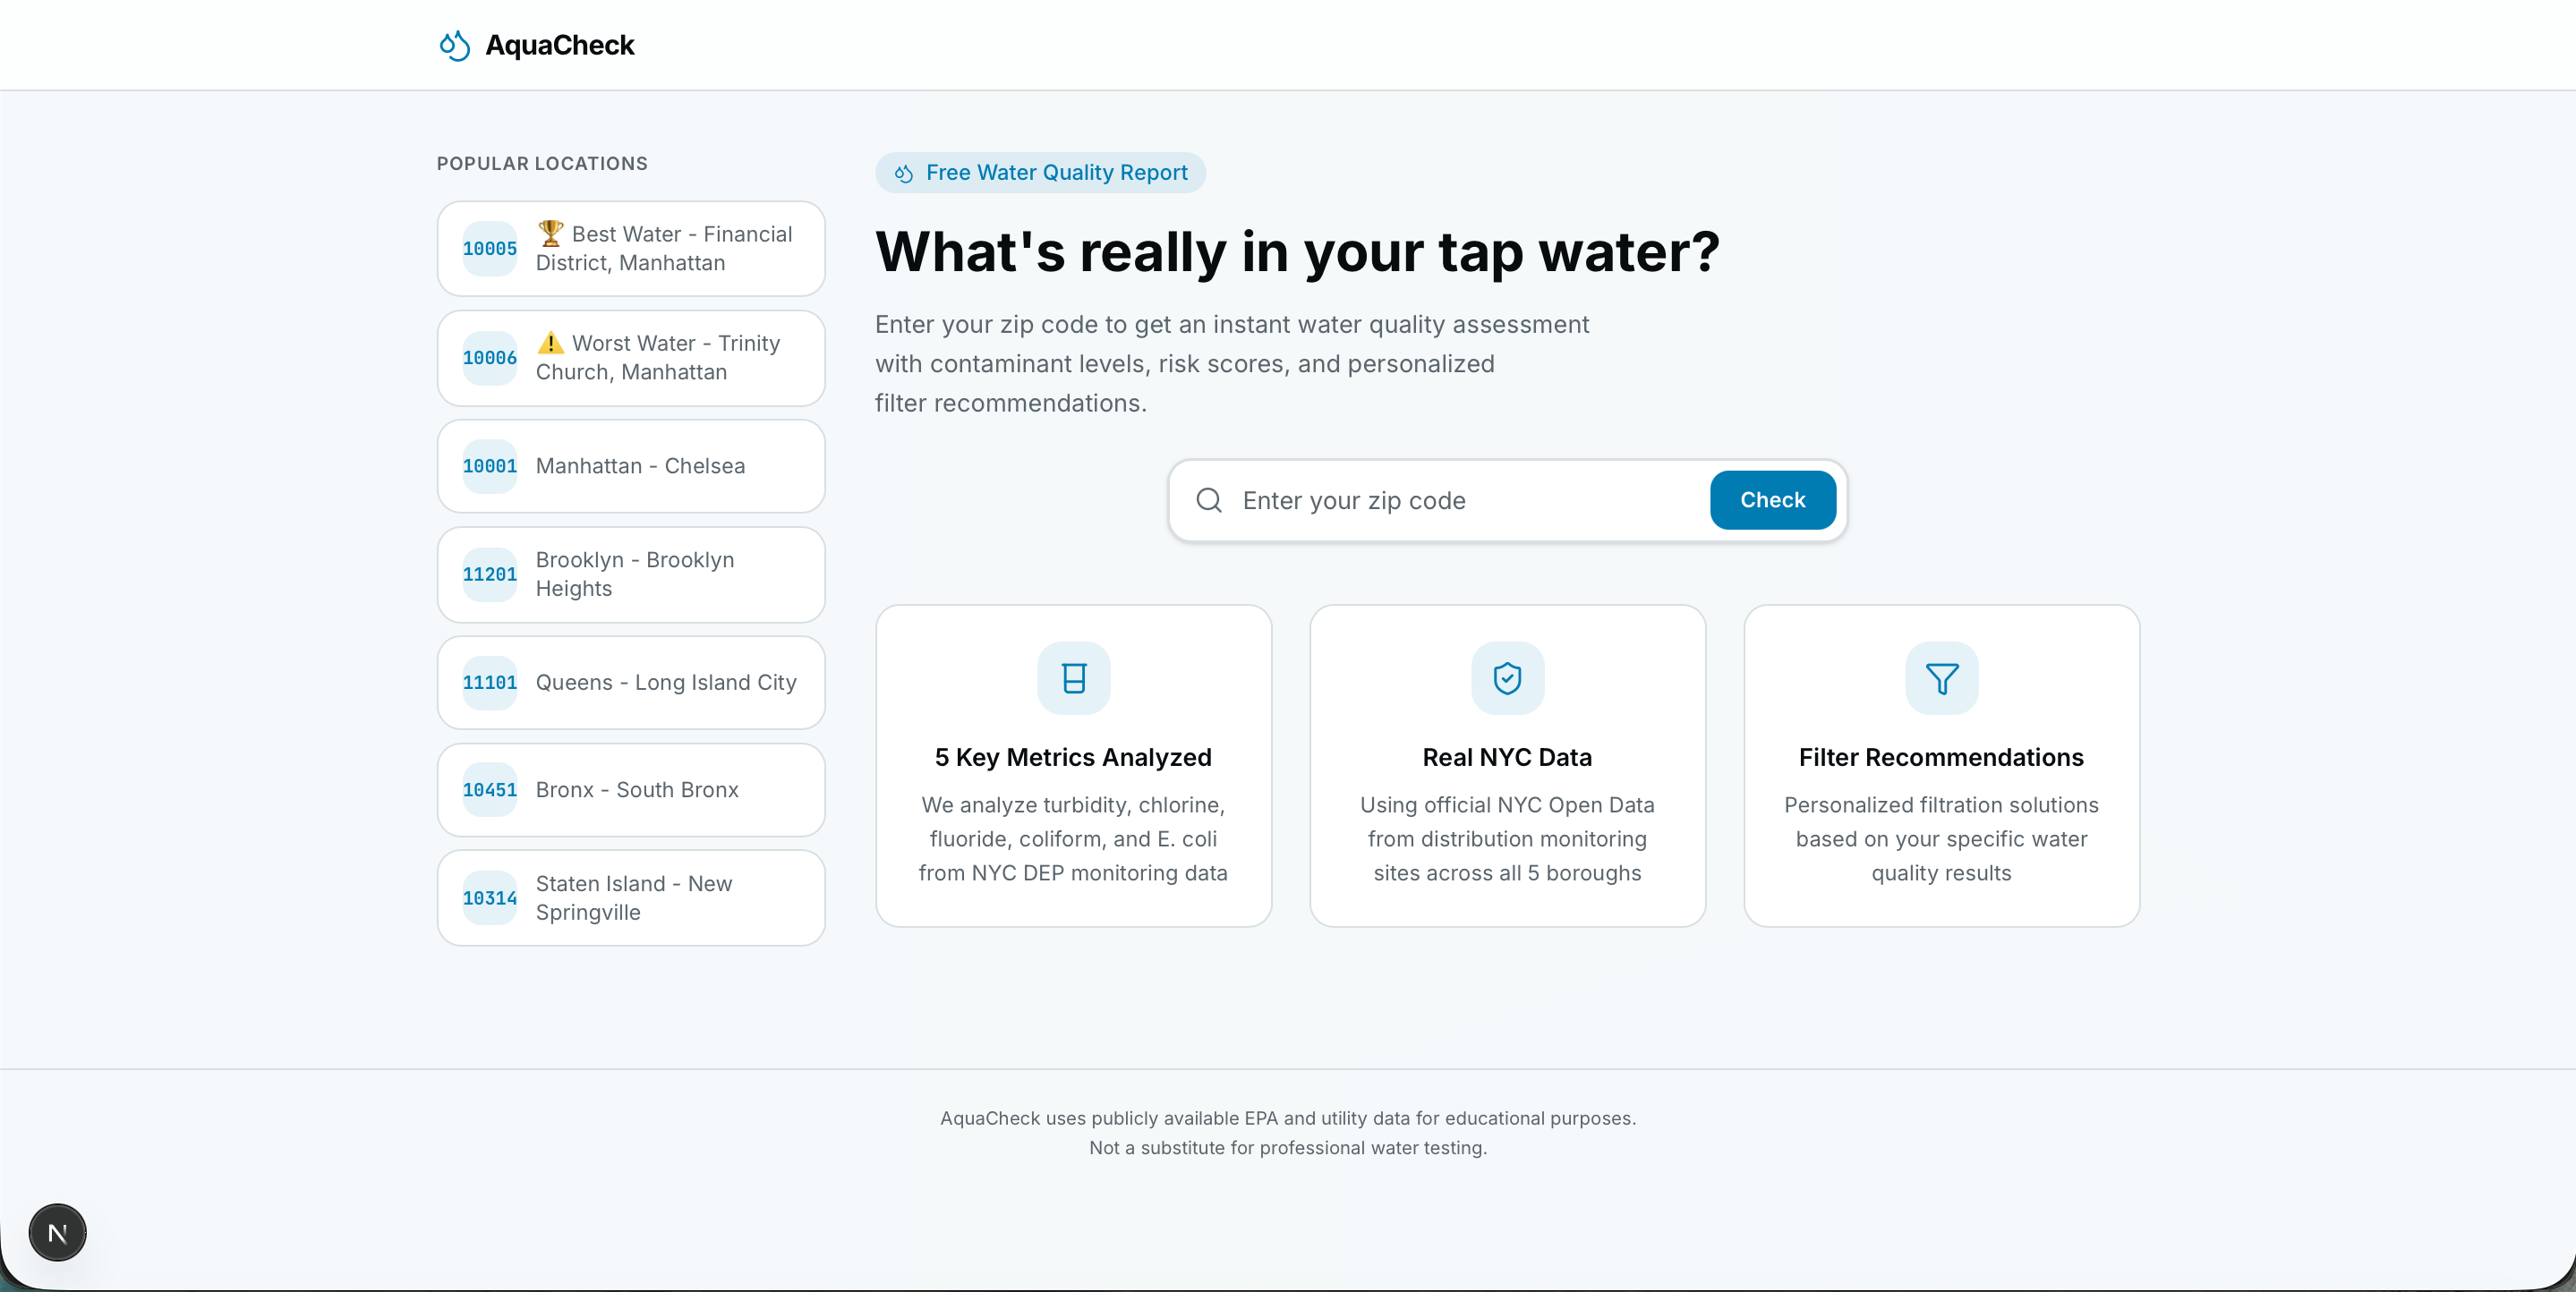
Landing Page
-
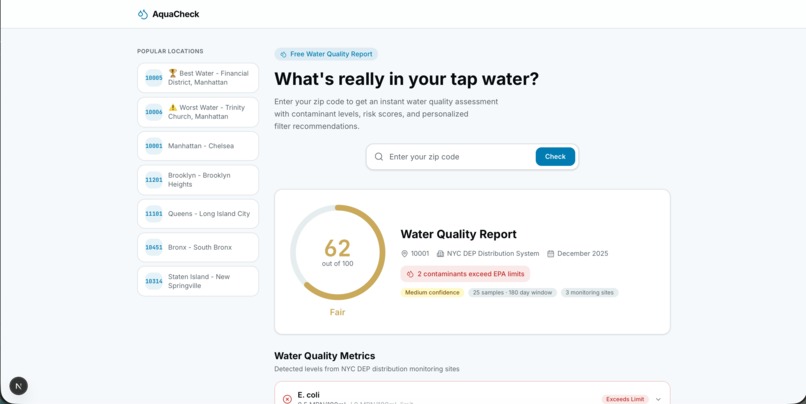
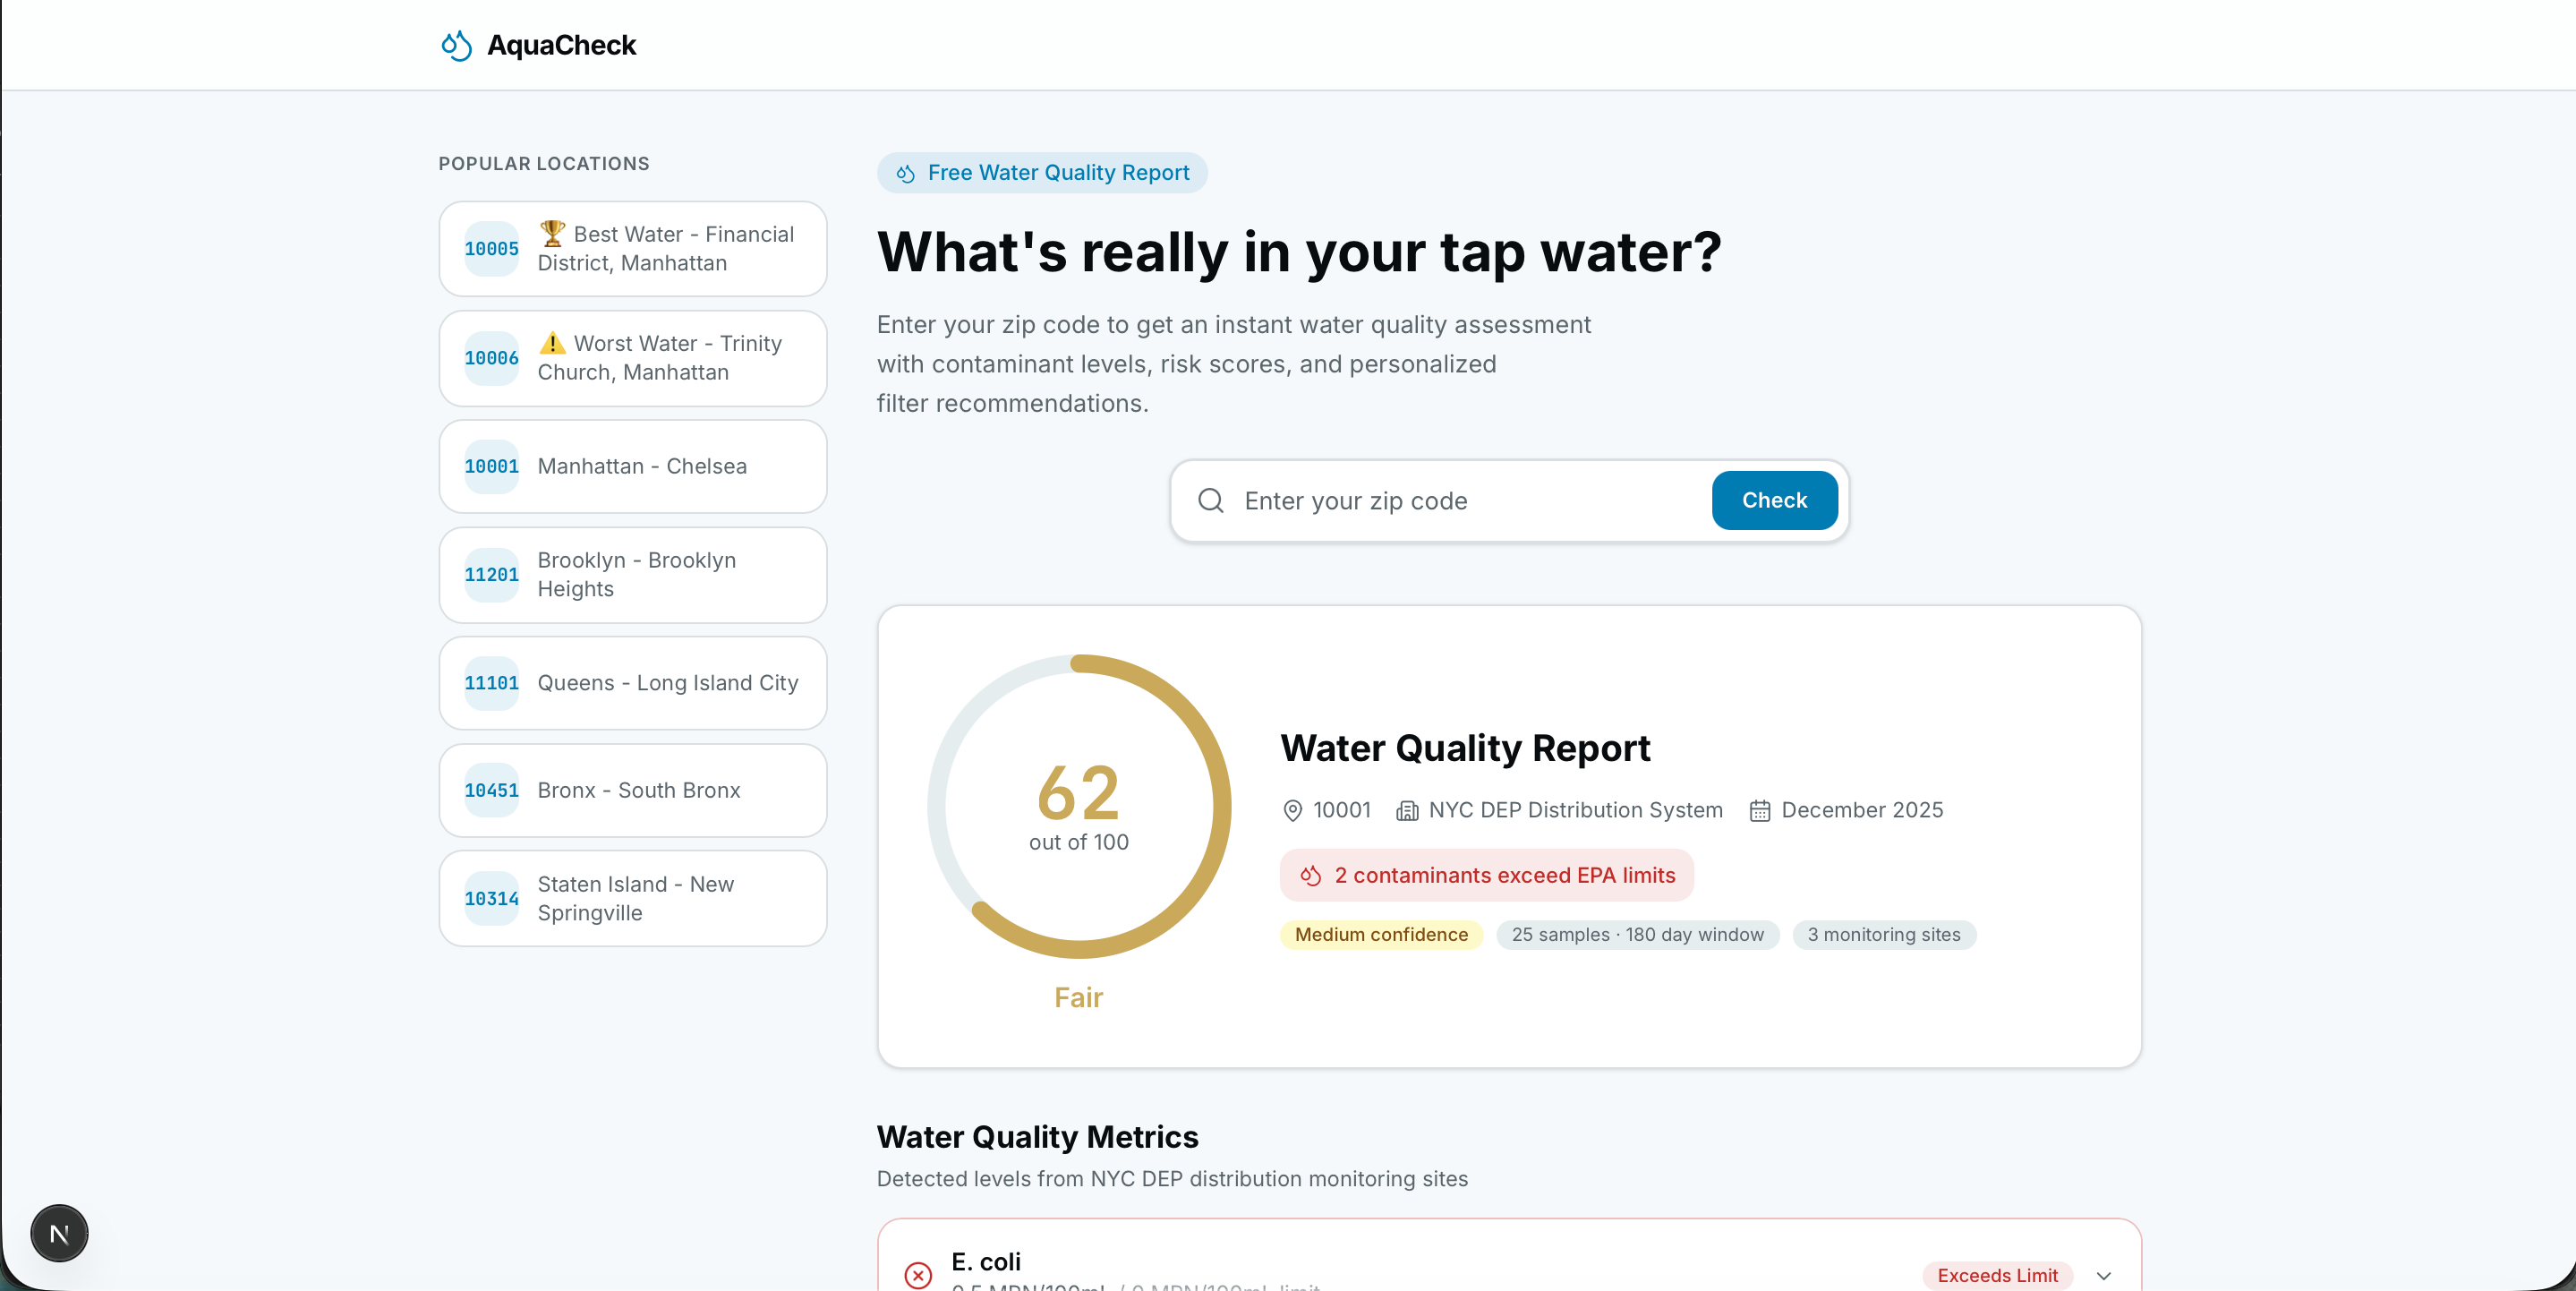
Result page
-
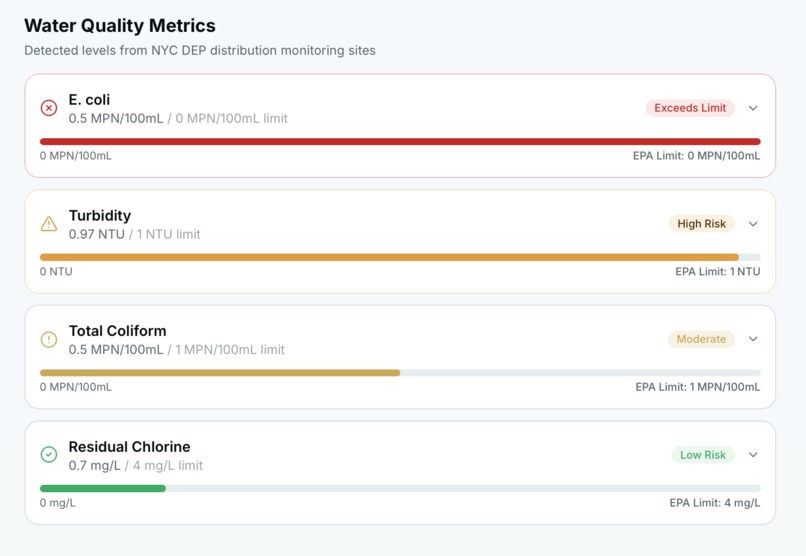
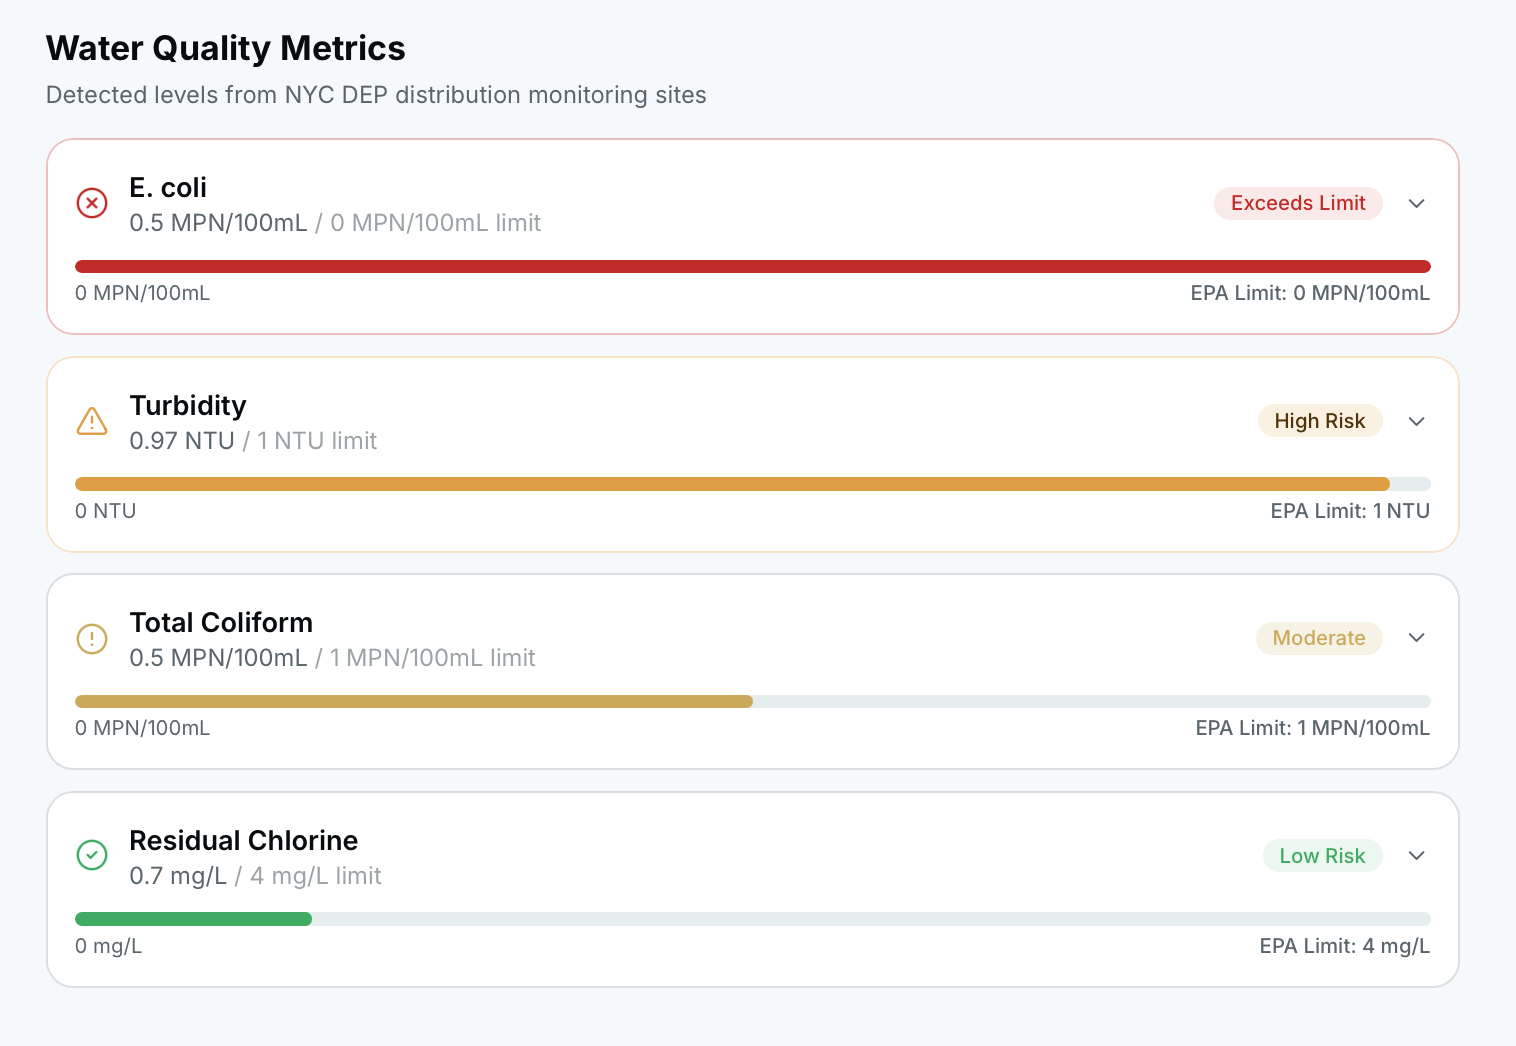
Water quality indicators
-
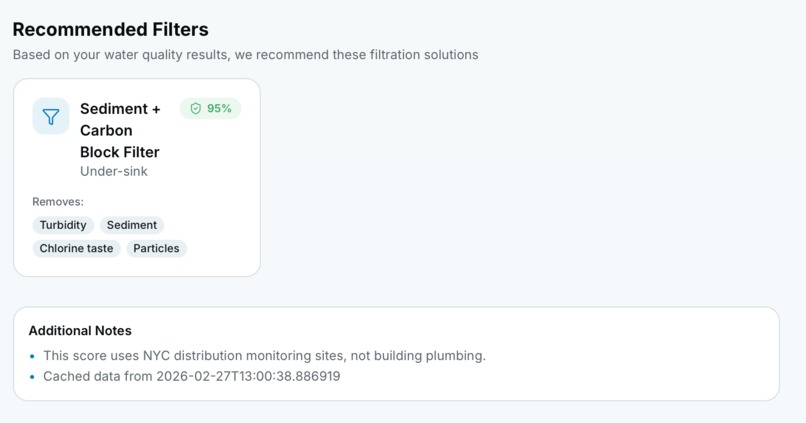
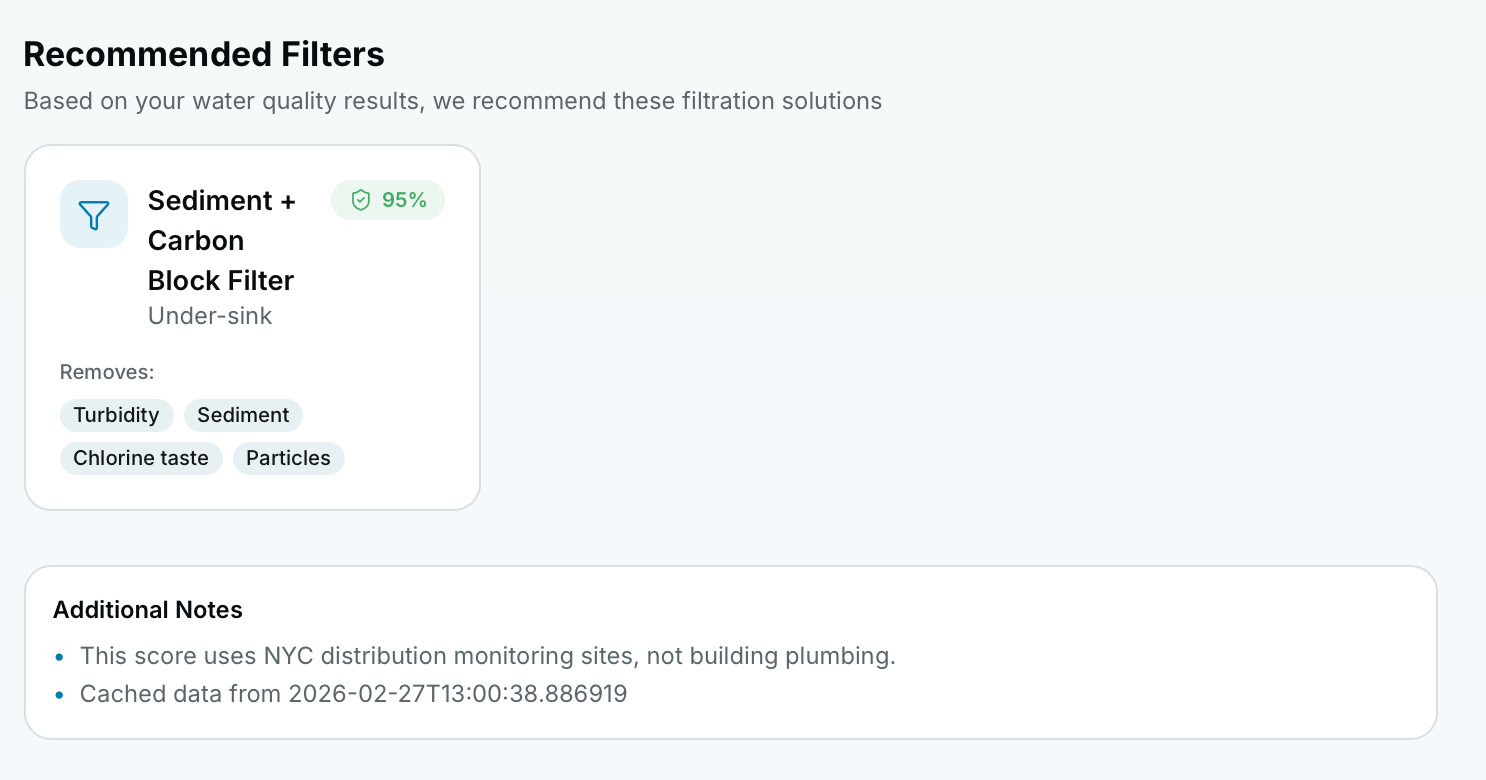
recommendation
Inspiration
Access to safe drinking water is something most New Yorkers take for granted, yet very few people understand what actually goes into measuring water quality. We were inspired by the availability of NYC Open Data and wanted to transform raw water quality measurements into something understandable and useful for everyday residents.
Instead of looking at complicated spreadsheets, we wanted users to easily explore water quality indicators like pH level, turbidity, chlorine, and bacteria levels through a simple web application.
Our goal was to make public water quality data transparent, interactive, and accessible.
What it does
Our project is a web application that allows users to explore NYC drinking water quality data in an interactive way.
Users can:
View water quality indicators such as pH level, turbidity, chlorine, and bacteria levels
Explore measurements from different sampling sites
Track how water quality changes over time
Visualize data instead of reading raw tables
The application makes complex environmental data easier to understand through simple visualizations.
How we built it
We built the project using the NYC Open Data Drinking Water Quality Distribution Monitoring dataset provided by the Department of Environmental Protection (DEP).
First, we cleaned and processed the data by handling missing values and formatting measurements into usable numeric values.
We then connected the sampling data with sampling site information to make the data more meaningful.
The web application was developed using:
NYC Open Data datasets
Python / JavaScript for data processing
Data visualization libraries for charts
A simple web framework to build the interface
The application allows users to filter and explore water quality data dynamically.
Challenges we ran into
One of the biggest challenges was working with real-world public data, which required cleaning and formatting before it could be used.
Another challenge was understanding the meaning of the different water quality measurements and how they should be interpreted.
We also had to connect sample site codes to actual locations, which required combining multiple datasets.
Time constraints during the hackathon made it challenging to implement all the features we initially planned.
Accomplishments that we're proud of
We are proud that we successfully transformed a large and complex dataset into a working interactive web application.
We built a system that makes NYC water quality data easier to explore and understand.
We also successfully integrated multiple datasets and created meaningful visualizations within a short period of time.
What we learned
Through this project we learned:
How to work with real-world environmental data
How to clean and prepare open datasets
How to build a data-driven web application
How to visualize complex datasets in a simple way
How to collaborate efficiently under hackathon time pressure
This project helped us understand the importance of making public data accessible and useful.
What's next for AquaCheck
In the future, we would like to expand this project by:
Adding a map-based visualization of sampling locations
Including real-time or more frequent data updates
Adding more environmental datasets
Building automated alerts for unusual water measurements
Providing neighborhood-level water quality summaries
Built With
- nextjs
- python

Log in or sign up for Devpost to join the conversation.