-
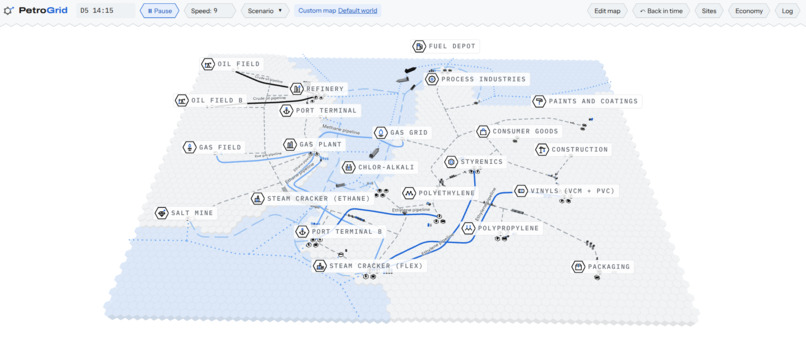
Project example
-
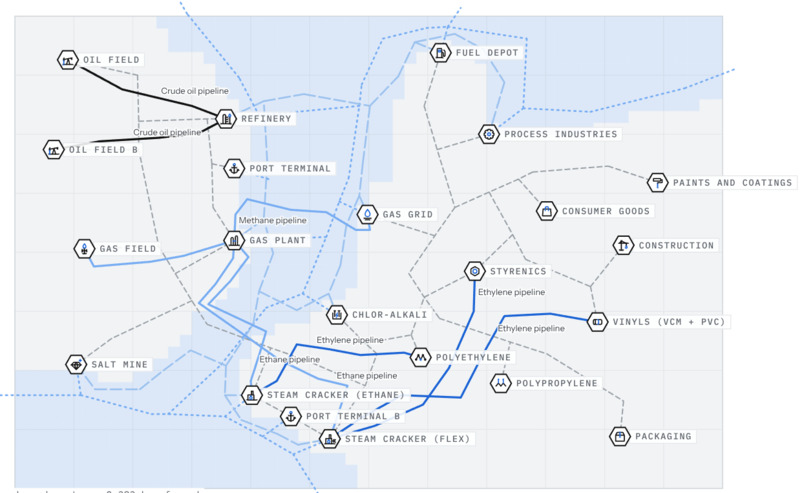
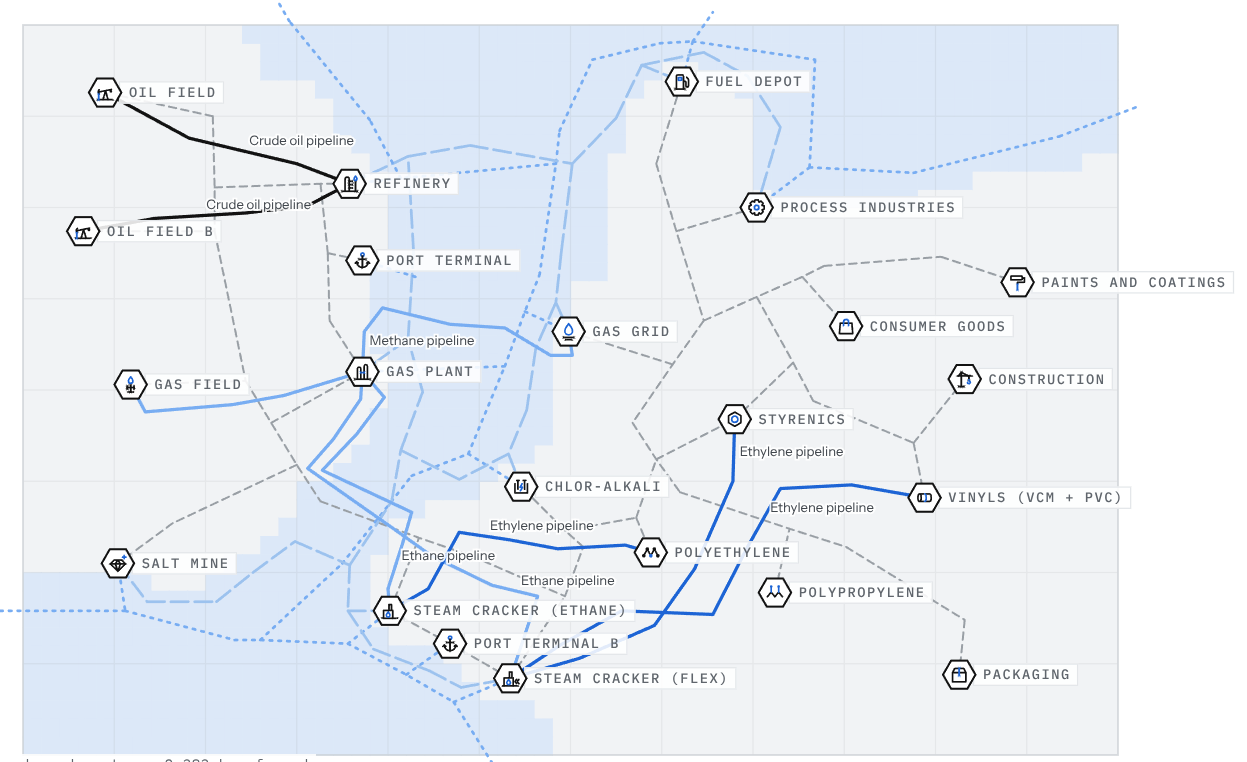
2D map design of the project example
Inspiration
More than 95% of U.S. ethylene capacity, the starting point for most plastic, sits in Texas and Louisiana, and every plant there depends on the ones before it. Each company only sees its own.
In February 2021, one freeze took about three-quarters of that capacity offline. Plants the storm never touched shut down when their inputs stopped. Car lines halted. Nobody knew who would run short, or when, until they did.
What it does
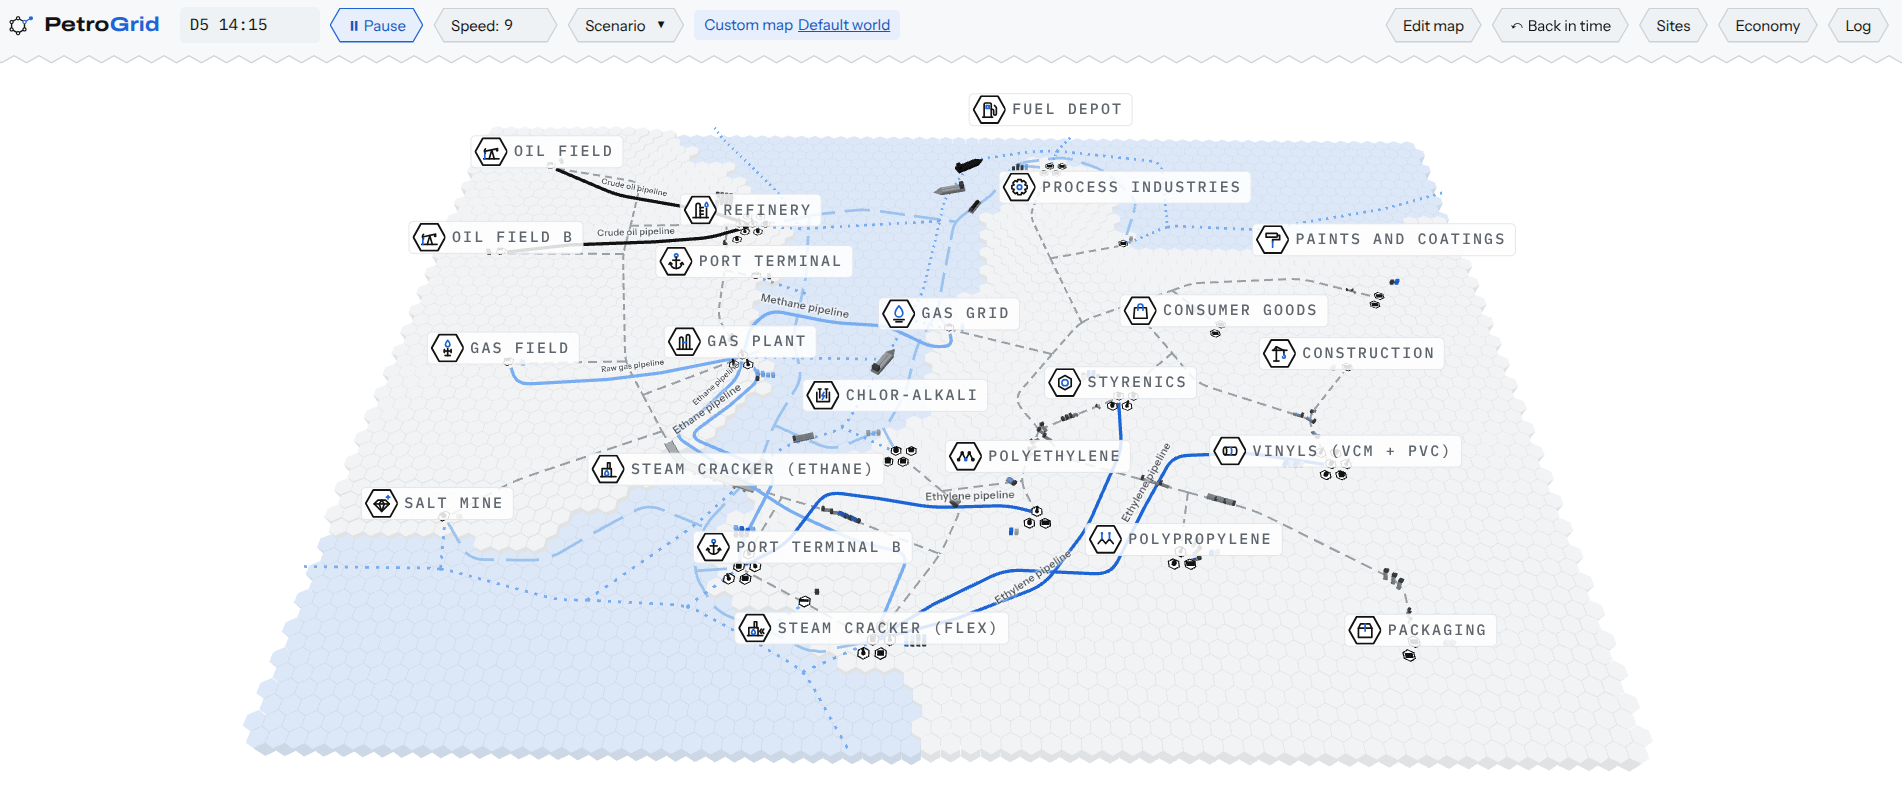
PetroGrid is a live simulation of a chemical supply chain, from oil and gas fields to the companies that buy plastic. Break something and it shows what fails next, when, and what it costs.
- Break a unit or a route and watch the shortage spread through 22 sites, 9 pipelines and 82 trucks, barges and ships.
- Open any plant to see its process flow, its tanks, and where it sits on every rule the model uses.
- Price the damage: the same moment is run forward twice, once as it is and once as if nothing had broken, and the difference is the cost.
- Switch the market on: prices follow scarcity, and buyers, customers and plants all react to them.
- Redraw the map in the map builder and run the result.
- Run it together: people join from their phones with a QR code, each takes a plant, and a summary at the end shows what broke, which prices moved, and who caused what.
How I built it
- Engine: C++20, simulating every tank, plant unit, pipeline and vehicle in 15-minute steps. Runs are exactly repeatable, which is what makes the before-and-after comparison possible.
- Server: the engine behind an HTTP API, with private sessions for the demo and shared rooms for group sessions.
- Front end: React, TypeScript and three.js for the 3D map, the windows and the charts.
- Hosting: one Docker image on Fly.io, with GitHub Actions running the tests.
Challenges we ran into
- Getting a 22-site network to stay balanced for 60 days with nothing scripted. Early versions gridlocked when one by-product tank filled and stopped a whole plant.
- Compiling C++ in parallel ran my laptop out of memory and took the whole machine down mid-build.
- Making price matter. At first a price change did nothing, because no buyer, customer or plant reacted to it. A price model was ultimately implemented.
Accomplishments that we're proud of
- A supply chain that reacts to a failure with no script: every cascade comes out of the rules.
- A shared session that runs on phones from a QR code, with a damage summary that compares what the group did against the same run with nothing changed.
- A market layer, added on the last morning, that passed the same 60-day check as the base model.
What we learned
- Writing a simulation engine for a whole network, not a single chemical process.
- Deploying a multi-user simulation where every screen has to show the same moment.
- Small local rules are enough to produce realistic network behaviour, and that makes the model easy to explain and test.
What's next for PetroGrid
- Real plant data and price history, then replaying a known event such as the 2021 freeze to calibrate it.
- Imports, exports and contracts, so the market is no longer closed.
- Expanding chemical plant support
- Finding first users among supply chain and risk teams.
It uses your exact headings, so it pastes straight into the form. "Built With" and "Try it out" are separate fields there, so I left them out of the block:
- Built With: c++, cmake, typescript, react, three.js, docker, fly.io, github-actions, claude, lovable, obvious
- Try it out: demo.petrogrid.xyz, petrogrid.xyz, demo.petrogrid.xyz/editor/, github.com/ErwinPawliczek/UH-Hackathon-2026
Built With
- c++
- claude
- cmake
- docker
- fly.io
- github-actions
- lovable
- obvious
- react
- three.js
- typescript

Log in or sign up for Devpost to join the conversation.