-
-
Input
-
-

-
-

Inspiration for the Project
This project was inspired by my experiences working at various gas stations and restaurants across America. I observed that many small business owners lack the professional-level analysis skills that larger companies possess. Recognizing this gap, I wanted to create a solution that democratizes access to advanced data analysis, empowering these business owners to make more informed decisions.
Through the use of Google Gemini and our application, we provide these owners with above-average data analysis capabilities specifically tailored to their needs. By submitting their Profit and Loss statements via our app, they can gain insights that are typically reserved for larger, more technically equipped businesses. This tool is designed to help small business owners advance in their respective markets, offering them the solutions needed to tackle their unique business challenges and foster growth.
What it does
Project Overview
This application serves as an advanced Profit and Loss analysis tool designed to cater to small business owners who may not have extensive financial analysis skills. The platform provides a user-friendly interface where business owners can upload the financial data of their establishments and receive in-depth insights that help them understand their business's financial health.
Key Features
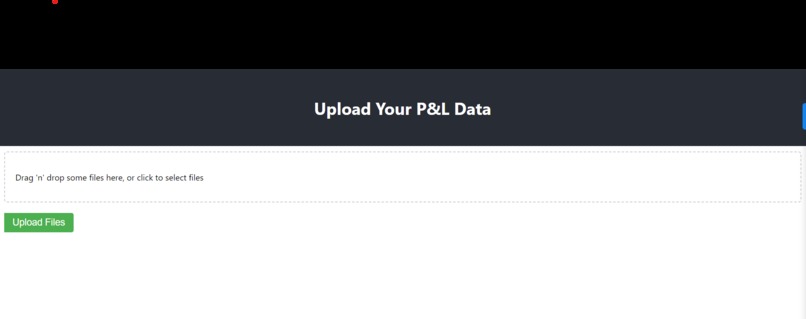
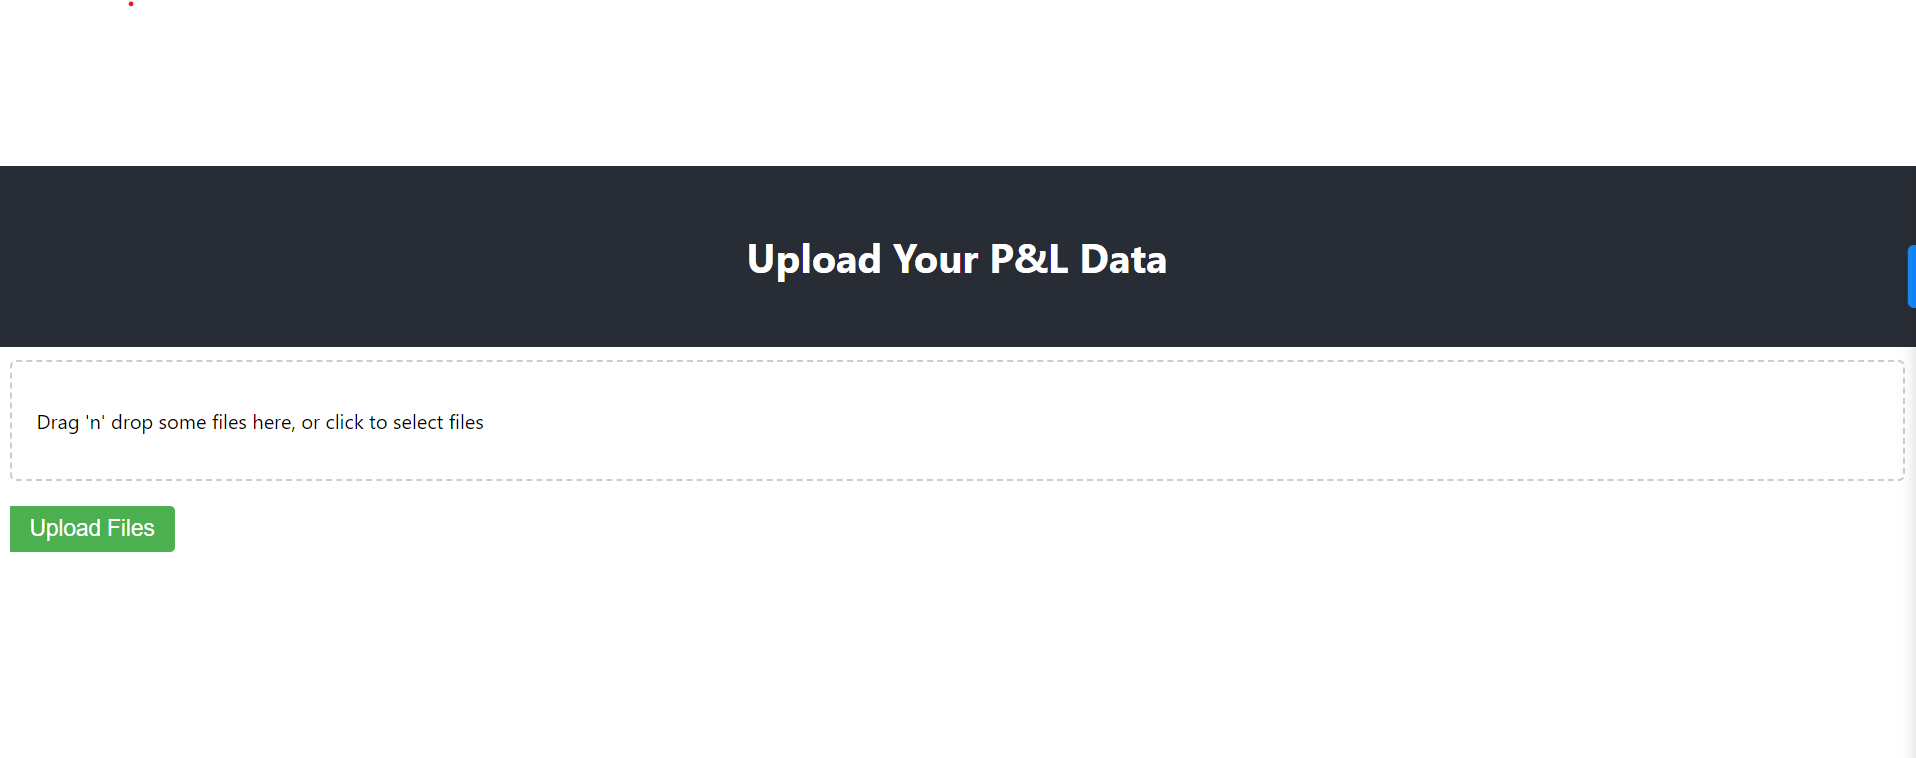
Data Upload
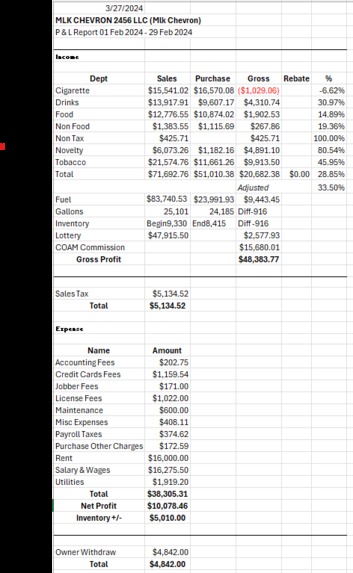
Users can upload their P&L data through an intuitive interface that supports drag-and-drop or file selection. The system is configured to accept screenshot images of P&L statements, making it accessible for those who may not have digital or text-based records.
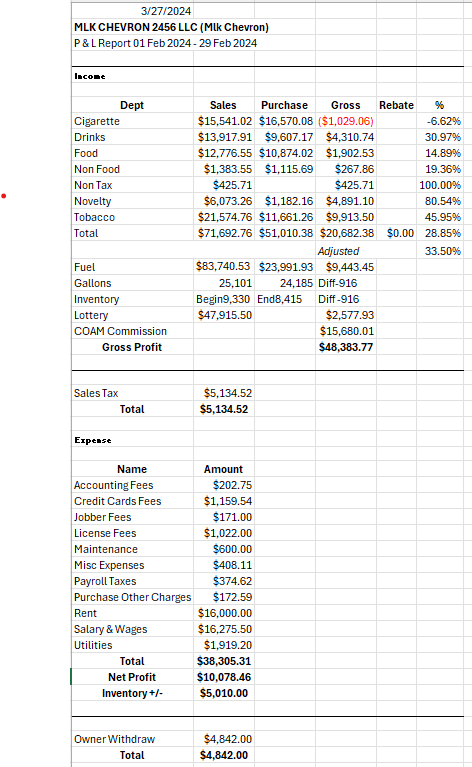
Analysis and Insights
Once the P&L data is uploaded, the application analyzes the information and provides a clear and detailed breakdown of various financial metrics. It includes sales, purchases, gross profits, and net profits, categorized into different business segments like fuel, groceries, and other inventory items.
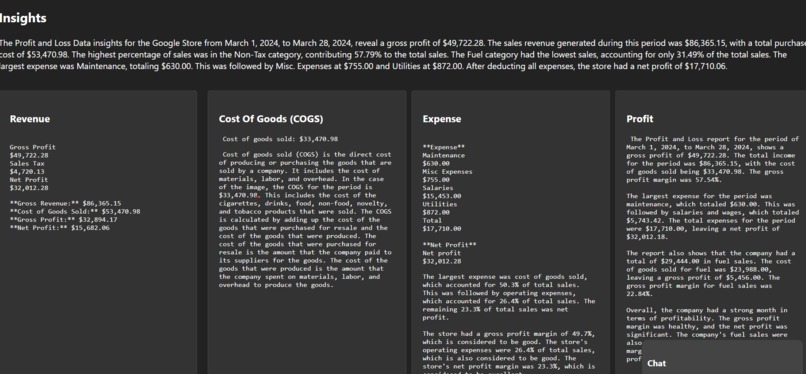
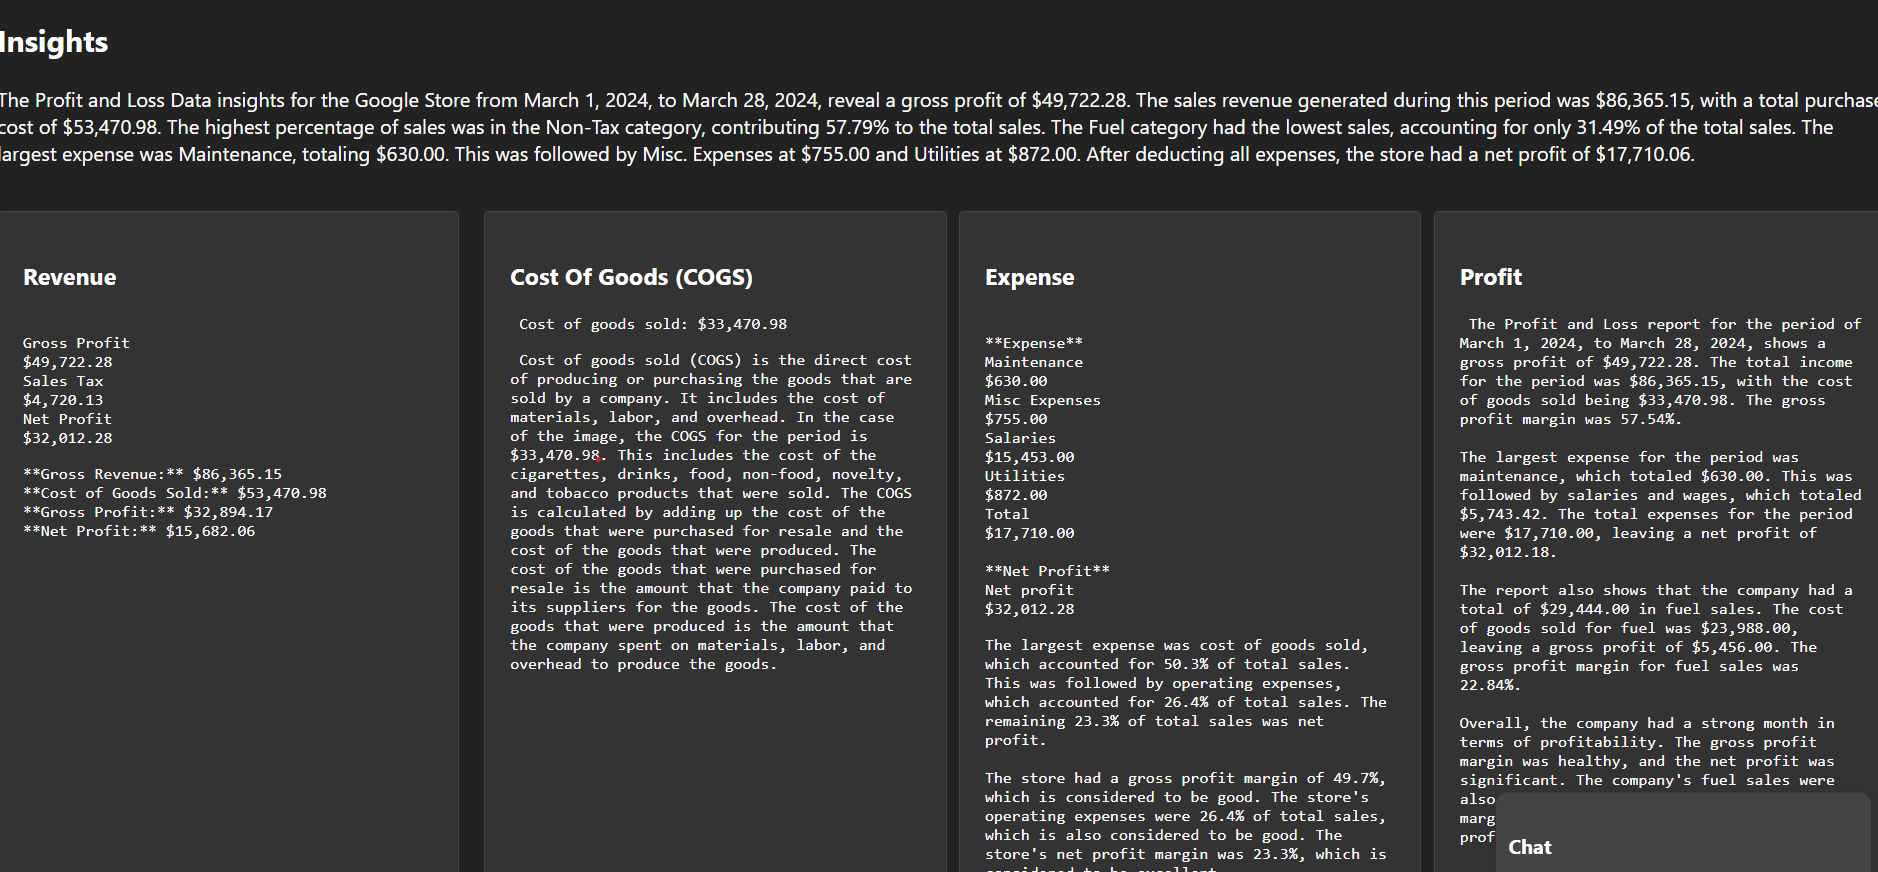
Interactive Insights Dashboard
The insights derived from the P&L data are presented in a comprehensive dashboard. This dashboard includes visual breakdowns of revenue, cost of goods sold (COGS), expenses, and net profit. It offers a user-friendly visualization of financial data, making it easier for owners to understand and act upon.
Cost Analysis
It goes further to break down the direct costs associated with goods sold, offering a granular view of where funds are allocated and where savings can be made.
Expense Tracking
The application tracks expenses across various categories, highlighting the largest expenditures and identifying potential areas for cost reduction.
Profit Maximization
It identifies the profit margins across different segments, enabling business owners to pinpoint the most and least profitable aspects of their operations.
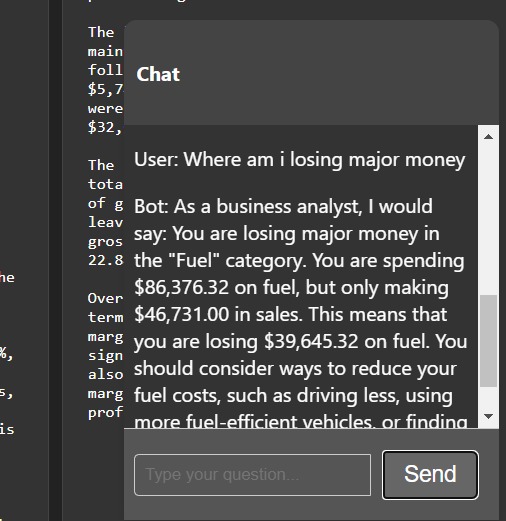
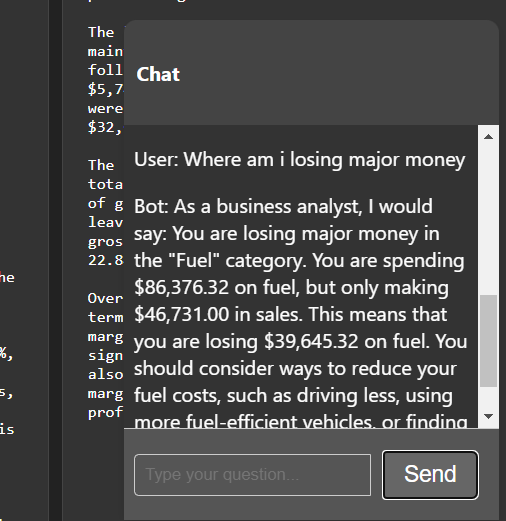
Interactive Chat Feature
There is an interactive chat feature that allows users to ask specific questions about their financial data, and receive customized advice based on their P&L reports. The chatbot component acts as a virtual business analyst, offering suggestions and answering queries related to financial performance.
Easy-to-Understand Language
The insights and suggestions are provided in straightforward language, making it easy for anyone, regardless of their financial literacy, to understand.
This application not only simplifies the process of financial analysis for small business owners but also empowers them to make data-driven decisions to enhance their profitability and efficiency.
How we built it
I built this application using React for the frontend to create a responsive user interface. On the backend, I utilized Node.js and Express to handle the file uploads and data analysis. The core of the P&L analysis is powered by a custom-built algorithm that I designed to parse screenshots and extract financial data using OCR (Optical Character Recognition) technology.
Accomplishments that we're proud of
I am particularly proud of the application's ability to accurately analyze and provide insights into P&L data from just a screenshot, making it accessible to business owners regardless of the format of their financial records. Additionally, integrating the interactive chat feature that provides tailored financial advice was a significant accomplishment that enhances the user experience.
What I learned
Throughout the development process, I learned a great deal about financial analysis and the importance of user-friendly design. Delving into OCR technology and data visualization also expanded my technical skill set. Most importantly, I learned that complex financial data could be made approachable and actionable for non-technical users.
What's next for Personal Business Analyst
Moving forward, the Personal Business Analyst will integrate real-time data feeds to provide up-to-the-minute financial insights. I'm also exploring the use of AI to offer predictive analysis, helping business owners not just understand their current financial health but also forecast future trends and outcomes.

Log in or sign up for Devpost to join the conversation.