-

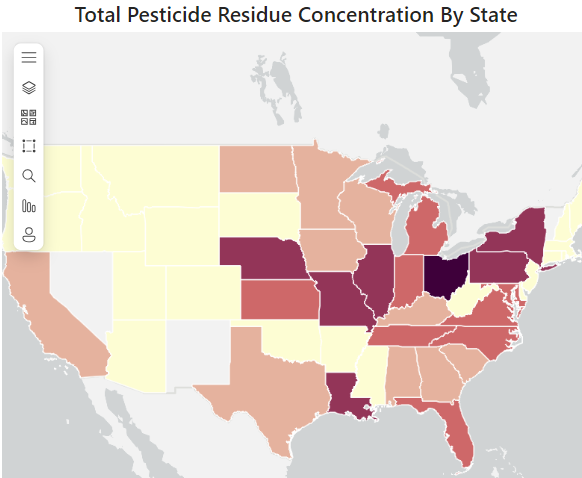
pesticide heatmap
-
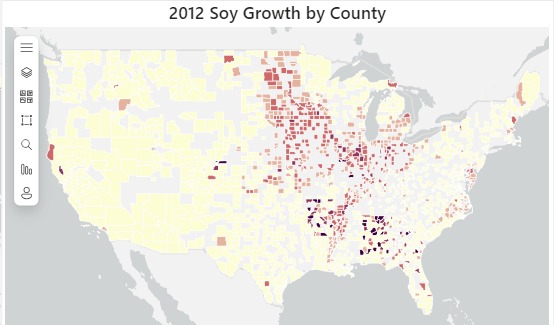
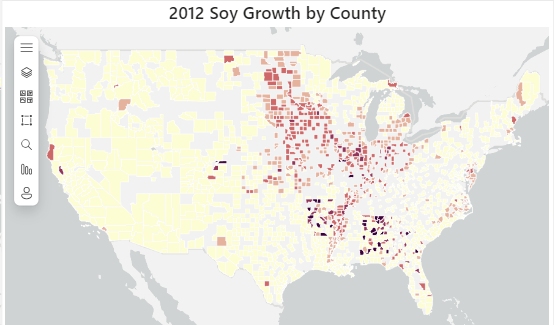
soy
-
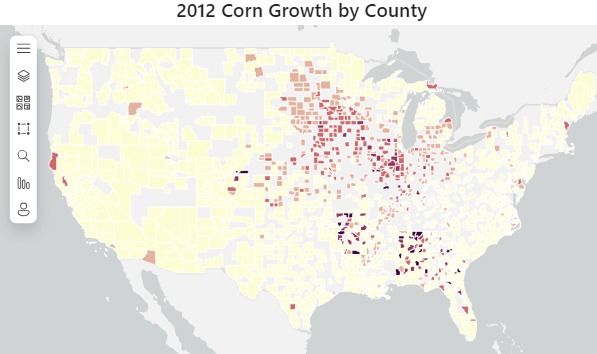
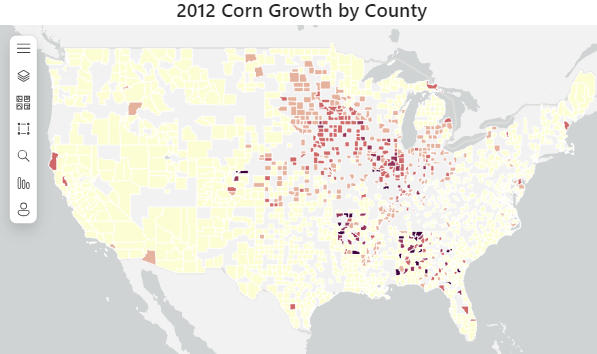
corn
-
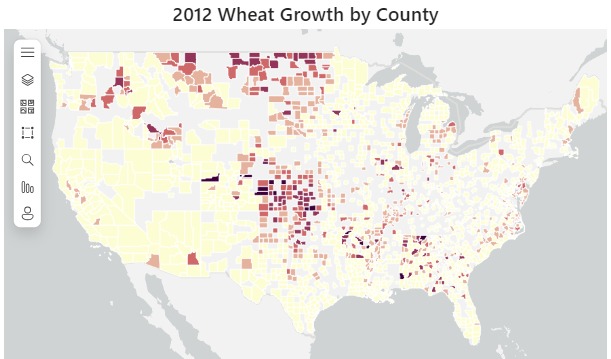
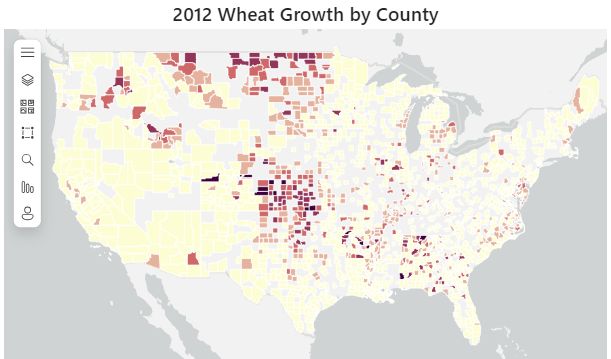
wheat
-
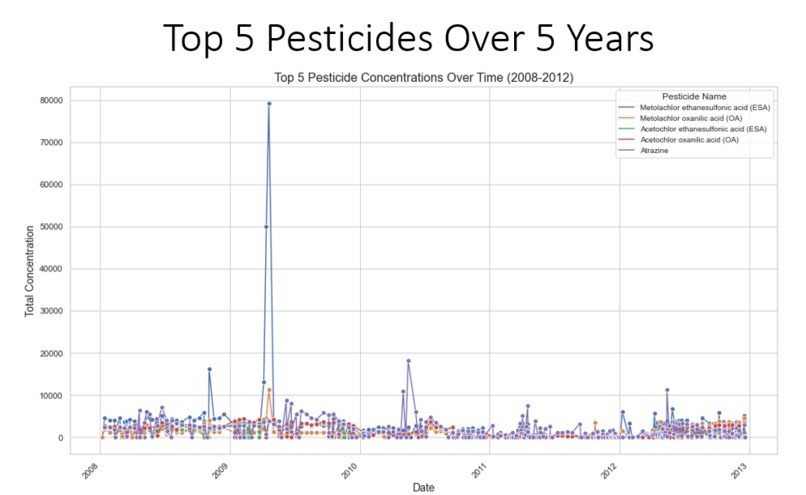
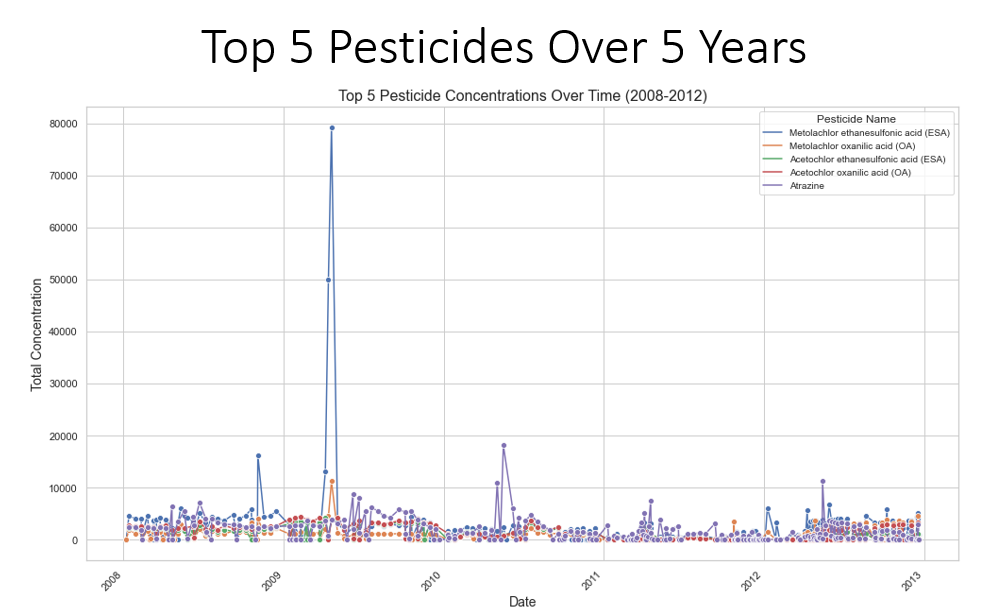
Pesticide Use Over Time
-
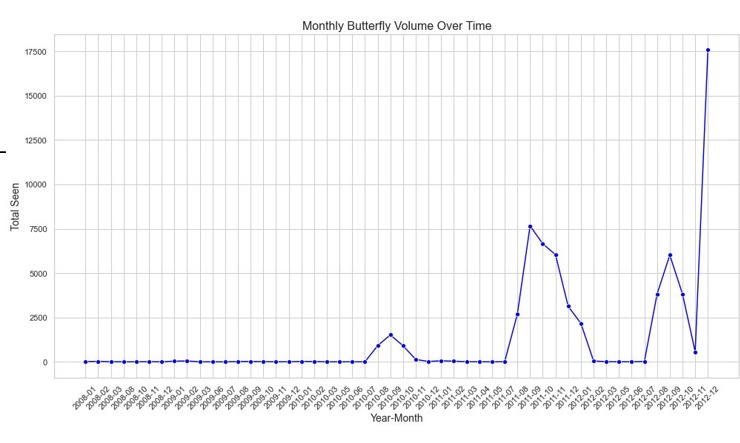
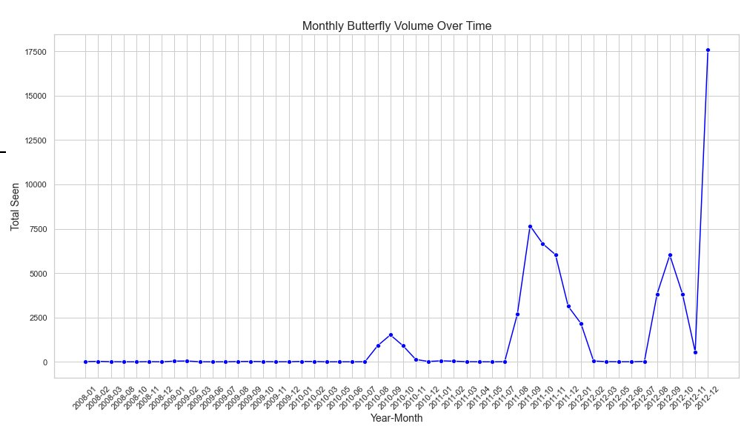
Sighting Data
We were inspired by the impact this project has on both our environment and the communities that ## surround it.
This project looks at the top 5 pesticides used in the United States and looks at where top
agricultural regions exist
We used python, power bi, and power point to communicate our findings
Some of the issues we encountered was the accuracy of the provided data, our own time limitations,
the limited fields, and our ability to scrape or gather data in a systematic way.
We are proud of being able to see which pesticides are most prevalent in our environment and how
over the years they continue to remain.
We learned there are so many different approaches to review the data, and that it can be hard to narrow it down.
Given more time, we would like to find the exact pesticides that are being sprayed in those locations
where the butterfly decline is most sharply decreasing.
Built With
- powerbi
- python

Log in or sign up for Devpost to join the conversation.