Inspiration
Smog advice assumes you can stay home. In Lahore, 56% of monitor-hours in our test period (Apr 2025 to Oct 2026) had a next-24-hour average that was Unhealthy or worse (US EPA 2024 categories). Delivery riders, construction workers, vendors, children and schools can't just stay indoors. What exists today is one number, no range, no advice, and rarely any Urdu. A school has to decide by 6 PM. A rider's shift is set the night before.
What it does
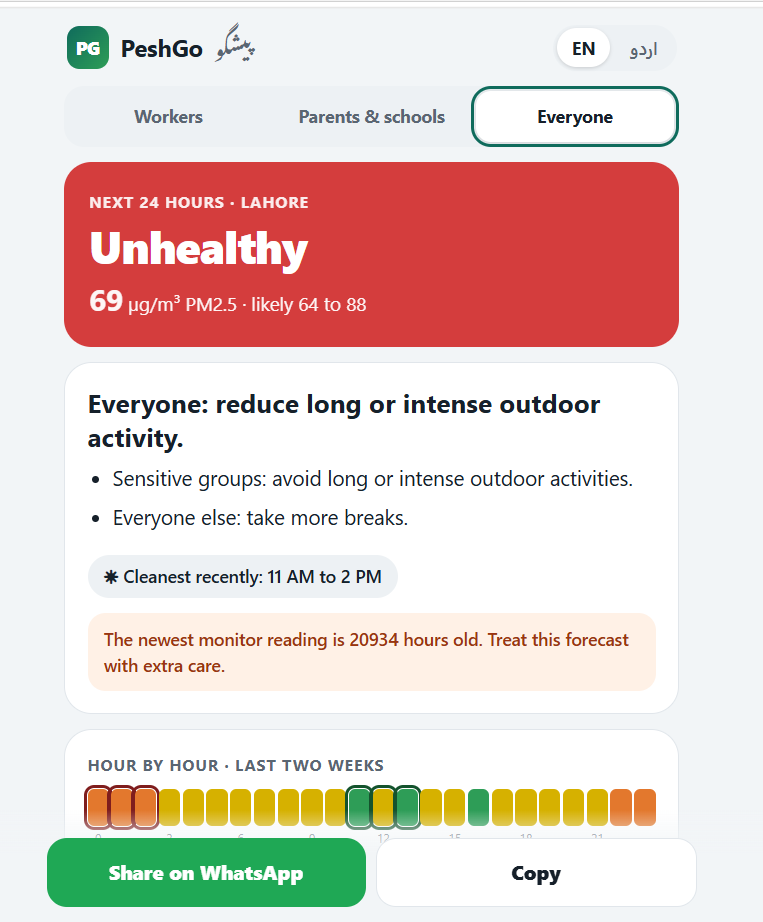
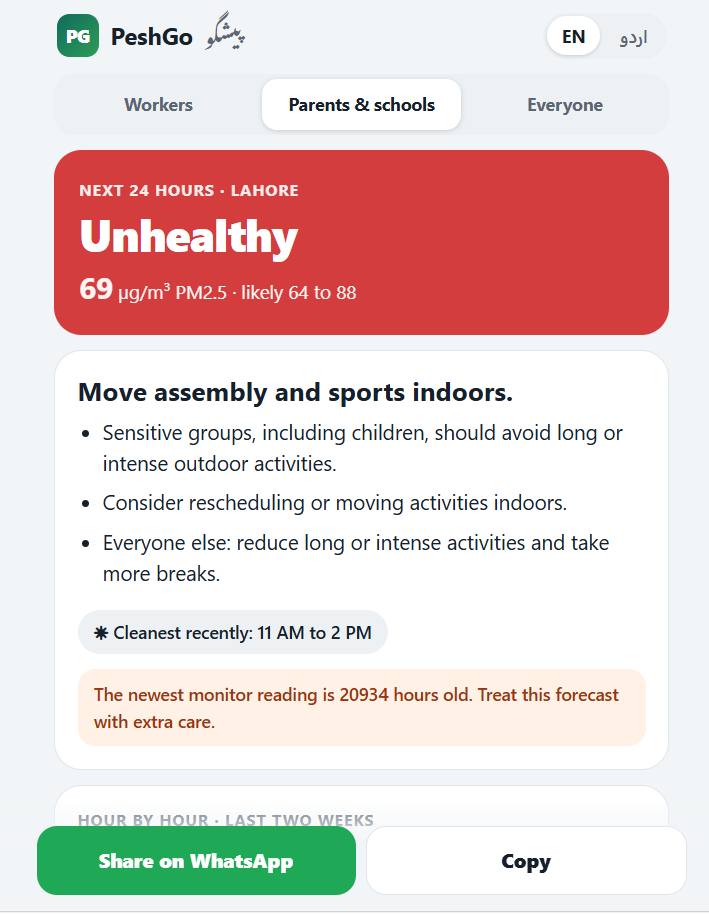
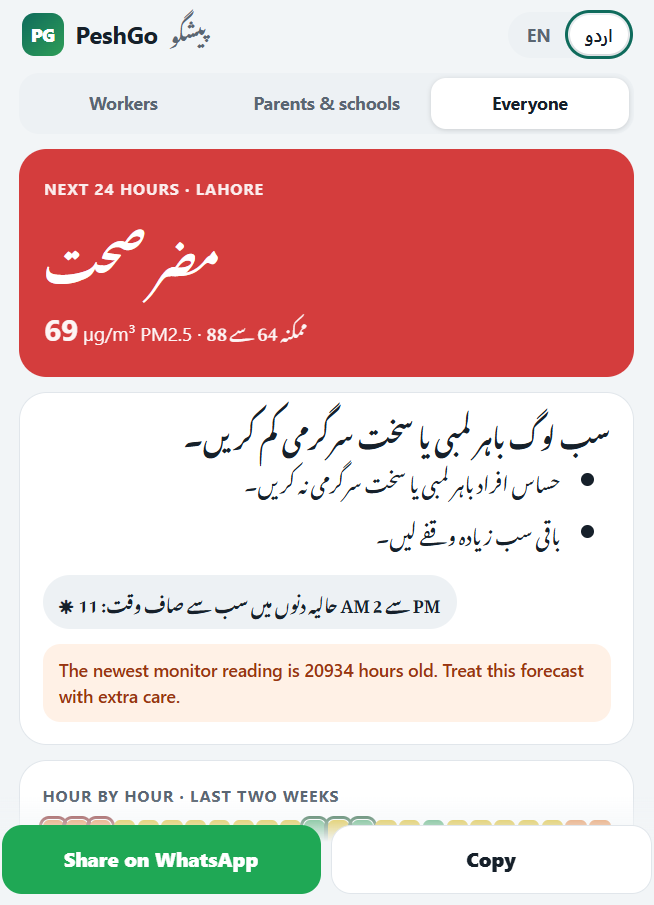
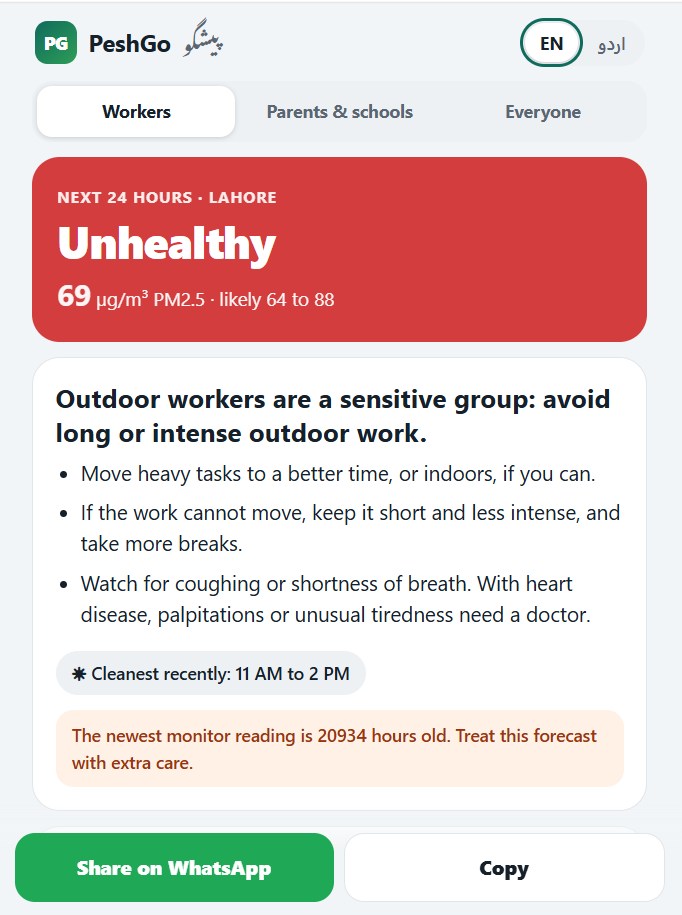
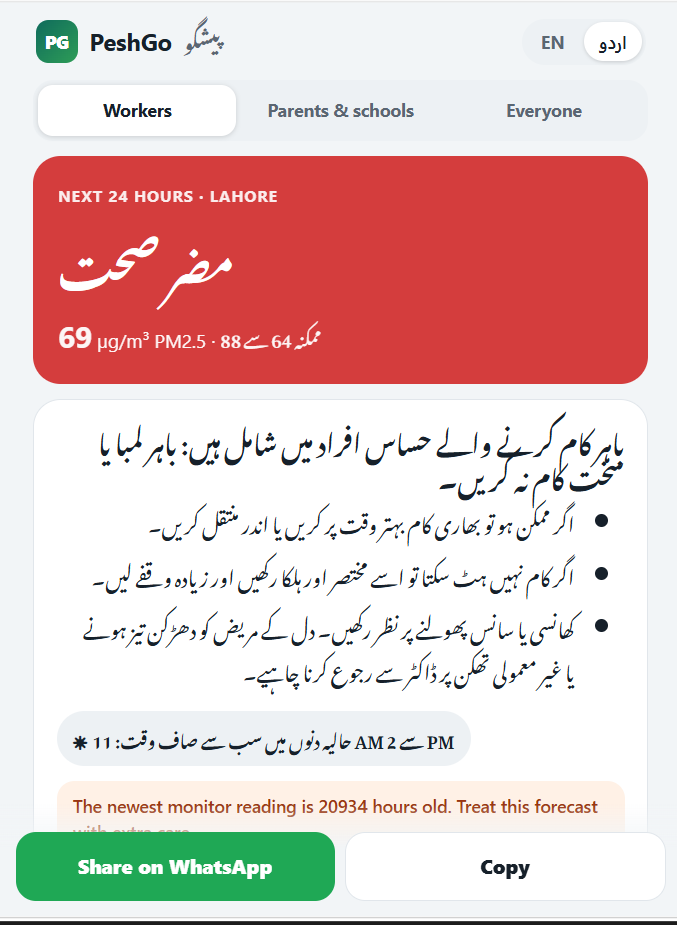
PeshGo (پیشگو) forecasts Lahore's next-24-hour PM2.5 and turns it into something people can act on:
- the category, the number and a likely range (80% interval), e.g. 135 µg/m³, likely 95 to 219
- audience-specific advice (workers, parents and schools, everyone) taken from the US EPA particle-pollution guide
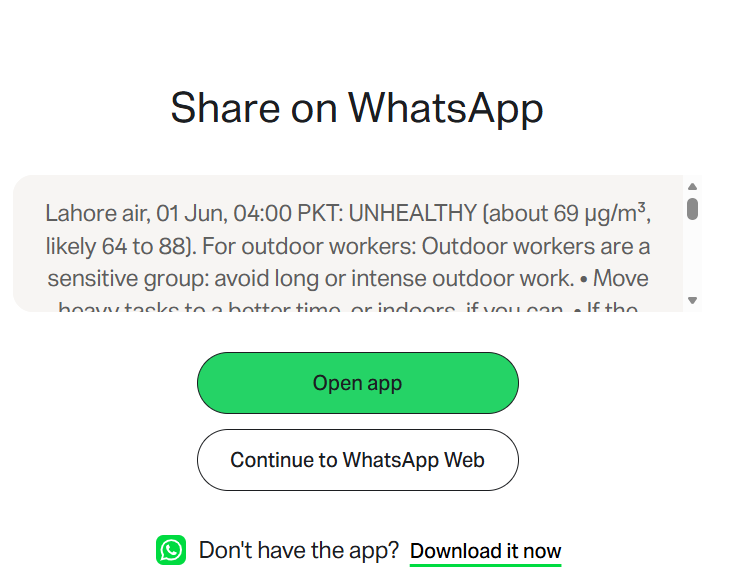
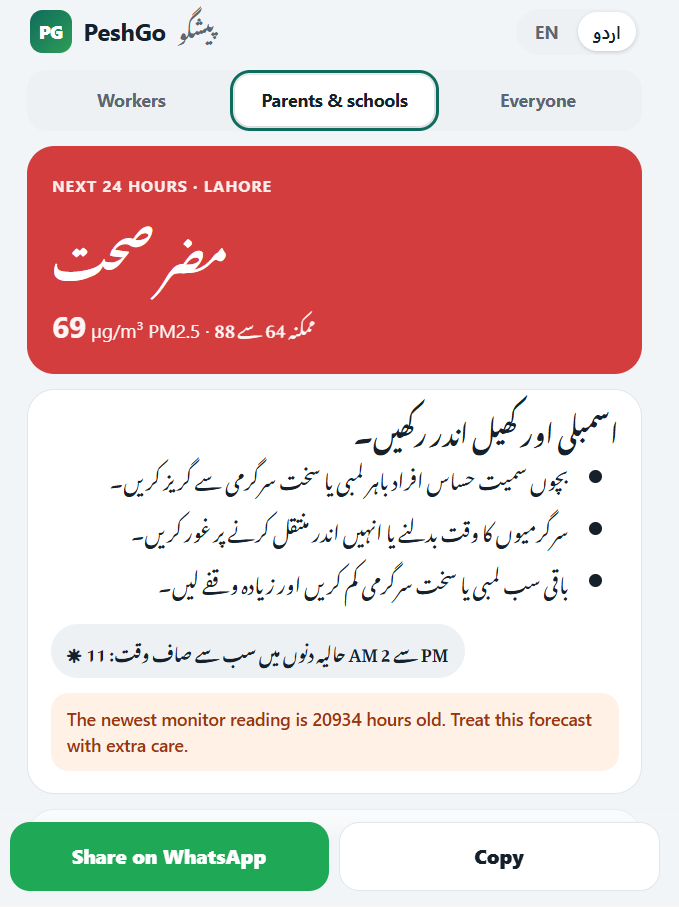
- Urdu or English in one tap, with WhatsApp sharing
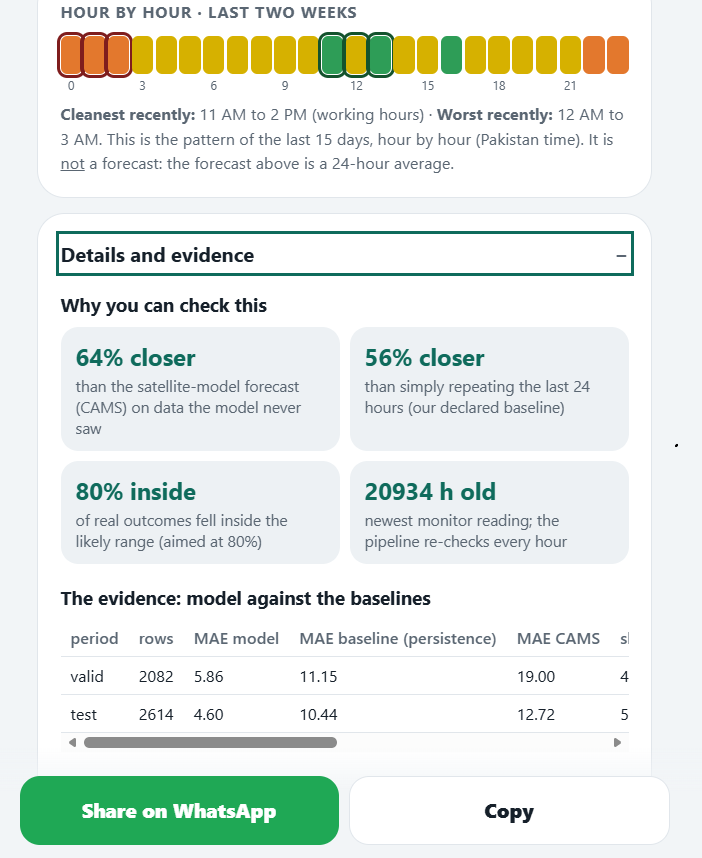
- the cleanest hours of the last 15 days, clearly labelled as not a forecast
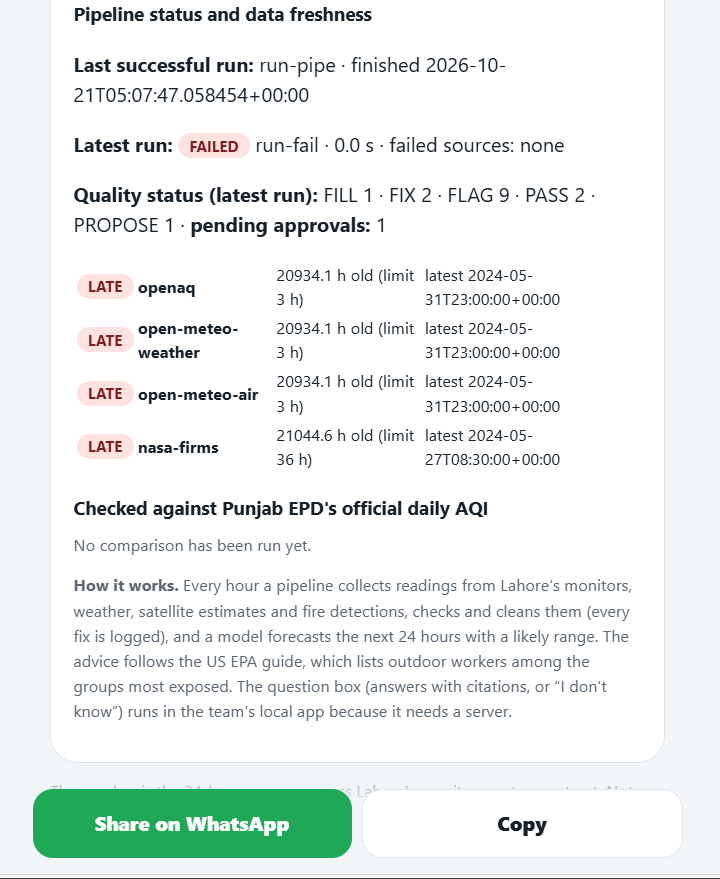
- the age of every data source, so users can see how fresh the inputs are
- a Q&A box that quotes a trusted source or says "I don't know" (local app only)
How we built it
Data. Four real public sources, no synthetic data:
- OpenAQ v3: 543,283 hourly PM2.5 rows from 78 monitors
- Open-Meteo ERA5: weather
- Copernicus CAMS: satellite-model PM2.5
- NASA FIRMS: upwind fire detections
Every raw file is stored unchanged with a SHA-256 hash in manifest.csv.
Pipeline. An hourly Prefect flow does the following:
- Fetch from the four APIs.
- Verify the raw files.
- Run the Data Quality Agent.
- Rebuild the DuckDB gold tables.
- Forecast.
- Publish the app to Hugging Face.
Every run is logged in runs.csv.
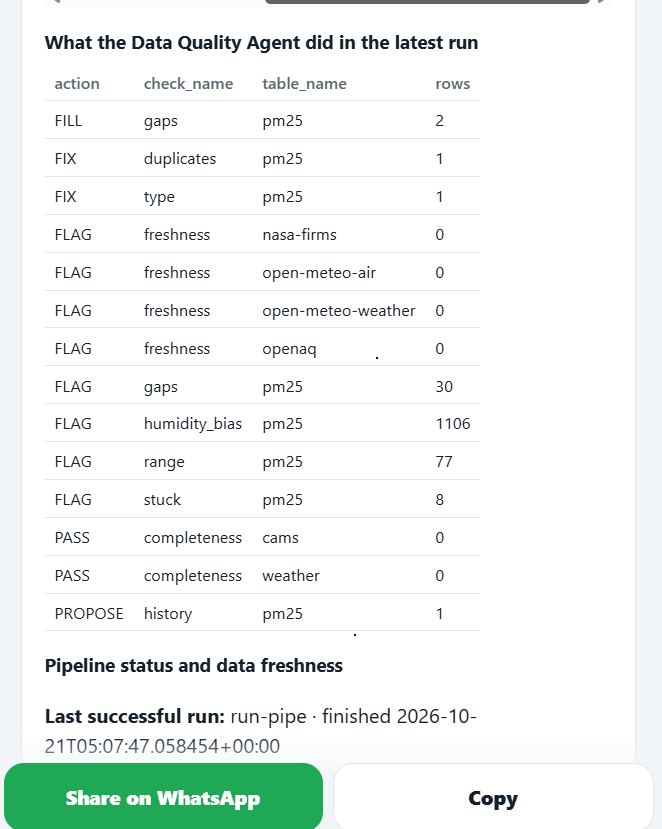
Data Quality Agent. It checks gaps, stuck values, duplicates, drift (PSI) and humidity bias in low-cost sensors. It fixes small things itself, flags what it shouldn't invent, and proposes risky steps such as dropping a sensor for a person to approve. Every decision is logged.
Model. Gradient-boosted trees (scikit-learn), one each for the 10th, 50th and 90th percentile. The train/validation/test split was fixed in config.yaml before training, with a 24-hour purge. The raw 10–90% band held only 54% of validation outcomes, so we calibrated it (conformal) to reach 80%. The error we report is the mean absolute error:
$$\text{MAE} = \frac{1}{n}\sum_{i=1}^{n}\left|\hat{y}_i - y_i\right|$$
Insight Agent. TF-IDF retrieval over four trusted documents (WHO, US EPA, Punjab Clean Air Action Plan) returns real quotes with the source named. Forecast numbers are read from stored rows. There is no language model at runtime.
Results
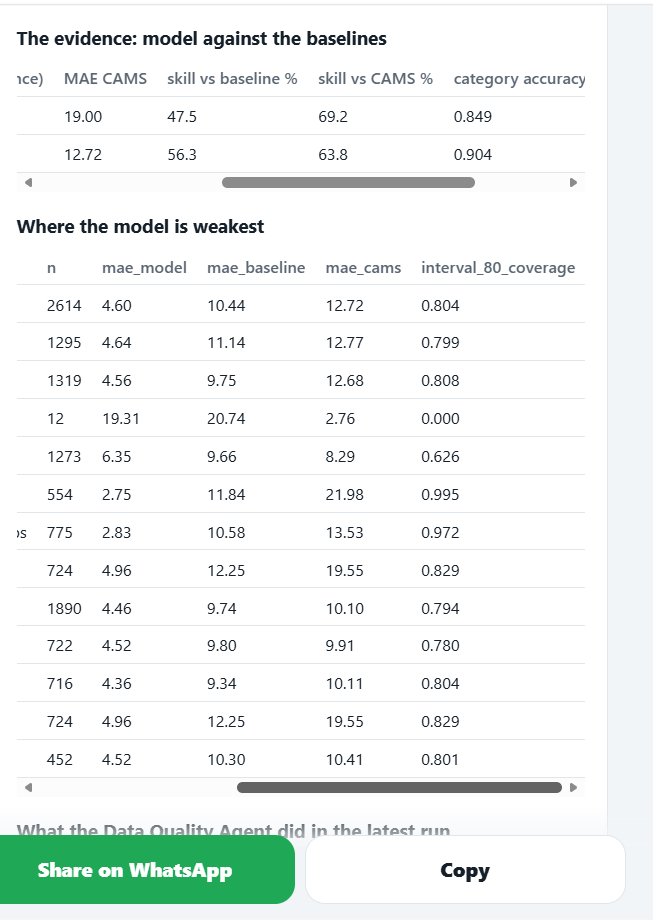
- 19.19 µg/m³ test MAE, 50.8% lower than CAMS (38.98)
- 15.8% lower than persistence in winter (38.35 vs 46.05), with the right category 75% vs 69% of the time
- 92% of test outcomes fell inside the 80% range
Challenges
- Peaks are under-predicted. On hazardous hours, our MAE is 51.3 vs 37.1 for persistence, and the range holds only 68% of them.
- Over the full test period we are 3.7% worse than persistence (19.19 vs 18.28), effectively a tie. We report that as it is.
- Short training history. Most low-cost monitors went online after Oct 2024, so training has 19,095 rows. We kept the split we declared rather than move it to look better.
- We threw away a better-looking result. A sensor-identity feature changed when sensors were added, so we removed it, retrained and re-scored on the full period.
- Missing data. Boundary-layer height was missing for 4,368 hours. We left it missing rather than filling months of weather.
What we learned
Declaring the baseline and the split first, and reporting where we lose, made the project more honest and more useful. A calibrated range matters more than a confident number.
Limits
The forecast is a city-wide average, not your street. It is information, not medical advice. The app makes no mask claims, because none of our cited sources covers them. The Urdu was drafted with AI help and still needs a native reader's review. AI use is disclosed in AI_Use_Log.md.
What's next
- A field test with delivery riders and two schools
- Native Urdu review, plus voice notes for riders
- Monthly retraining through winter, and forecasts by area of the city
- A published comparison against Punjab EPD's official AQI ## Accomplishments that we're proud of
Built With
- copernicus-cams
- duckdb
- gradient-boosting
- gradio
- huggingface
- huggingface-spaces
- joblib
- nasa-firms
- numpy
- open-meteo
- openaq
- pandas
- pandera
- prefect
- pyarrow
- pytest
- python
- requests
- scikit-learn
- setuptools
- tf-idf

Log in or sign up for Devpost to join the conversation.