-
-
Dashboard
Inspiration
Managing money is something everyone struggles with — students, working professionals, and even families. Most finance apps are either too complex or too expensive, which often discourages people from using them. I wanted to create something simple, affordable, and useful for everyone to track income, expenses, savings, and budgets in one place. The idea was to combine professional data visualization with a user-friendly design that even non-technical people could use with ease.
What it does
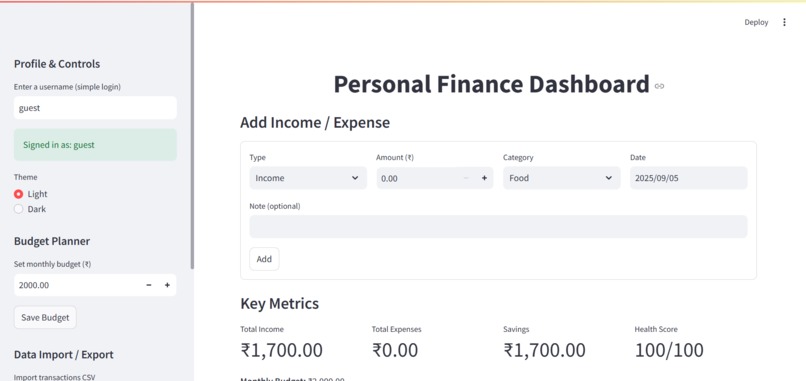
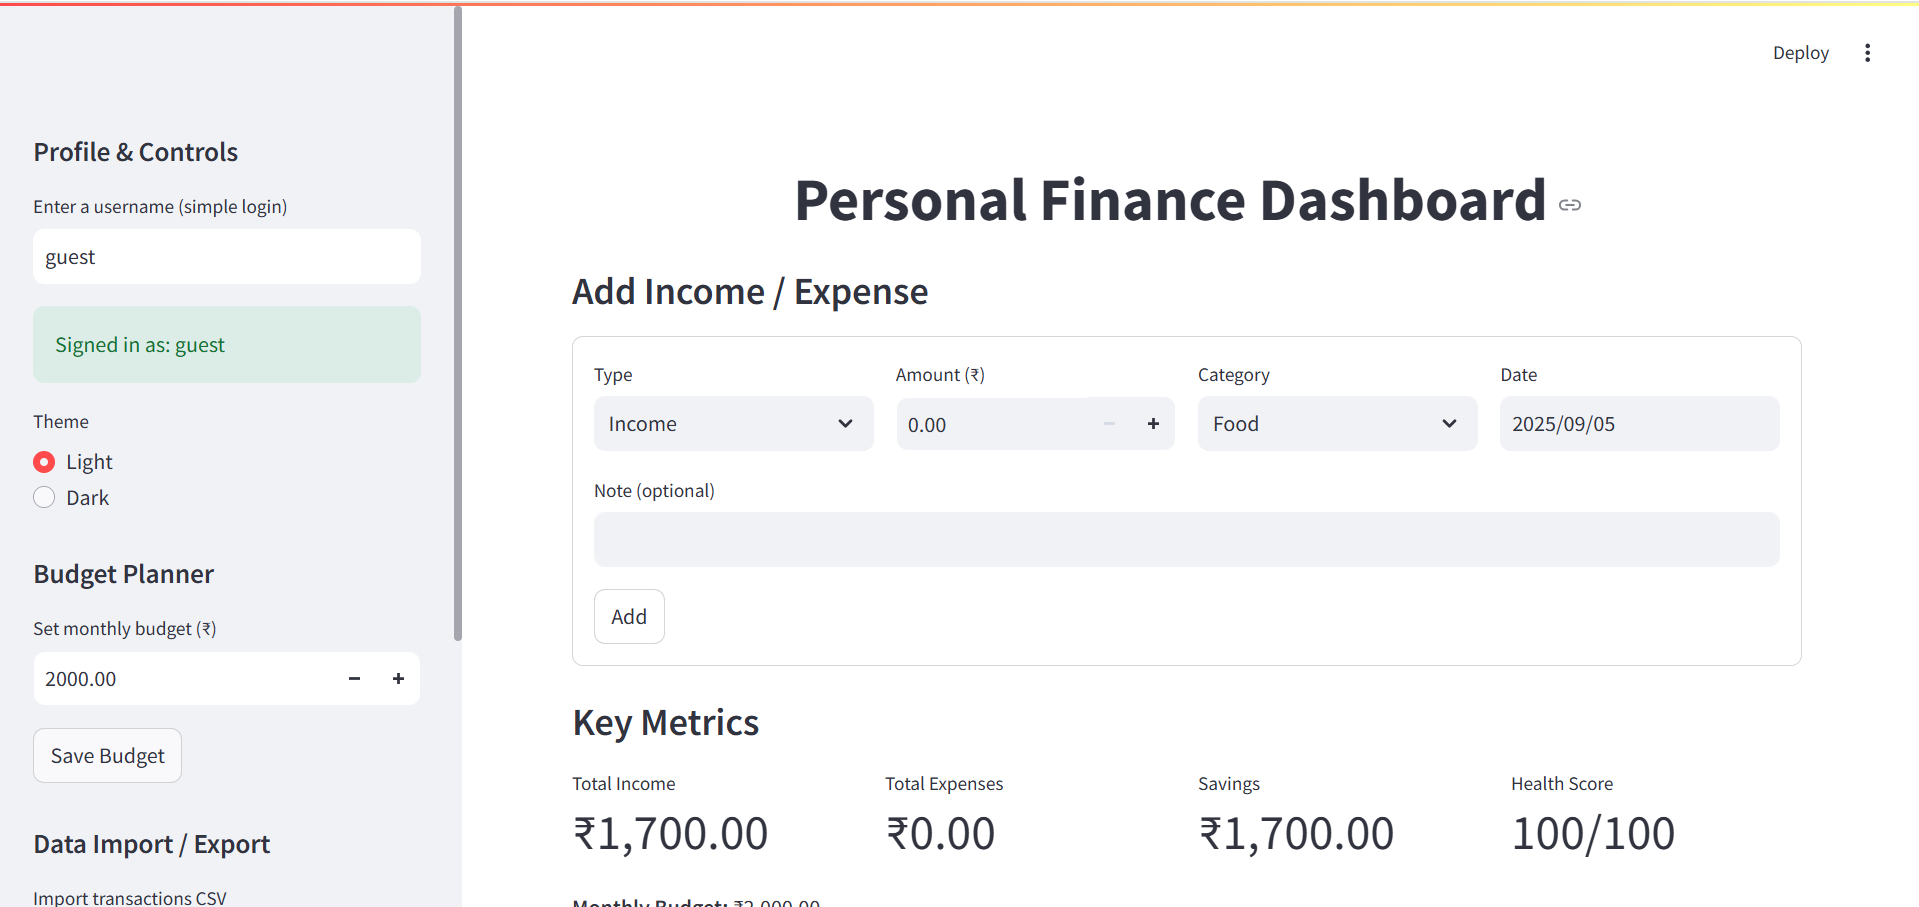
The Personal Finance Dashboard allows users to add their income and expense transactions, plan their budgets, and receive a financial health score that reflects their spending habits. It provides interactive charts to help understand where money is going, gives insights into savings growth, and even generates automated reports that can be exported as CSV or PDF. In short, it makes money management both interactive and engaging while empowering users with the right financial insights.
How we built it
The project was developed using Python and Streamlit to build the frontend interface, while SQLite was used as the backend database for storing user data. Pandas along with Matplotlib and Plotly handled the data visualization, creating charts that update instantly whenever new transactions are added. ReportLab was used to generate professional-looking PDF reports. A simple login system provided multi-user support, and CSV import/export functionality was added so that users could back up their data. The design was intentionally kept minimal, modern, and accessible, with dark mode to improve the user experience.
Challenges we ran into
One of the biggest challenges was keeping the app simple enough for non-technical users while still providing advanced features for those who wanted deeper financial insights. Creating charts that updated in real-time was also tricky, especially when dealing with multiple types of visualizations. Designing a meaningful financial health scoring system took time, since it needed to fairly reflect spending and saving behaviors. Another challenge was balancing the ambition of adding advanced features with the limited time available during the hackathon.
Accomplishments that we're proud of
We are proud of being able to build a fully functional finance dashboard that not only works but also looks professional and intuitive. The project successfully blends data visualization with financial management and makes it accessible to a wide range of users. Implementing PDF export and CSV import/export felt like a big achievement because it makes the project practical for real-world use. Most importantly, the app has the potential to be impactful for both students and professionals, which was the core vision from the start.
What we learned
This project taught us how to effectively combine data science, visualization, and UI design into one unified application. We learned how important it is to make projects usable for both technical and non-technical audiences, and how to design for clarity as well as functionality. It also gave us experience in building Streamlit apps that are scalable and clean. On top of the technical lessons, we realized just how critical time management is during a hackathon when balancing multiple ideas and features.
What’s next for Personal Finance Dashboard
The next step for this project is to bring in AI-powered financial advice that can offer users personalized suggestions for improving their money habits. We also want to enable synchronization across multiple devices, making it possible for users to track their finances from both mobile and web. Another future plan is to integrate with banking APIs so that transactions can be fetched automatically, reducing manual entry. Ultimately, the vision is to make this an open-source platform where anyone can contribute, extend, and improve the dashboard.
Built With
- dependency
- environment
- heroku
- languages:-python-frameworks-&-libraries:-streamlit-(ui)
- linux)-cloud/deployment-options:-streamlit-cloud
- macos
- matplotlib-&-plotly-(visualizations)
- or-aws-(for-hosting)-other-tools:-github-(version-control)
- pandas-(data-handling)
- reportlab-(pdf-generation)-database:-sqlite-(local-storage-for-transactions-&-users)-platforms:-cross-platform-(windows
- virtual

Log in or sign up for Devpost to join the conversation.