Inspiration
Amazon Alexa & Google Sheets
I've been tracking my time the last month with a command-line timer I built. From March 3rd to April 10th I've logged 358 hours. Here are some problems with my command-line timer:
- I have to carry my computer around with me to track time.
- I have to open a new terminal and modify a TypeScript file.
I started using the Google Sheets API to store time logs, an improvement over having my logs spread across hundreds of JSON files.
I realized that most people know how to work a spreadsheet and that a voice interface would make this sort of tracking accessible to people that aren't programmers.
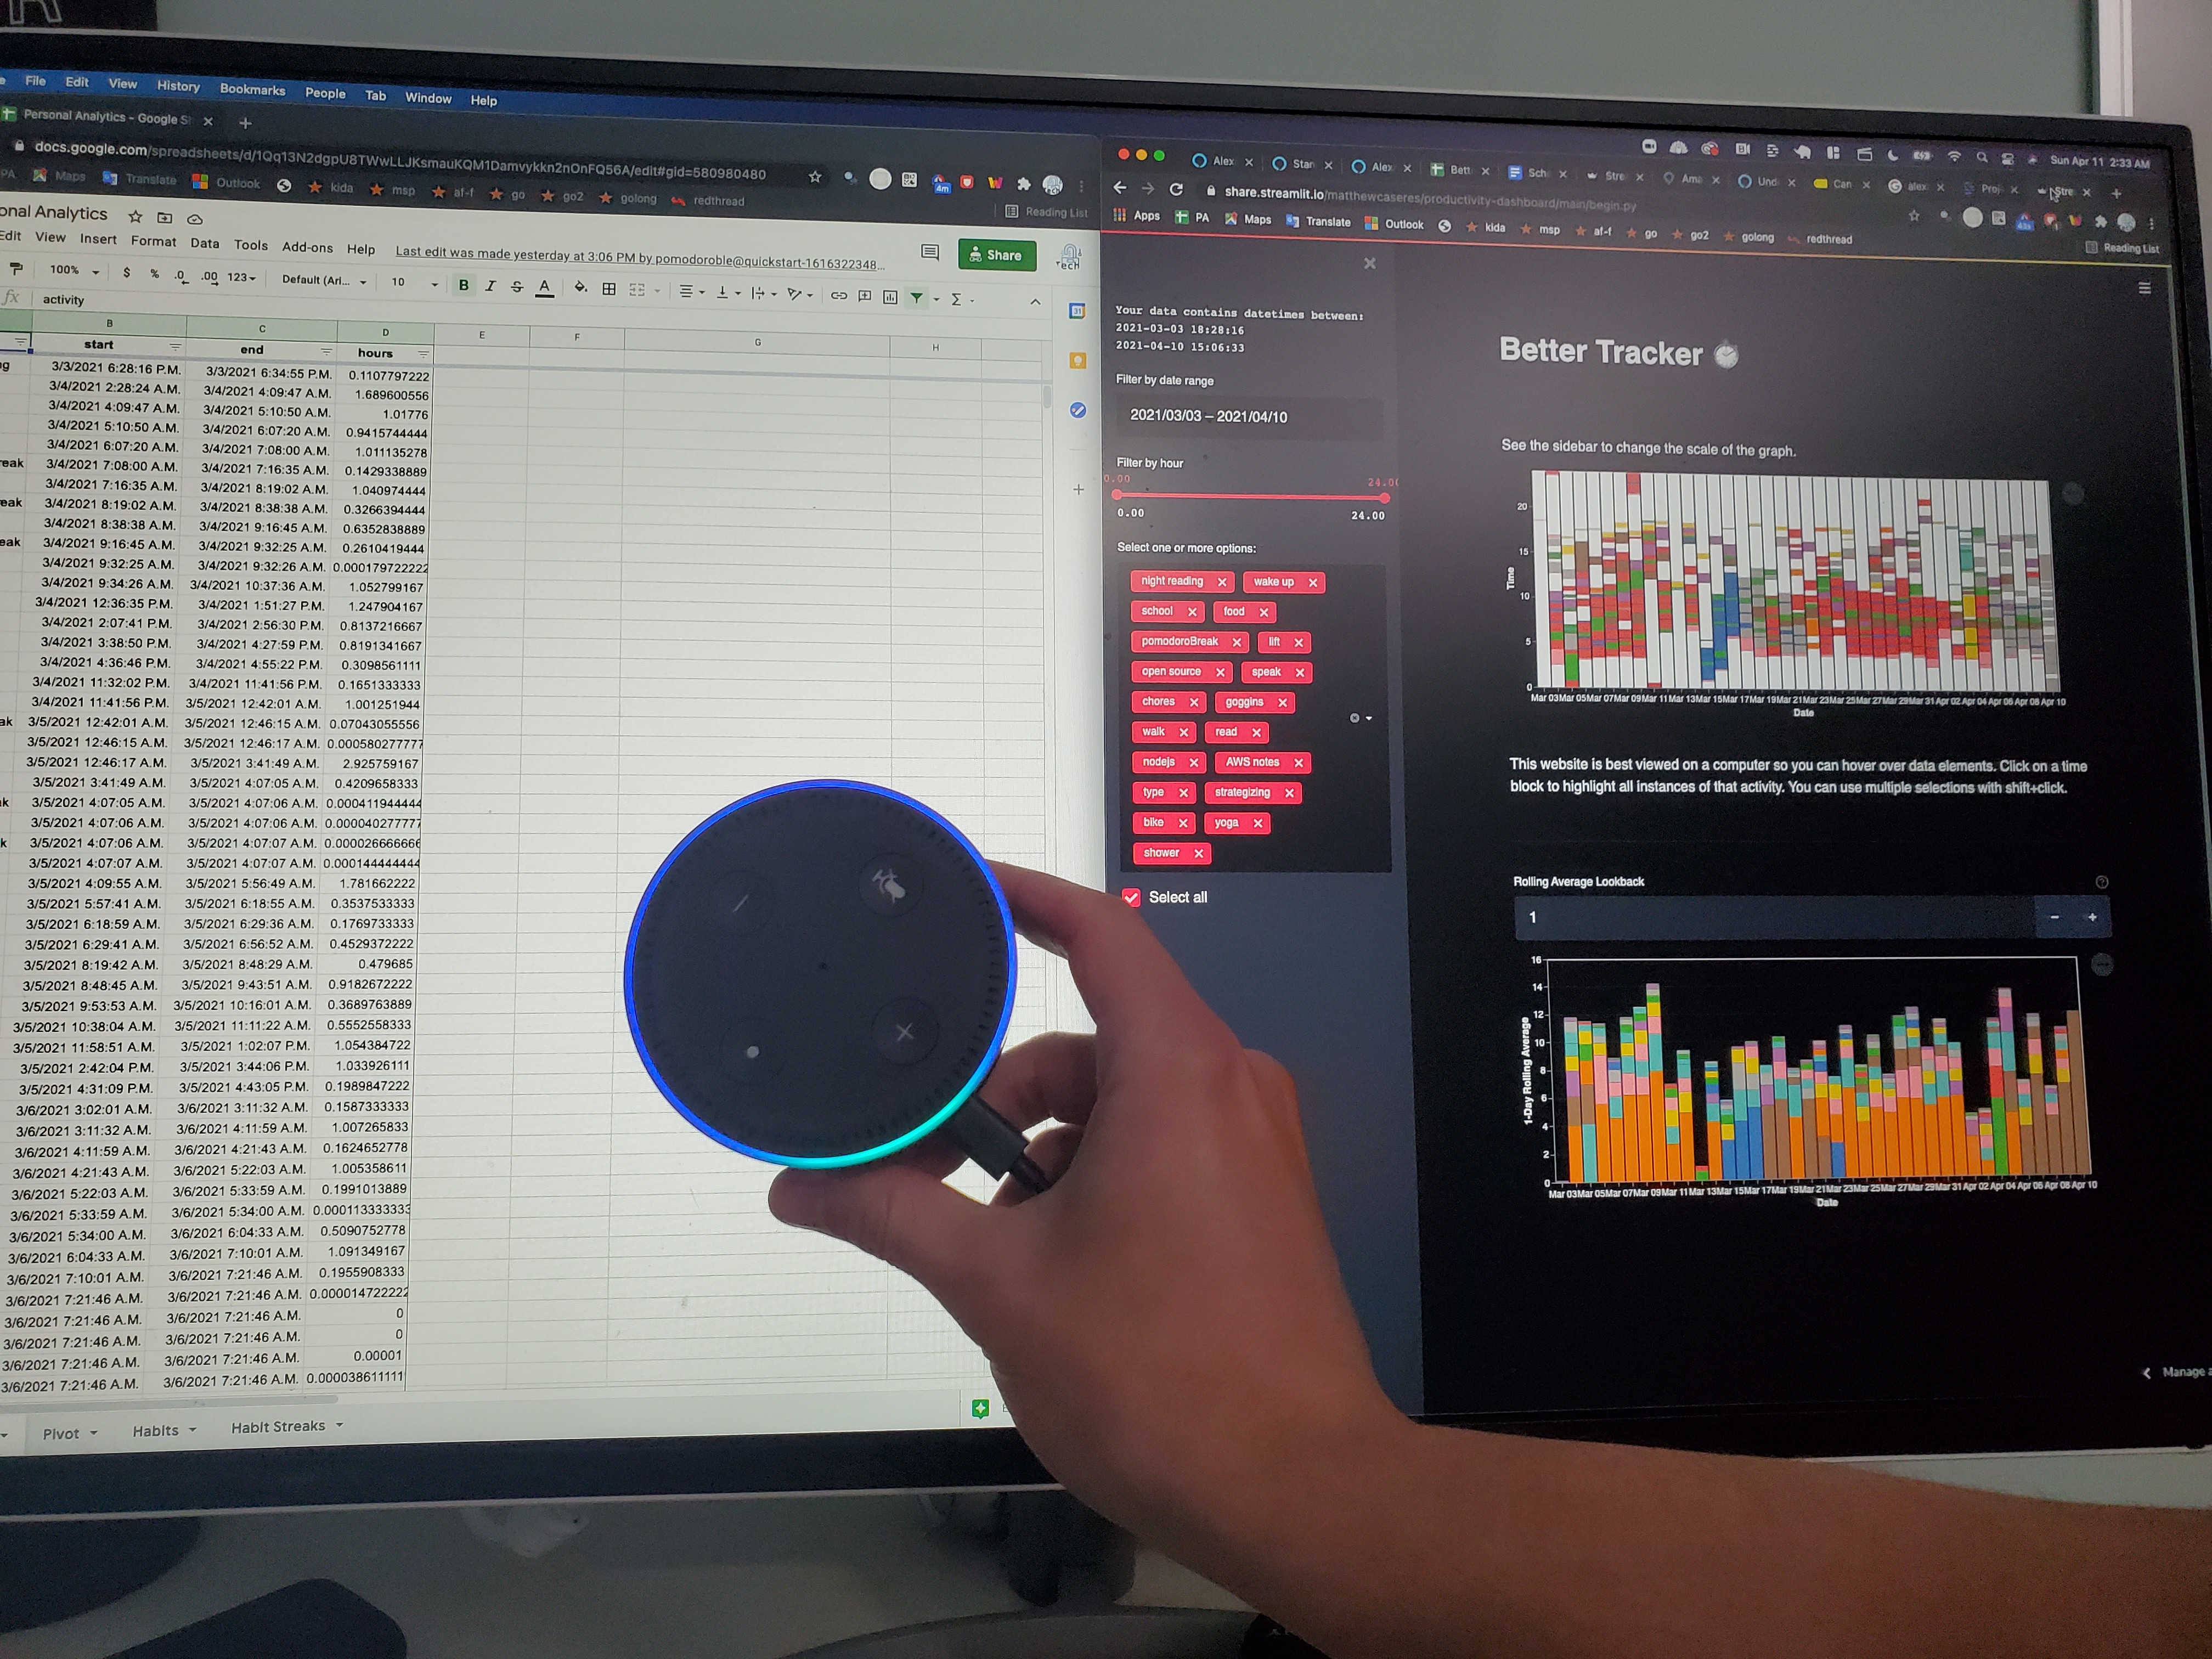
Streamlit Dashboard
I wanted to set up a dashboard that reads directly from the Google Sheet so I can get interactive analytics without having to run a script.
What it does
Amazon Alexa & Google Sheets
Users link their Google account to Alexa. They define a map of numbers to activities in a Google sheet. Start a timer by saying-
Alexa, tell better tracker to track {number} This will start a timer for the activity listed in the cell
mappings!A{number}. More on why we can't just have users saying anything they want later. When you finish the timer or switch to a different activity the data will be logged in your Google Sheet.
Streamlit Dashboard
An interactive dashboard that provides a detailed, interactive, calendar-like view of the way you spend your time.
How we built it
Amazon Alexa & Google Sheets
I used the Node.js SDK for Alexa and Alexa Developer's online development environment. DynamoDB is used to persist the state before writing to the sheet, and is cleared upon writing. AWS Lambda handles requests and responses.
I have users link their Google account with their Alexa account to provide permissions for my appliication to create a file and work within that file (I do not have access to all files, only the one I create). When the user first invokes the command we set up a new spreadsheet for them (batteries/pivot tables included) using HTTP requests with Node.js to the Google API authenticated with the access token Amazon gives us via OAuth2. We store the ID of that sheet and then are ready to start writing into the sheet when necessary.
Streamlit Dashboard
I used Streamlit for the dashboard, Altair for the visuals, and Pandas for the calculations. Before the contest I made one of the graphs from the dashboard just to see what visualization/dashboarding frameworks were good. One of the graphs in my dashboard was made before the contest. This helped give me the skills to produce the rest of the website during the hackathon, I had to give about 5 hours of focused work to create the second graph and the interactive widgets.
Challenges we ran into
I had two friends sign up to do the contest with me that backed out days before because they didn't have time!
Amazon Alexa & Google Sheets
I was totally crushed when I found out Alexa didn't accept arbitrary input. To improve accuracy they make you only accept user input as a number/name/animal/celebrity/etc. I moped for a bit and then figured I could let the users define a mapping from number to activity in their google sheet. So whenever the user says "3" Alexa can look up the cell mappings!A3.
We have to get the zone of the user's Alexa device and write to our sheet with the correct time for their zone. Also Google has their own epoch of "days since December 30th 1899", but this epoch is not absolute, it happens independently across different zones. Mostly I just had to accept some errors on daylight savings time and figure out how to do the conversion from ISO to SERIAL_NUMBER correctly.
I had no clue how to make Alexa Skills before this. I had tried several times and it always ended in frustration and me not getting past the "cake walk" tutorial. After about 7 hours of not really understanding how stuff worked I started to figure it out. Here are some of the things that are frustrating:
- The online editor has no intellisense.
- You cannot debug very easily (no debugger, no console.log) since your code is running in a serverless function. So you need to figure out how to find the correct CloudWatch log but I didn't take the time to figure it out and was coding "blind" most of the time.
- There is so much documentation and some of it is not that great!
Streamlit Dashboard
I had created the first graph before the contest, and spent a lot of time pondering how to make the second graph as well. This one went really smooth because of the prep I did ahead of time.
Accomplishments that we're proud of
I'm super proud of all the work I did and for perservering and finding workarounds when things looked rough. I like being my own user of technology that I build so I think I'm going to have a lot of fun using this tool.
What we learned
I learned it takes time to get into a workflow. The Python work was super smooth since I already had a third of the code written. That third of the code was two thirds of the battle because of what I learned while writing it.
After spending all this time fighting with Alexa and the online editor I feel a lot more confident in my ability to mess around with the Alexa Skills Kit for Node.js.
I also learned that I don't like the online editor and am looking forward to setting up a local dev environment with TypeScript support.
What's next for Personal Analytics
To me, it's a finished product. I like simplicity and I don't want to add anything more.
What I really want to do is to use it to better understand myself and how I spend my time.
I've been using data generated from my pomodoroble Node.js library to track my sleep. Tracking sleep patterns for me is helpful because when I have poor sleeping patterns my mental health often takes a blow as well.. I think environment plays a big factor in mental health and environment isn't just the walls around you, it's what you do inside those walls and the self-care routines you have established.


Log in or sign up for Devpost to join the conversation.