-
-

Persil splash screen shown on app launch.
-
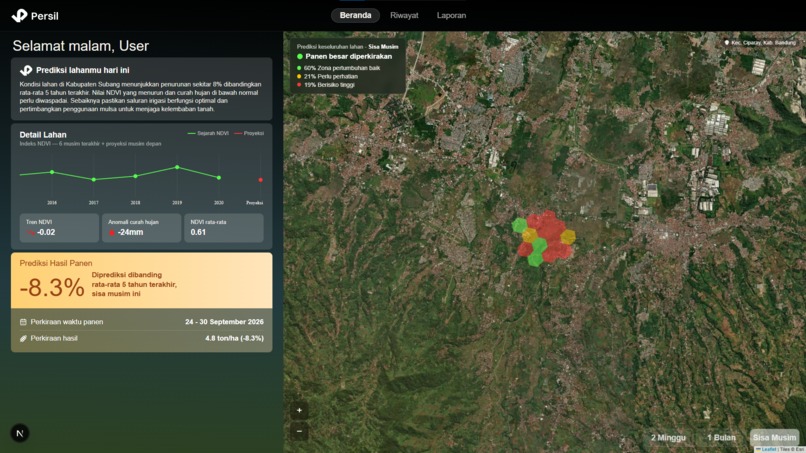
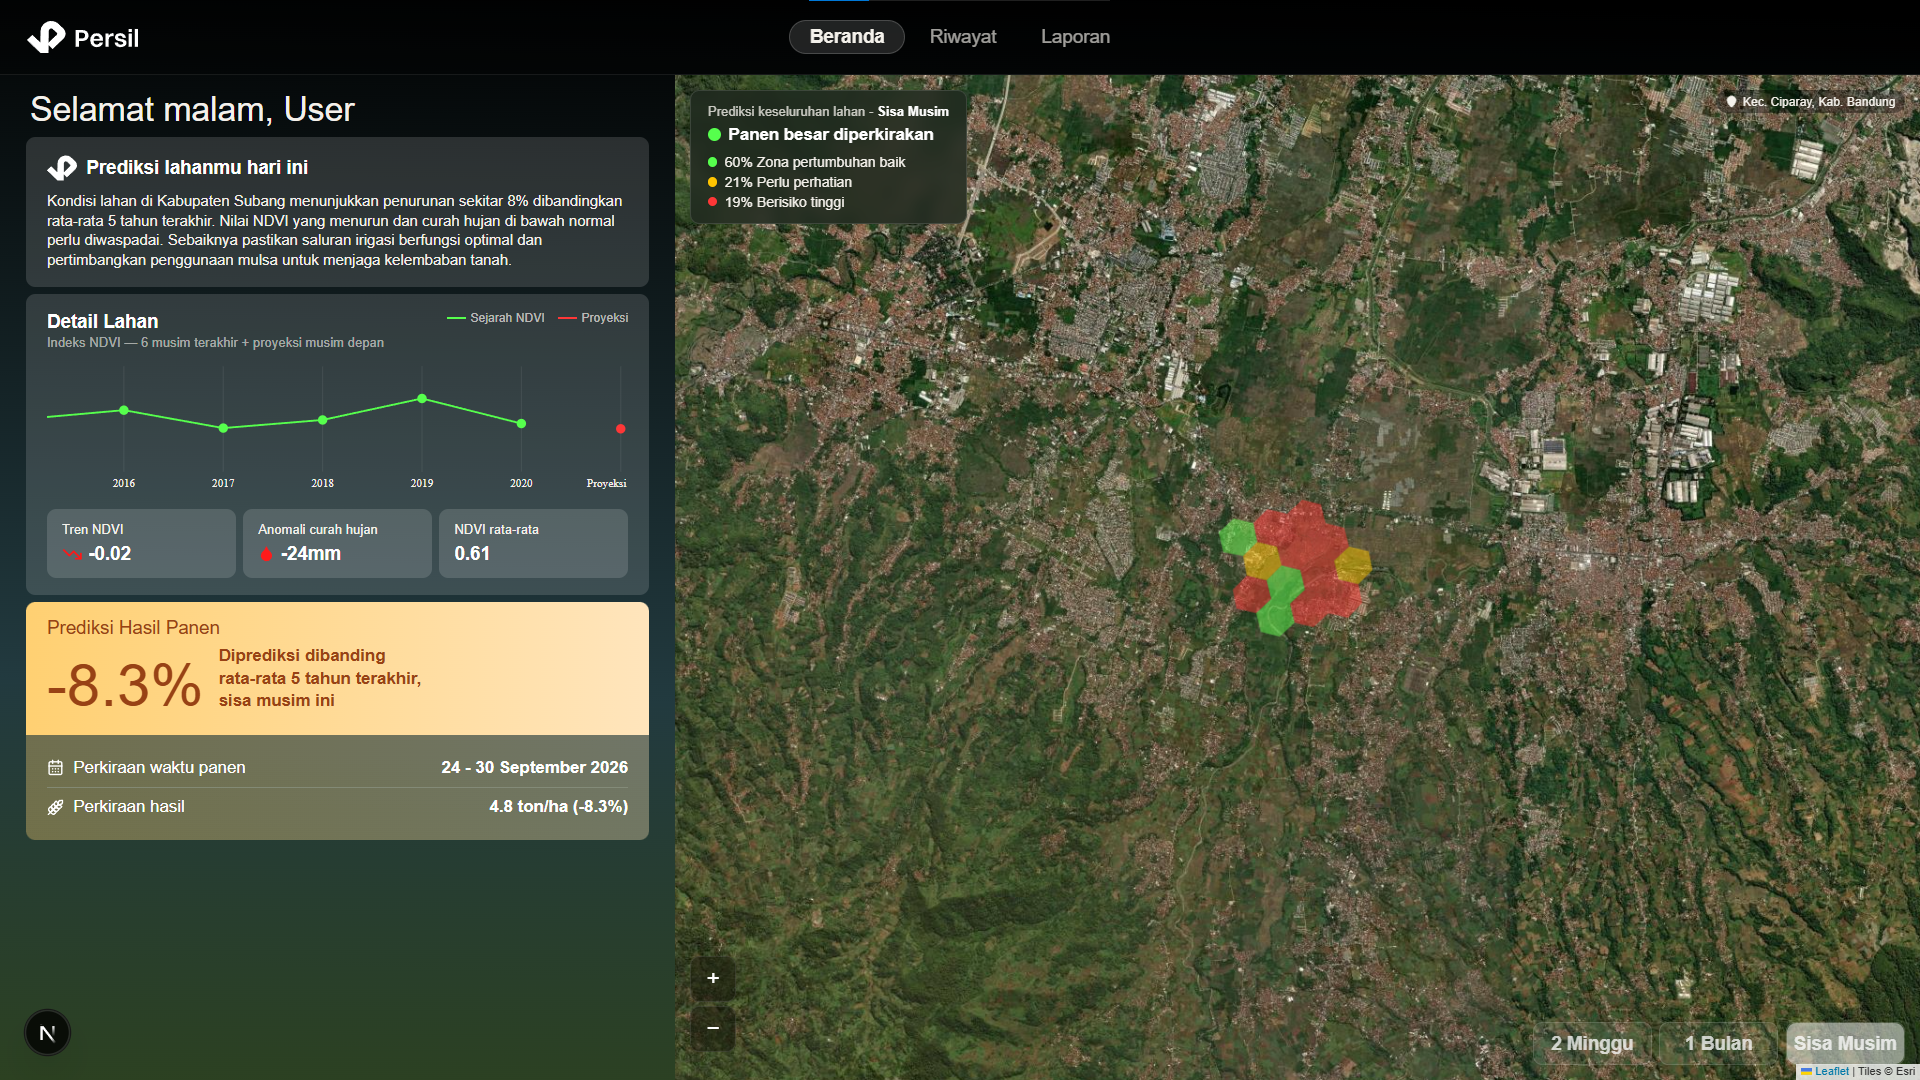
Home dashboard: AI-narrated yield forecast (-8.3%), NDVI trend, harvest window, and soil health map with hex-grid risk zones.
-
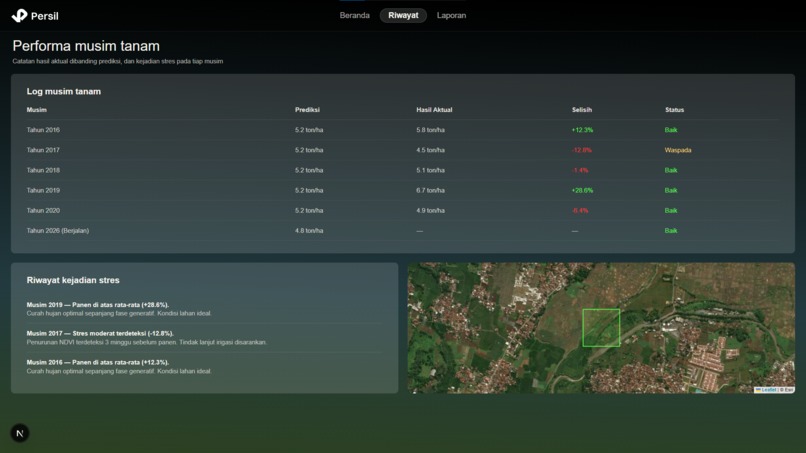
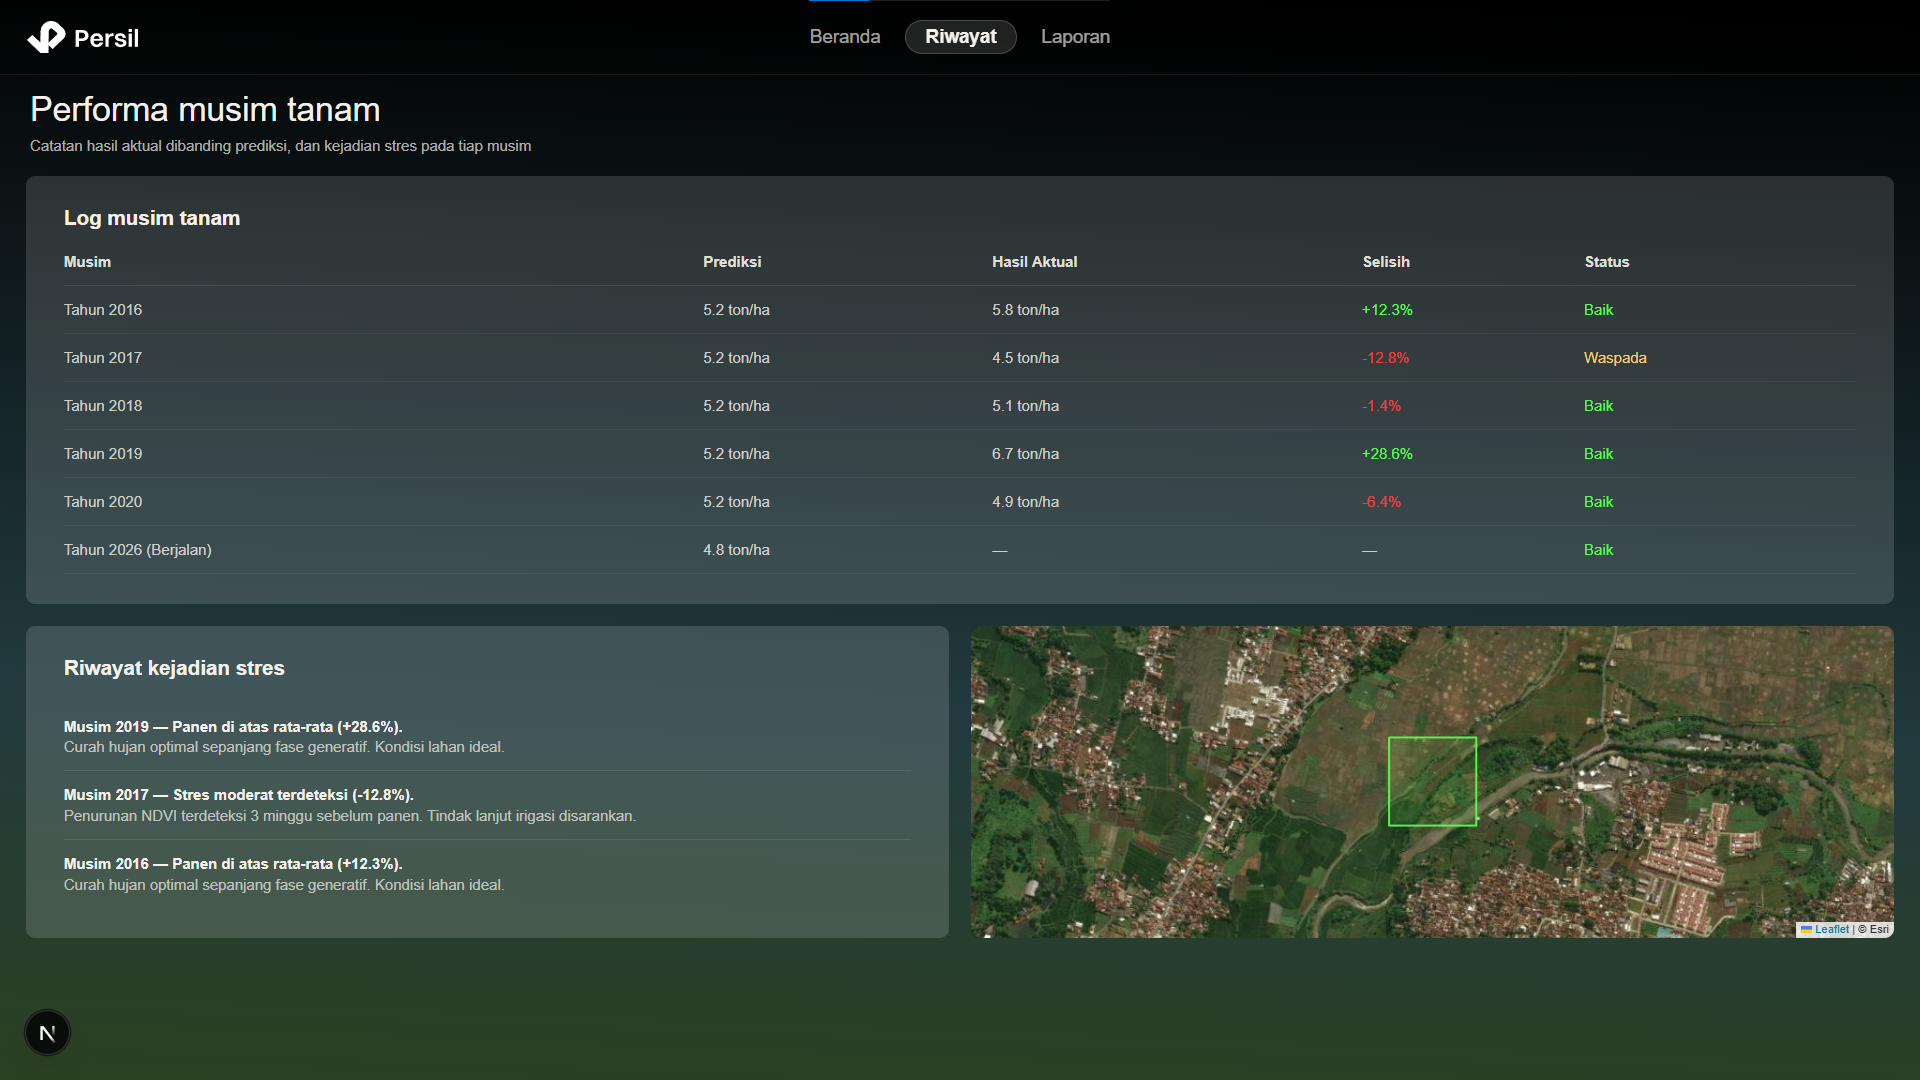
History page: predicted vs. actual yield by year, stress events log, and mini satellite map of the tracked plot.
-
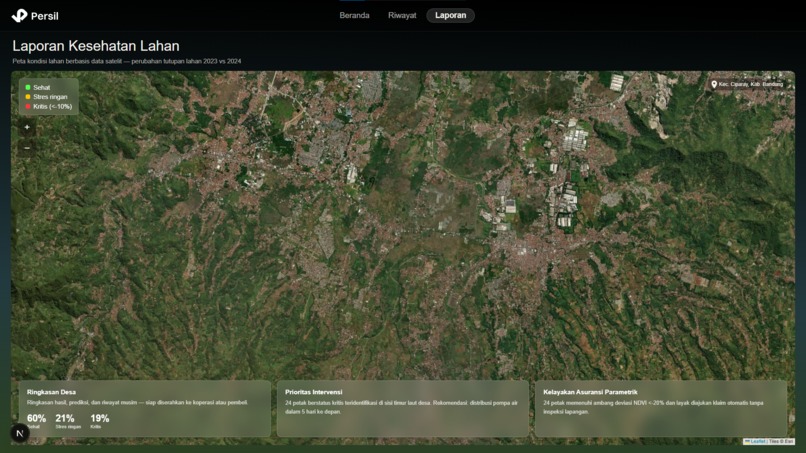
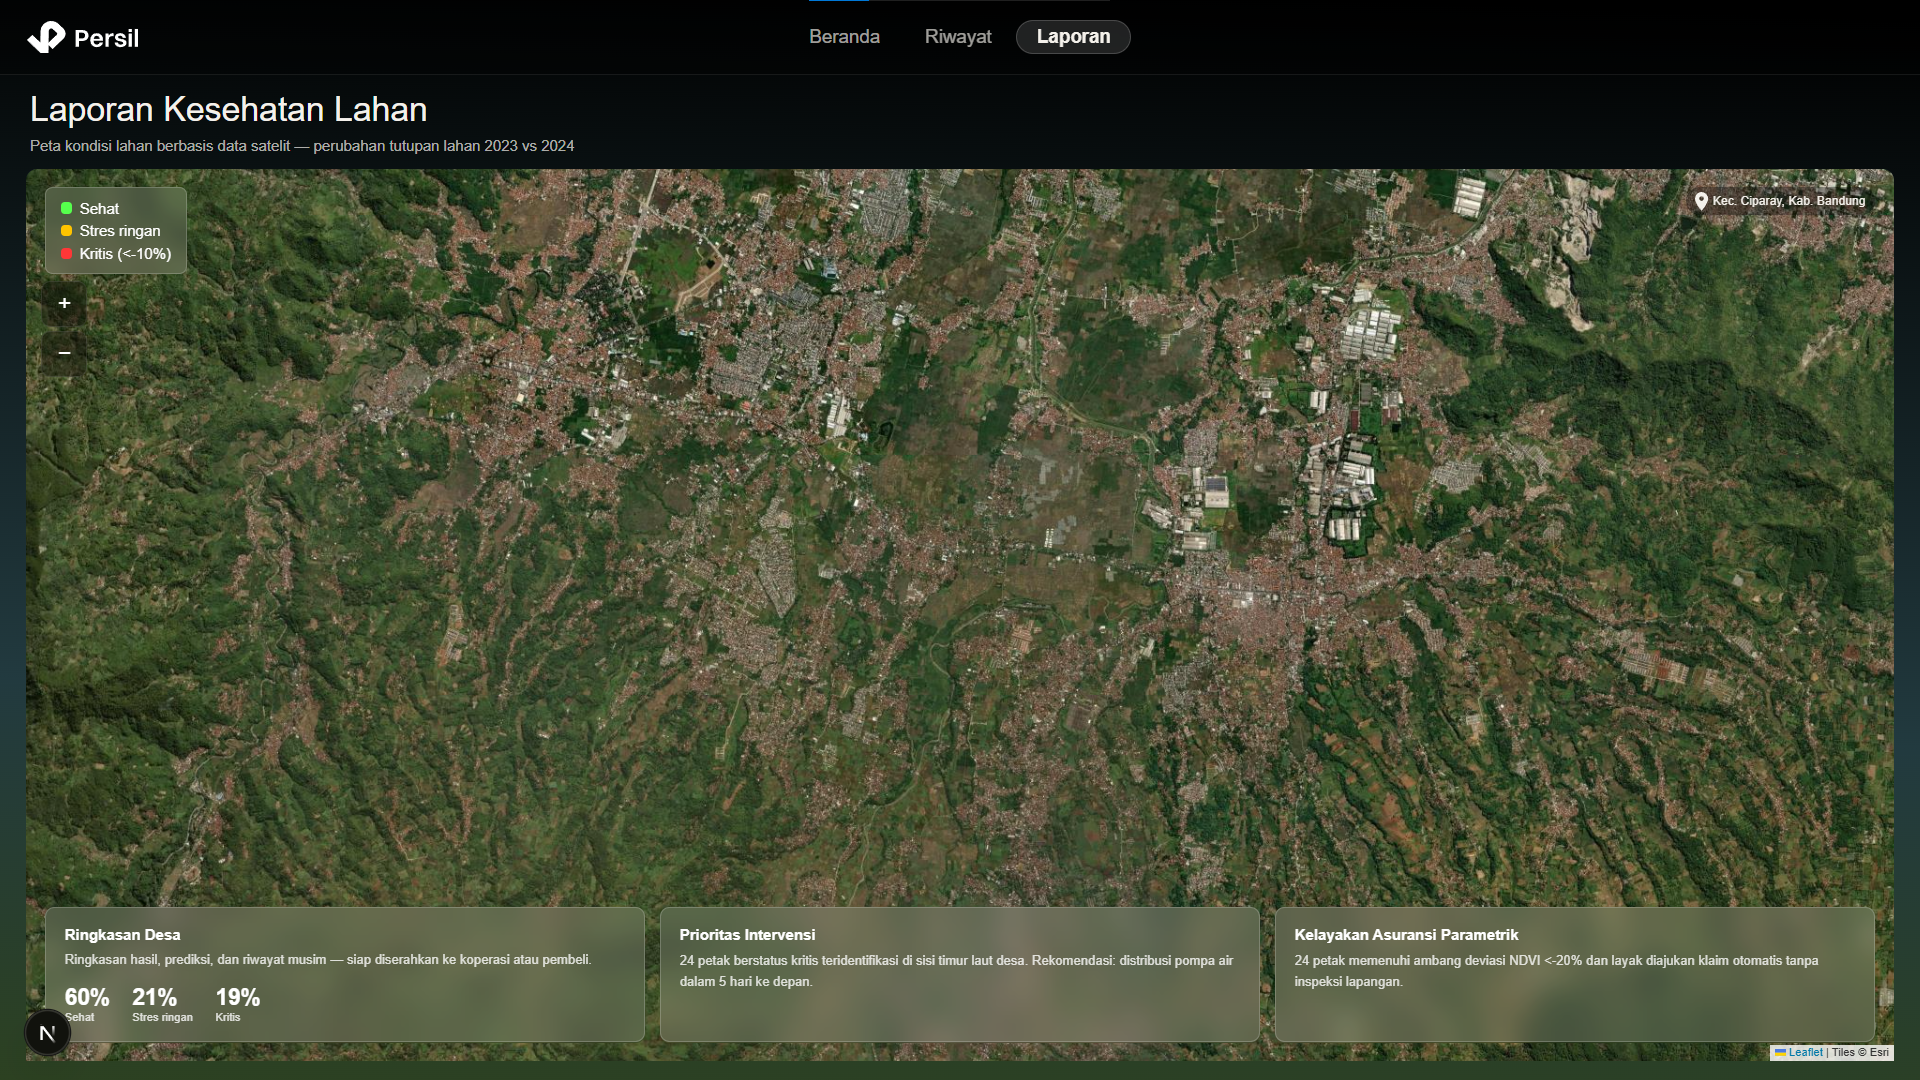
Soil health report: land-change map, village zone summary, intervention priorities, and parametric insurance eligibility.

Inspiration
The starting point was a single statistic: Indonesia has over 14 million smallholder rice farmers, and most of them find out their harvest failed after it already has. There is no early warning. There is no satellite readout on a phone. There is no insurance that pays before a family goes into debt. The data to change this exists. It is free, publicly accessible, and orbiting the planet right now. The gap is not in the data. It is in the tools that translate raw satellite imagery into something a farmer in West Java can act on.
We also wanted to answer a technical question that genuinely interested us: can Google's AlphaEarth foundation model, trained on general land representation, transfer to agricultural yield prediction without any fine-tuning? The answer, it turns out, is yes. The evidence is in the validation numbers, not in a claim.
What We Built
Persil is a geospatial forecasting platform with two features built on the same underlying satellite pipeline.
Feature A: Yield Deviation Forecast
The model predicts the percentage deviation of a kabupaten's rice yield from its own trailing five-year average.
We deliberately predict d yield. Absolute yieldrequires knowing harvested area, which is not reliably available at kabupaten level. Deviation is compuords alone, and is moreactionable: a farmer does not need to know that their kabupaten produces 800,000 tons; they need to know wg 15% below normal.
The input feature vector
- AlphaEarth (
GOOGLEL): a 64-dimensionalannual land embedding per kabupaten polygon, extracted via Google Earth Engine at 2 km resolution. AlphaEare extractor only. We never fine-tune it. - Sentinel-2 NDVI (`C mean NDVI and linear NDVIslope over the Apr-Sep growing season, with a built-in cloud-cover fallback thawidens the observation wir blocks usable passes.
- Open-Meteo rainfall anomaly: seasonal rainfall total minus the five-year historical mean for the s
The model is a Ridge regr.
We chose Ridge over XGBoomately 68 training rows (18 farming kabupaten across 4 years), tree-based methods overfit severely. Ridge with strong regularizatioensionality reduction from67 to 10 components is the right tool for this data size.
Feature B: Soil Health Monitor
For soil health monitoring, we use no machine learning at all. For each H3 hex cell (resolution 9, appro the cosine drift betweenAlphaEarth embeddings from two consecutive years.
A drift score above 0.05 deforestation, landconversion, or vegetation loss. No training data, no ground-truth labels, and no administrative boundariesl-scale soil healthmonitoring possible from day one.
Validation
We validated Feature A using leave-one-year-out cross-validation with year-demeaned targets. Ye9 was a province-widebumper year across all West Java kabupaten due to La Nina recovery, and 2020 was a province-wide down yearhout demeaning means themodel predicts zero deviation while the test year has a systematic shift unrelated to spatial vari confound so the modellearns what AlphaEarth actually encodes: spatial differences between kabupaten.
| Feature Set | $R^2$ (held-out) | RMSE |
|---|---|---|
| AlphaEarth only | 0.546 | ~11% |
| AlphaEarth + NDVI + Rai |
We report only held-out nnce is never shown anywhere in the system.
Challenges
The year-effect problem. The single hardest technical challenge was not feature engineering. It wing data. With only fourtraining years, the dominant signal is the province-wide year effect, not the spatial variation we care on 2017-2019 and tested on 2020 would simply predict "average year" while 2020 was 14.6% below average for every kabupaten. The solu year before fitting. Itcame from thinking carefully about what the model can and cannot learn from 68 rows of data, not from hy
AlphaEarth's 2017 cutofts in 2017. BPS yield datagoes back further. We initially included 2016 in the training set, which caused silent NaN embeddings ande we caught it. The fix was straightforward but the debugging cost real time.
Urban kota contamination. Nine urban municipalities in West Java showed "yield decline" in BPS dah crop stress. Their riceproduction fell because urbanization was physically eliminating farmland. Including them in traininte AlphaEarth'surban-density signal with declining yields, which is the wrong lesson. Filtering by minimum average producremoved them cleanly.
Cloud cover as a design case. Tropical cloudcover in West Java routinely blocks Sentinel-2 optical passes for one to two weeks at a time. We builttry the target seasonalwindow, then widen it by 2x, then degrade gracefully to AlphaEarth and rainfall only with an explicit labe UI. The system neverreturns a broken or blank state for cloud cover because we designed it not to.
What We Learned
AlphaEarth transfers to agricultural tasks more effectively than we expected. An R² of 0.546 on held-out ktellite embeddings as theonly input, is a meaningful result on a 68-row dataset. The published literature on AlphaEarth-based yield+ on corn and soybean inlarger datasets with more label years. Our numbers are lower, but the signal is real and the methodology
We also learned that trannt, not an afterthought.Every simulation, every heuristic, and every proxy value in Persil carries an explicit label. The insur as a prototype. The NDVIproxy chart is not presented as measured data. A system that is honest about its limitations is more usefune that papers over them.
Built With
- alphaearth-foundations-satellite-embedding-dataset
- fastapi
- gemini-ai
- google-earth-engine
- koyeb
- leaflet.js
- next.js-16.2.10
- python
- react-19
- recharts
- ridge-regression
- supabase
- typescript-5
- vercel


Log in or sign up for Devpost to join the conversation.