Inspiration
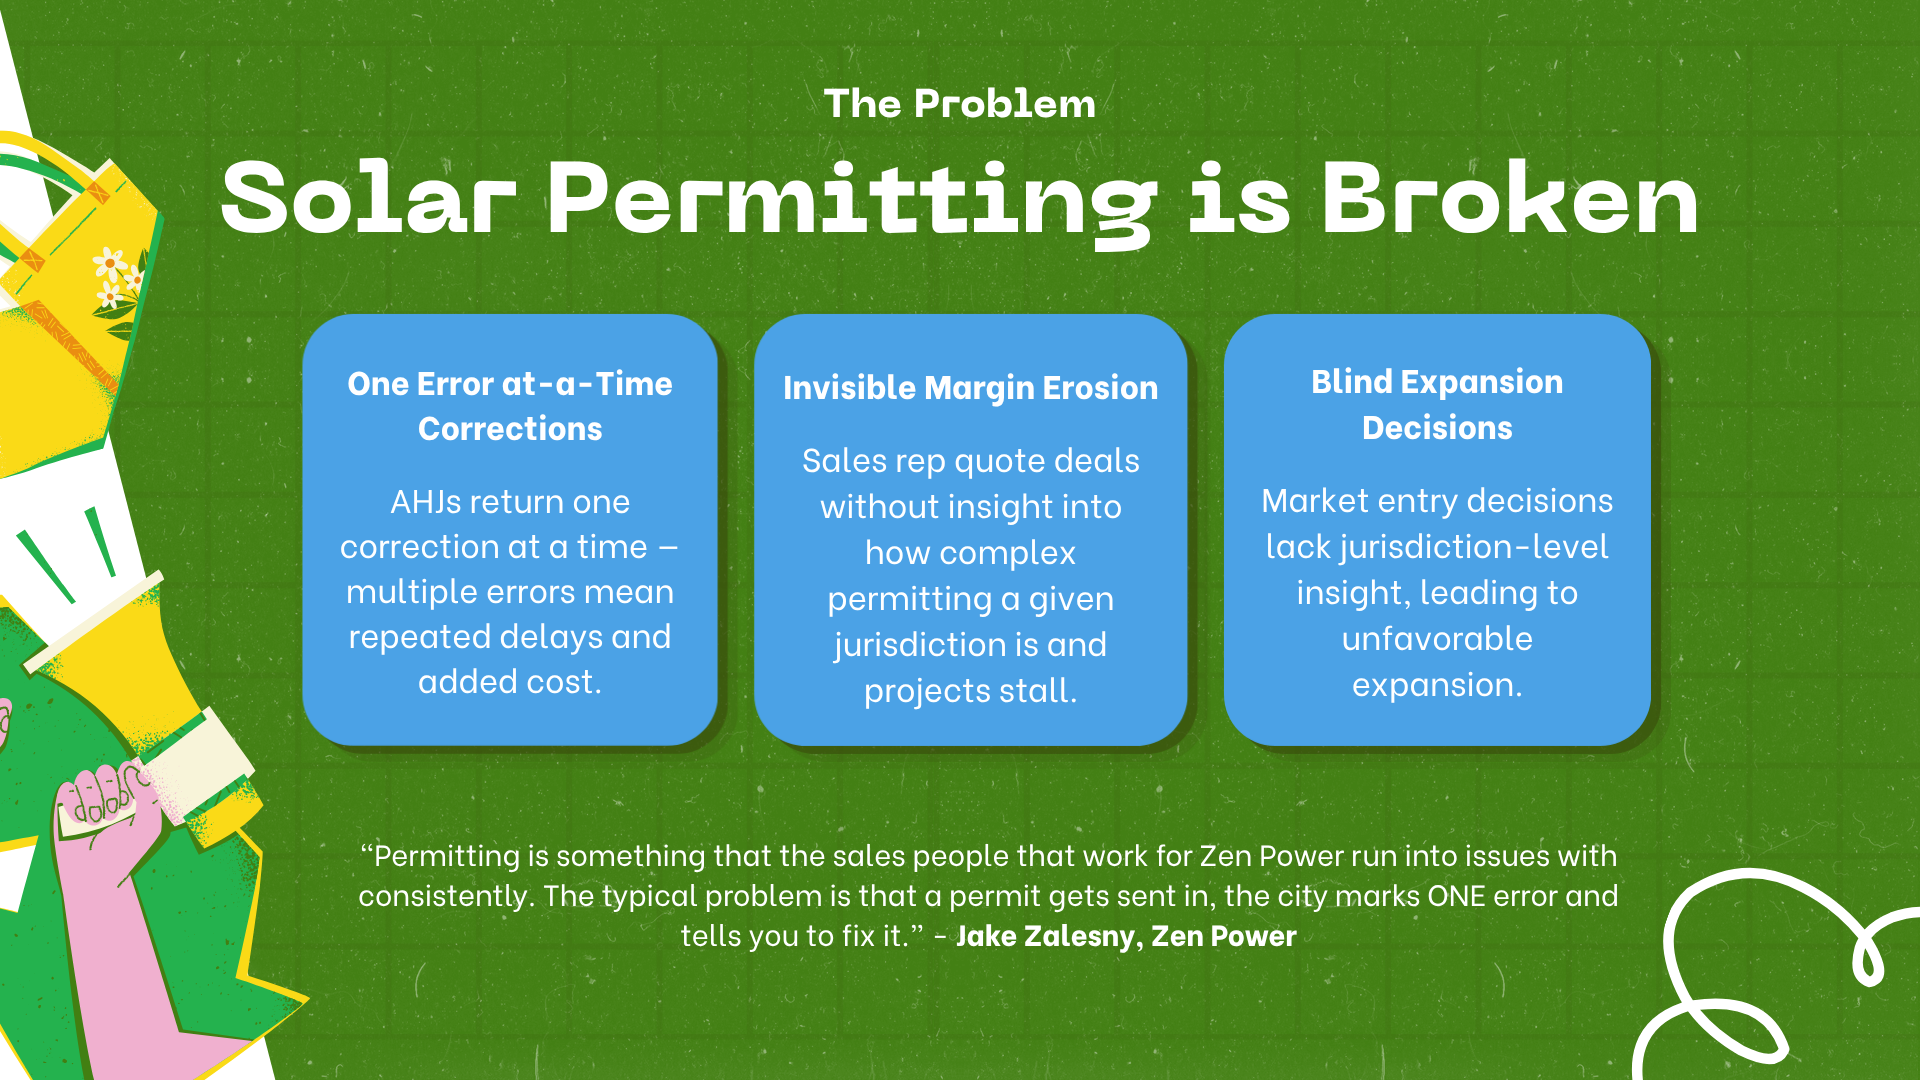
Solar is one of the fastest-growing sources of clean energy in the US, but the industry runs into the same wall on nearly every job: permitting. Every residential and commercial installation requires approval from a local Authority Having Jurisdiction before work can begin. There are over 30,000 AHJs across the country, each with their own requirements, timelines, and interpretations of code. The specific pain point we kept hearing about was the one-error-at-a-time correction cycle. AHJs don't return all errors at once. They send one, you fix it, resubmit, and wait again. A permit with three errors requires three separate correction cycles, each adding days or weeks to the timeline. For solar installers like ZenPower, this compounds into real margin erosion on every affected job. We validated this directly with Jake Zalesny at ZenPower, who told us permitting friction is a consistent, material pain point for their sales team. Reps are quoting deals with zero visibility into how complex a given jurisdiction actually is, and by the time a project stalls, the margin is already gone. That conversation shaped everything we built.
What it does
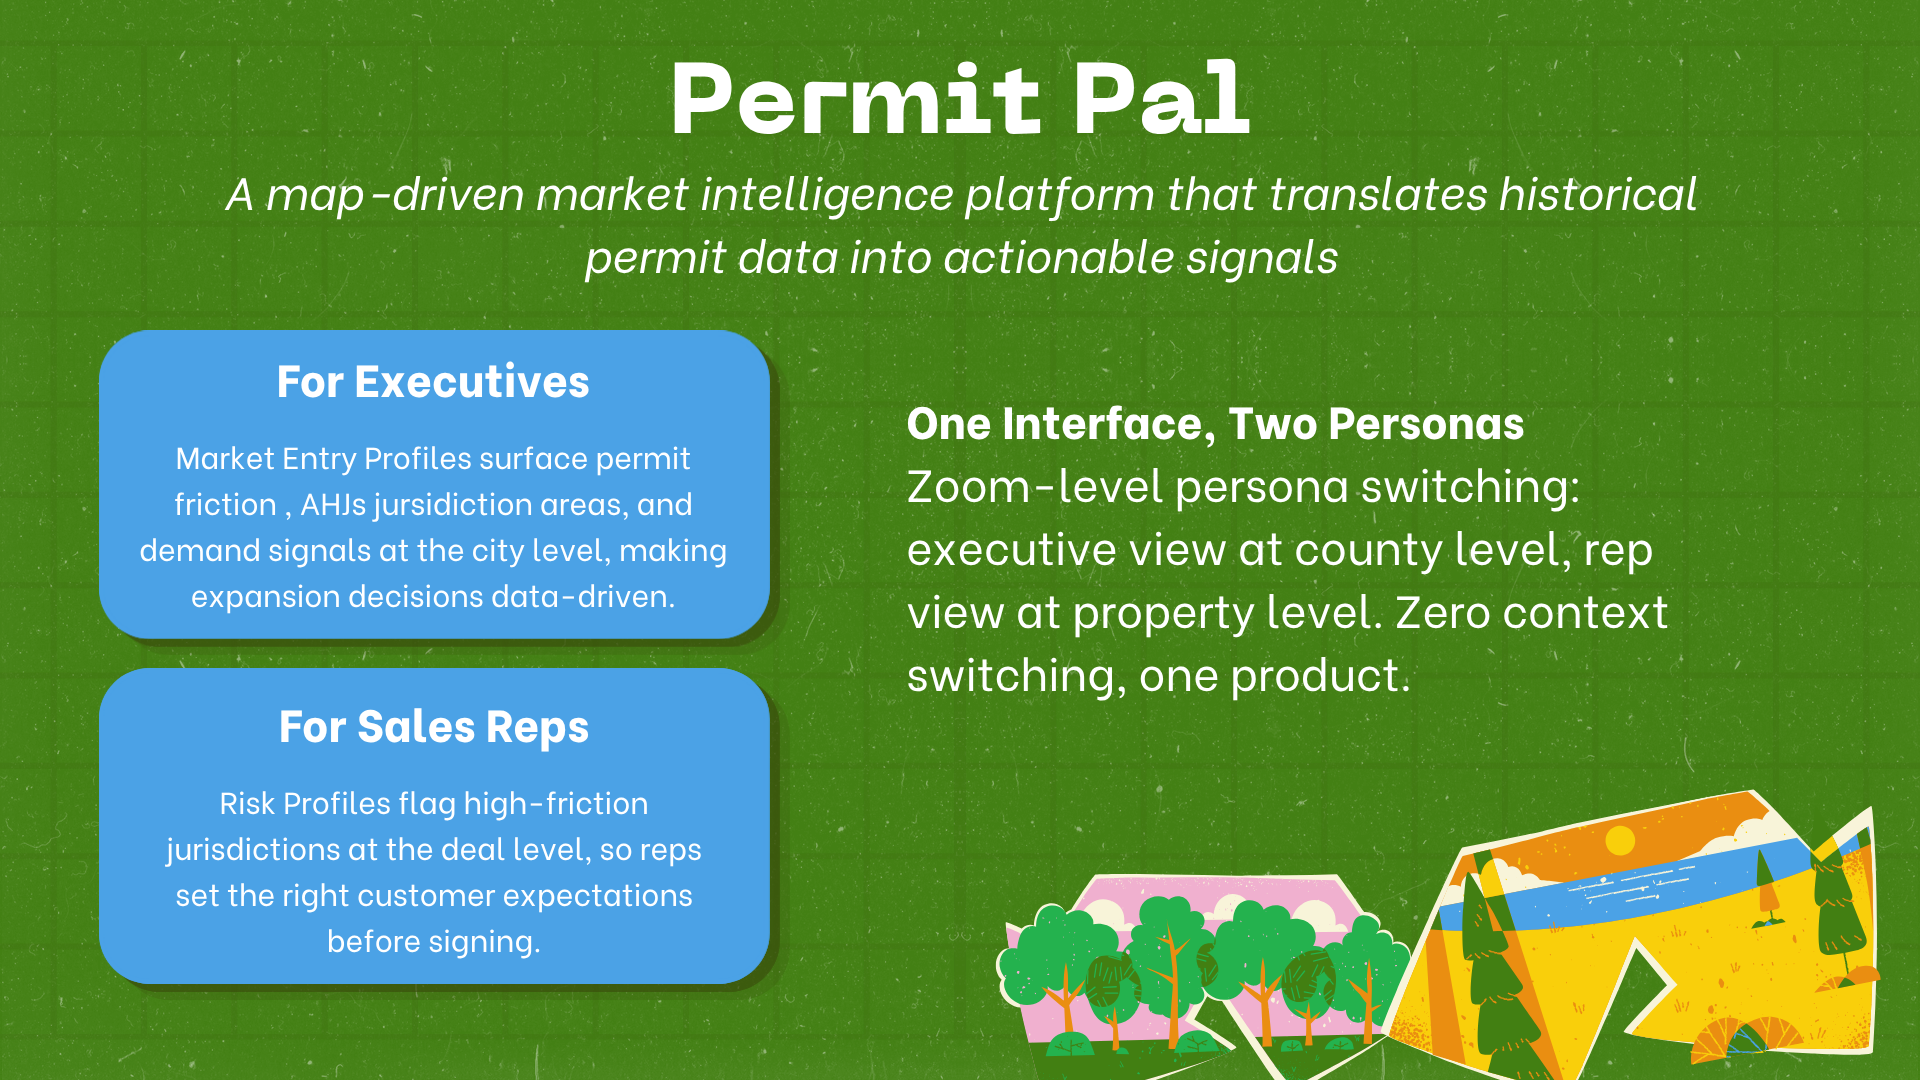
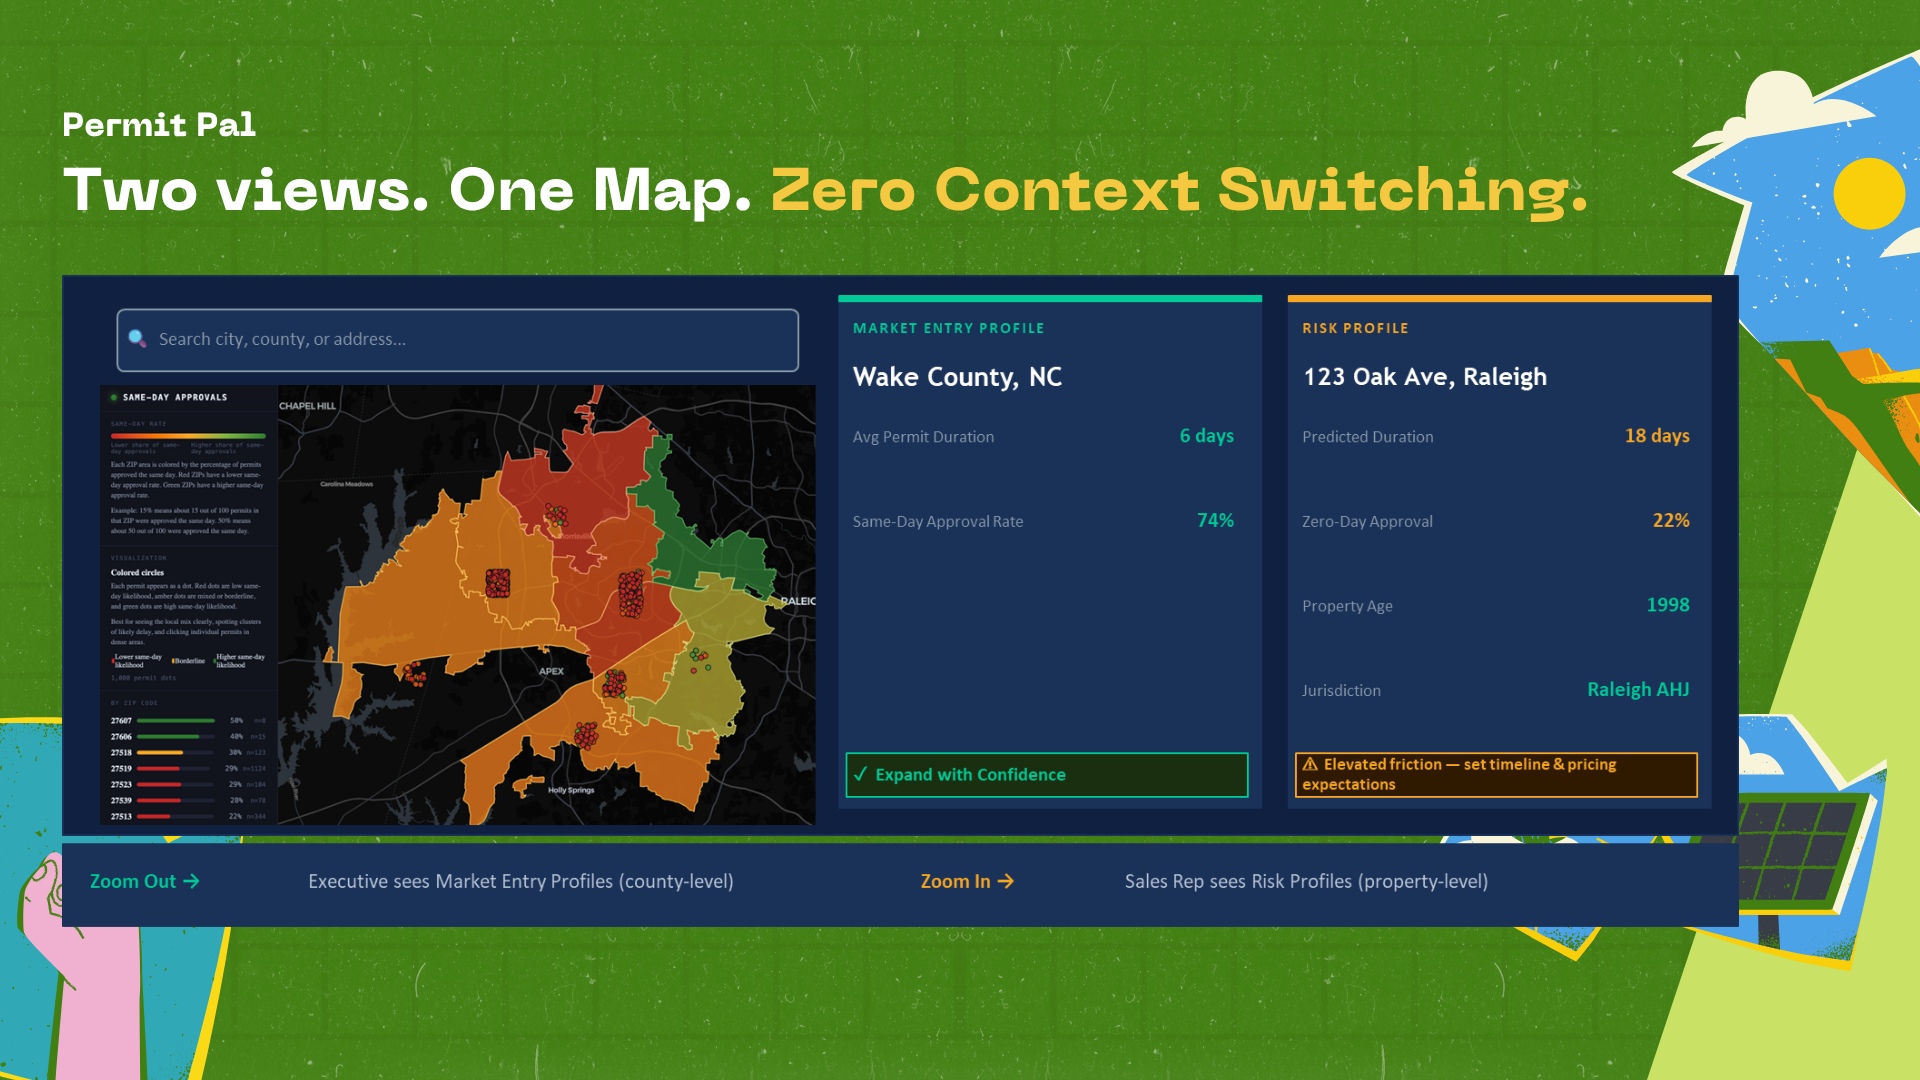
Permit Pal is a map-driven market intelligence platform that translates historical permit data into actionable signals before a deal closes, not after a project stalls. The platform serves two personas from a single interface: For executives, Market Entry Profiles answer: is this a permitting-friendly market to expand into? At the county level, the map surfaces aggregated permit duration and same-day approval rate by jurisdiction, giving strategic decision-makers a data-driven view of where to grow. For sales reps, Risk Profiles answer: is this specific deal going to be a problem? Zooming into a property triggers a Risk Profile for that AHJ, showing predicted permit duration and same-day approval rate, and flags elevated-friction jurisdictions with a plain-language alert before the rep closes the deal. The core UX mechanism is zoom-level persona switching. The interface automatically transitions between the executive view at the county level and the sales rep view at the property level. One product, two users, zero context switching.
How we built it
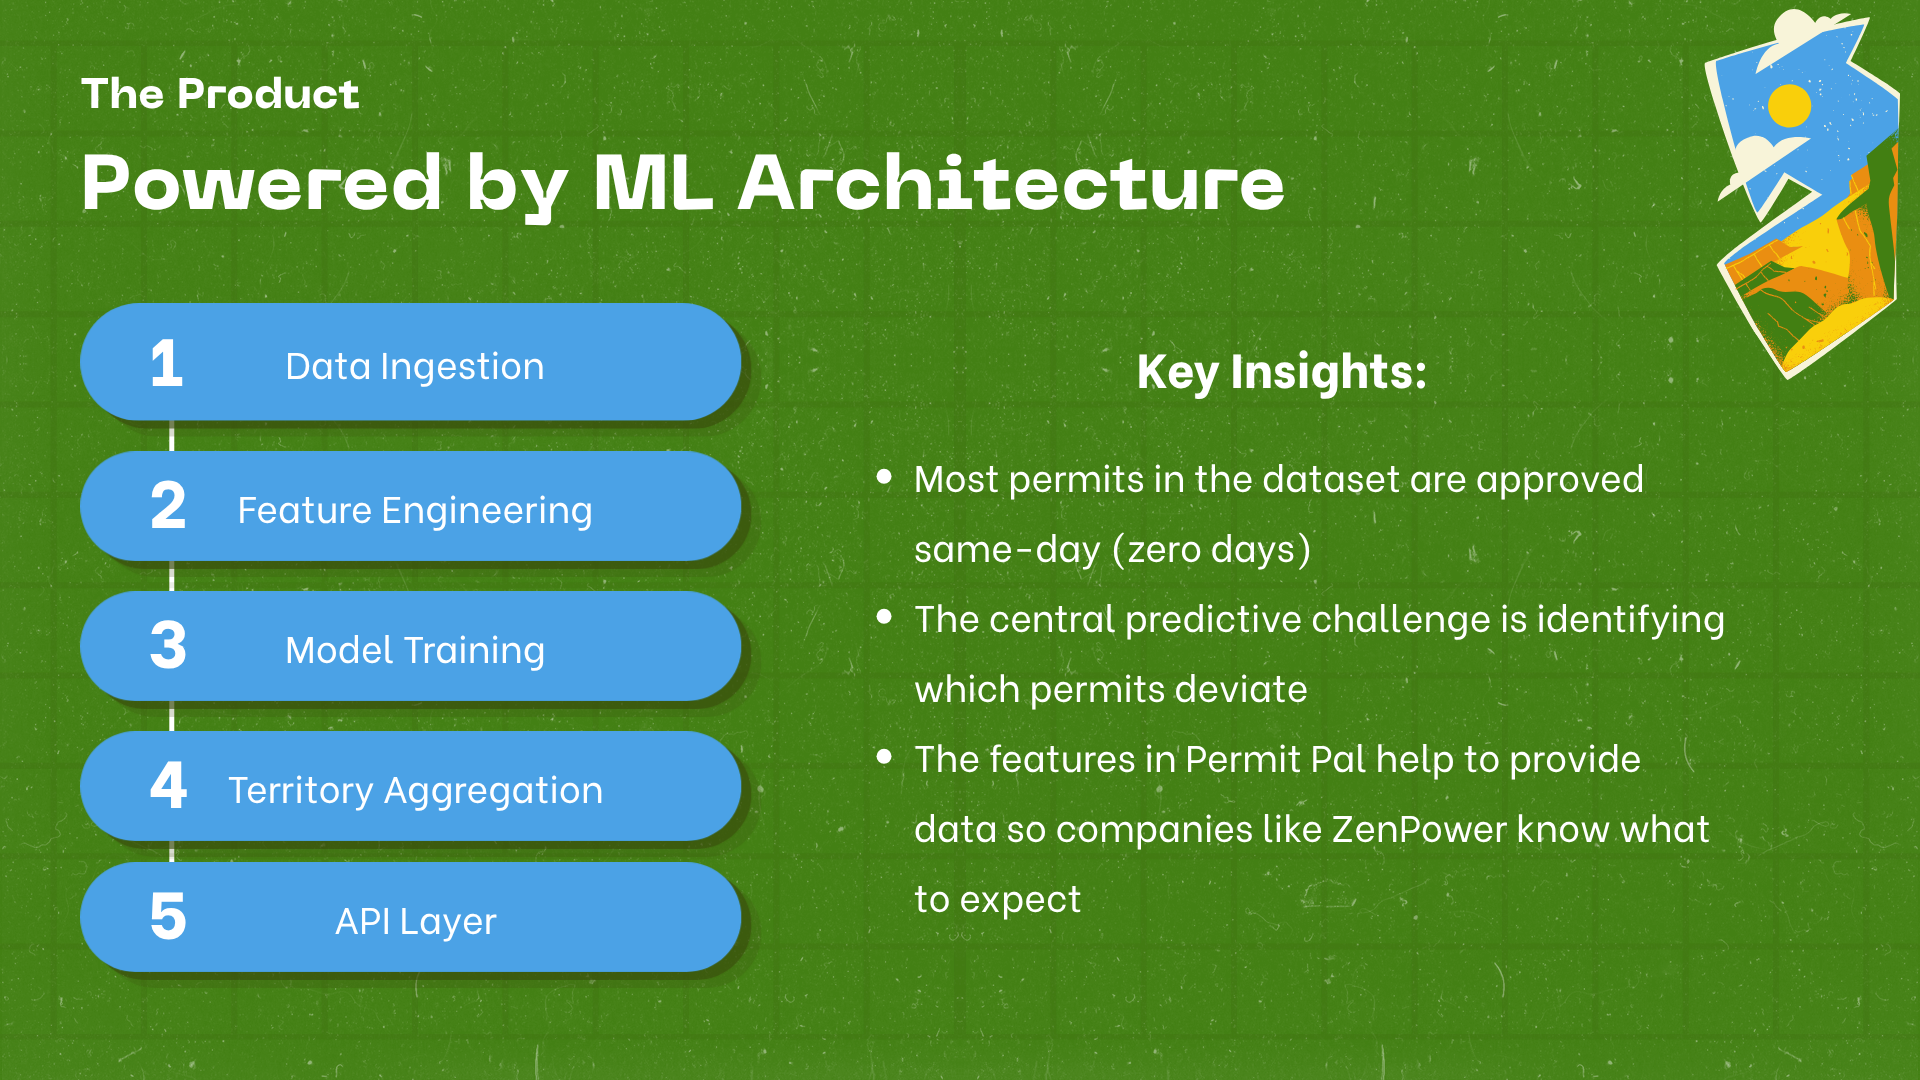
Data pipeline: We ingested six CSV files from the ZenPower dataset, including solar permit records, property data, and public record files, using Python and Pandas. All data exploration and modeling work was done in JupyterLab. Feature engineering: Our primary modeling target is PERMIT_DURATION, derived as the number of days between FILE_DATE and ISSUE_DATE. This captures the full correction cycle, including every back-and-forth with the AHJ before a permit is formally issued. We label-encoded JURISDICTION across AHJs and imputed medians for missing values using a Scikit-learn pipeline. The model: We built a 0-Day Classifier using a logistic regression coupled by XG Boost. The model takes in jurisdiction, property characteristics (year built, building area, lot size), permit type, and job complexity flags (electrical, HVAC, battery, roofing, EV charger) to predict whether a permit will deviate from same-day approval, and by how many days. The same model powers both the Market Entry Profile (predictions aggregated by territory) and the Risk Profile (predictions surfaced at the property level). Libraries used: pandas, numpy, scipy, matplotlib, scikit-learn, xgboost, shap, joblib. Frontend: The web app is built in TypeScript and React 18, with Vite as the build tool. MapLibre GL powers the interactive map and zoom-level persona switching. Supabase Postgres serves as the backend data store, accessed directly from the frontend. The dual side panel components, Market Entry Profile and Risk Profile, are built as React components with inline styles.
Challenges we ran into
Defining the right target variable took real deliberation. We initially considered modeling inspection pass/fail rates, but inspection outcomes happen after installation and don't reflect the pre-sale friction ZenPower actually experiences. Filing-to-issuance duration was the right signal. AHJ boundaries don't follow zip codes or city lines, which meant city-level aggregations missed the jurisdictional variance driving the problem. We used jurisdiction name clustering as a proxy for v1. Scoping responsibly was its own challenge. The Risk Profile doesn't generate a dollar-denominated contingency recommendation in v1 because that requires ZenPower's internal carrying cost data. We documented the formula for v2 rather than ship a number we couldn't validate.
Accomplishments that we're proud of
We validated the problem with a real customer before writing a line of code, which kept every product decision grounded. We shipped a working end-to-end product in under 24 hours, from data pipeline to interactive map to dual side panels. And we built a single model that cleanly powers two completely different user experiences without any additional complexity.
What we learned
The most important insight came from the data itself: most California solar permits are approved same-day. The problem is the tail. The permits that deviate are the ones that create correction cycles and eat margin, and that realization shaped the entire modeling approach. We also learned that an hour of customer validation is worth more than a day of modeling without it.
What's next for PermitPal
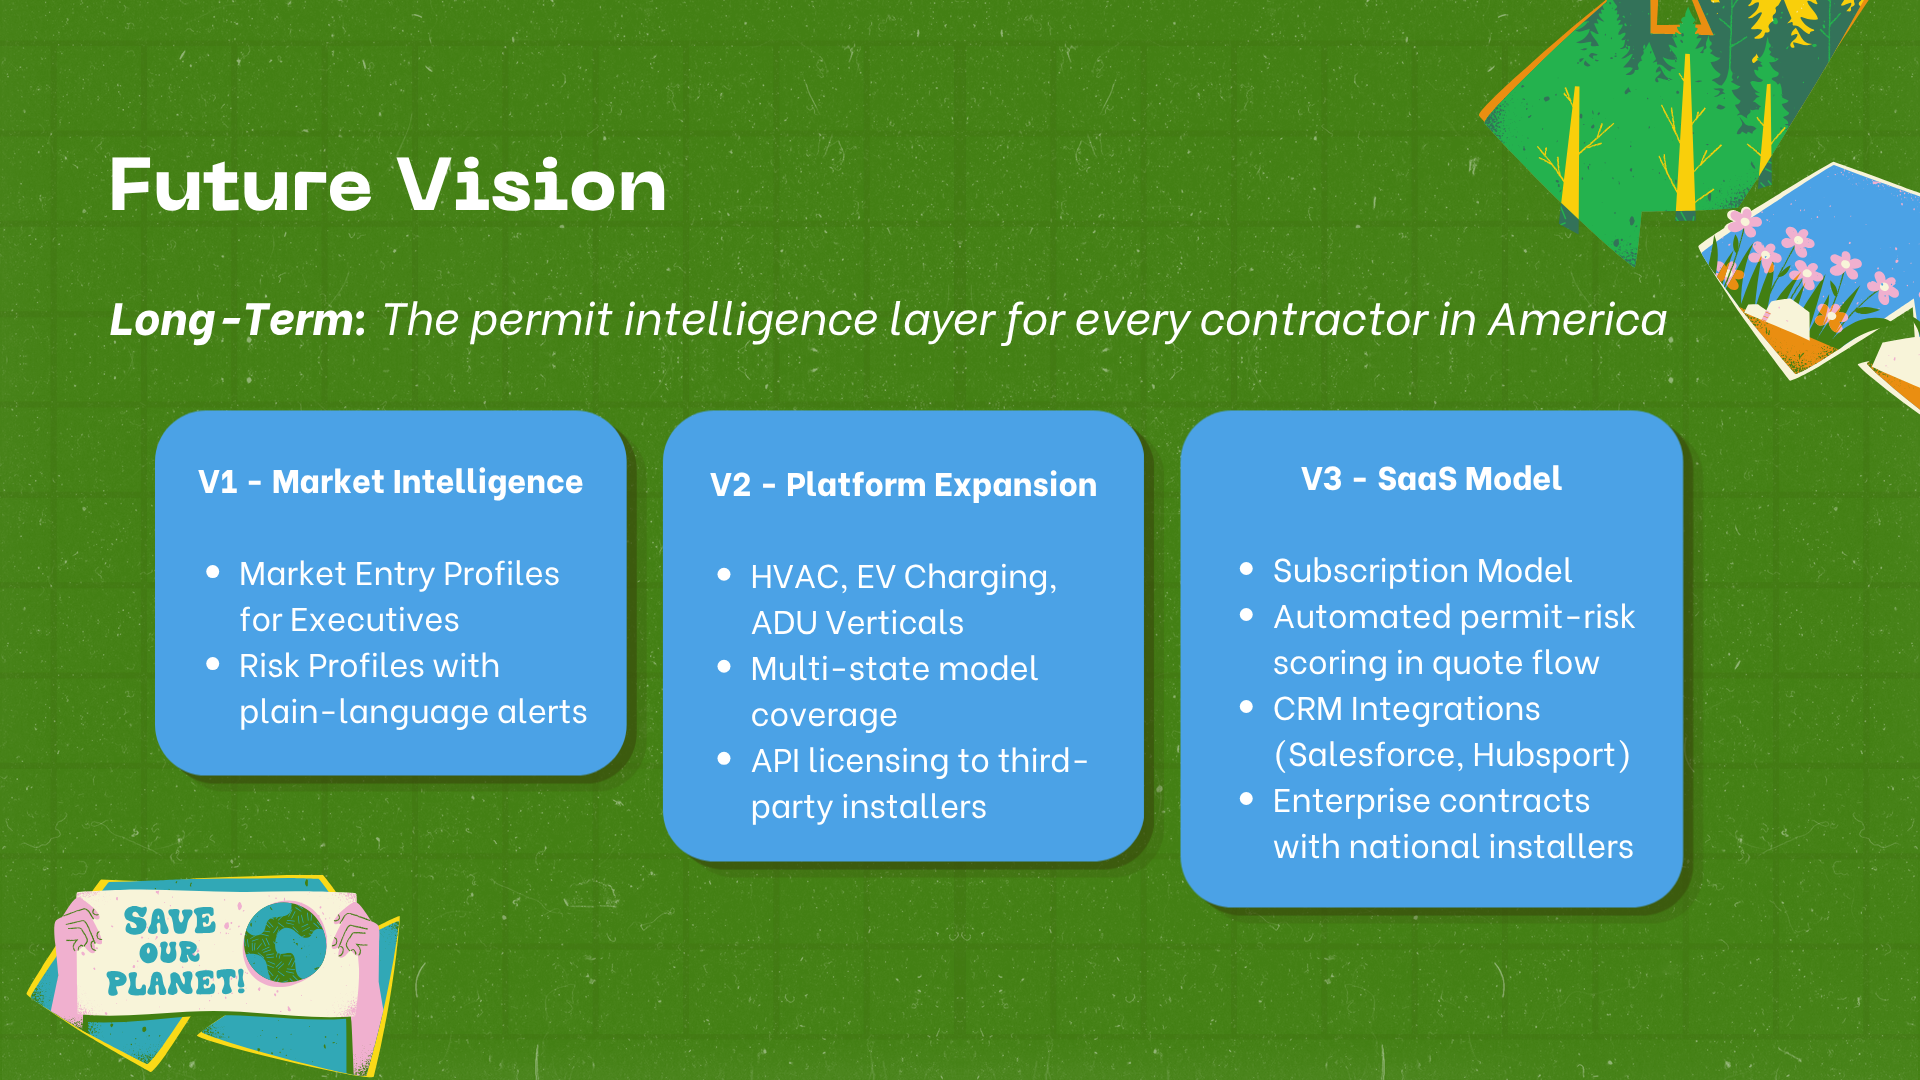
The immediate next step is expanding the AHJ-level framework beyond solar. HVAC, EV charging infrastructure, and ADUs all face the same jurisdictional permitting complexity. The data changes, the architecture doesn't, and every new vertical deepens the model's accuracy and the platform's reach. Longer term, Permit Pal becomes a full SaaS layer embedded directly in the tools installers already use, with permit-risk scoring surfaced inside CRMs like Salesforce and HubSpot at the moment a rep is building a quote. The goal is simple: every contractor in America knows what they're getting into before they file a single permit.

Log in or sign up for Devpost to join the conversation.