-
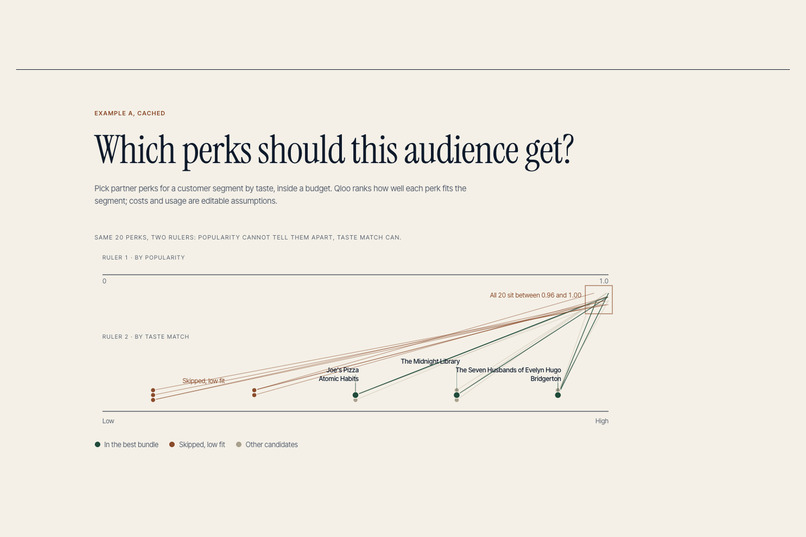
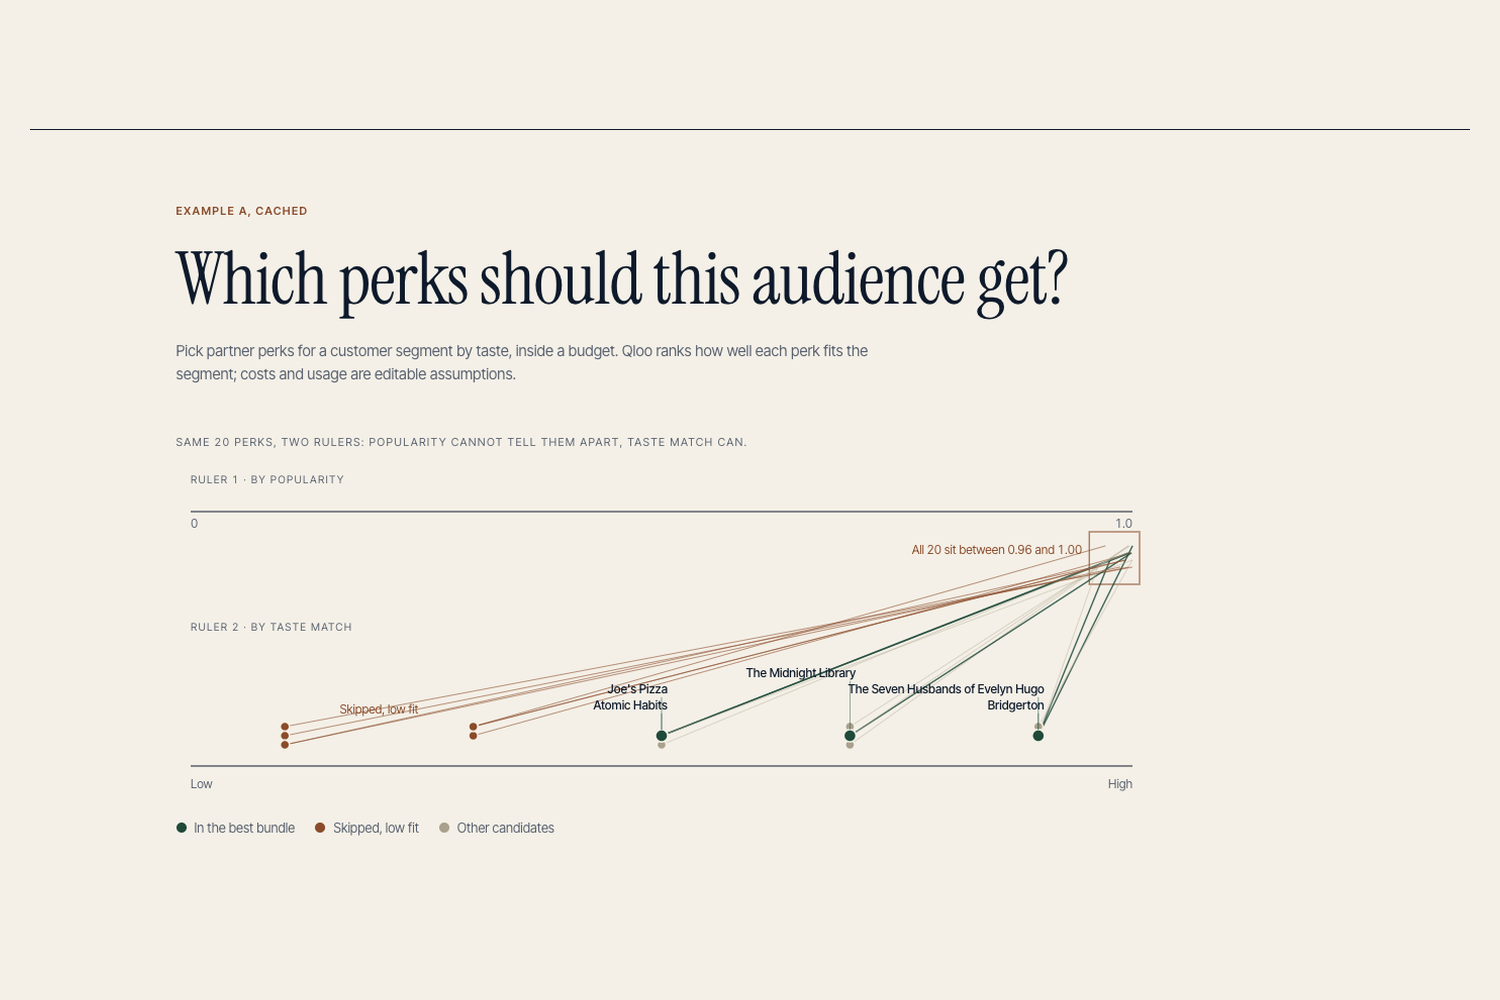
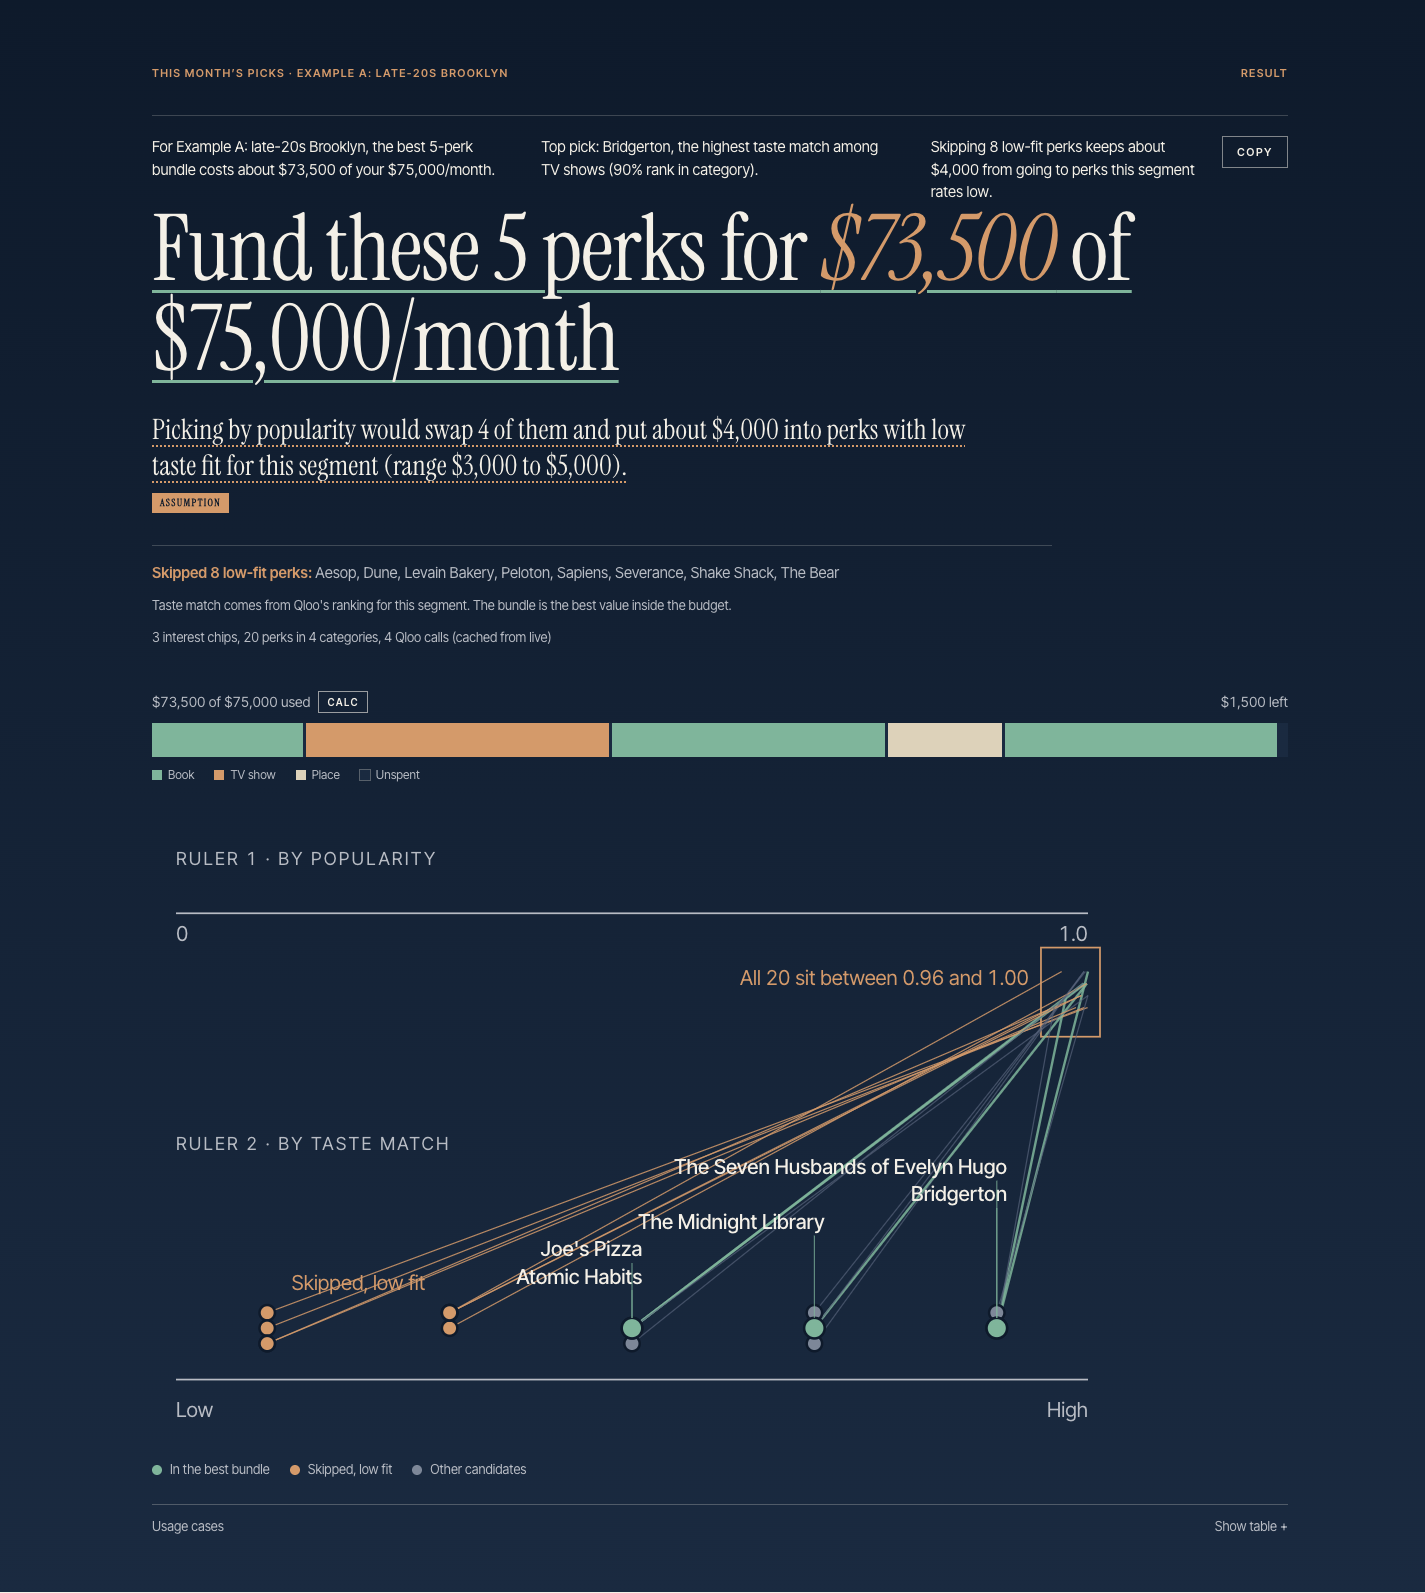
Same 20 perks, two rulers: popularity sits between 0.96 and 1.00 for every candidate; taste match spreads them from low to high.
-
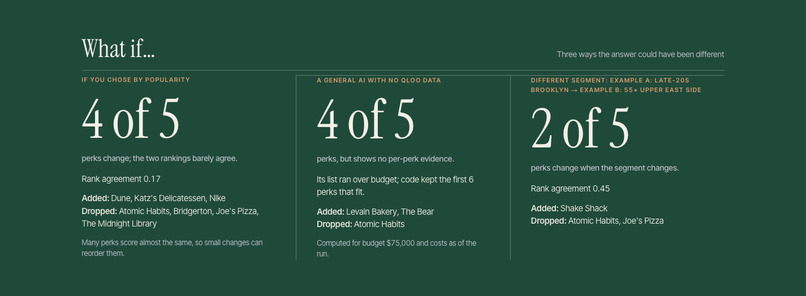
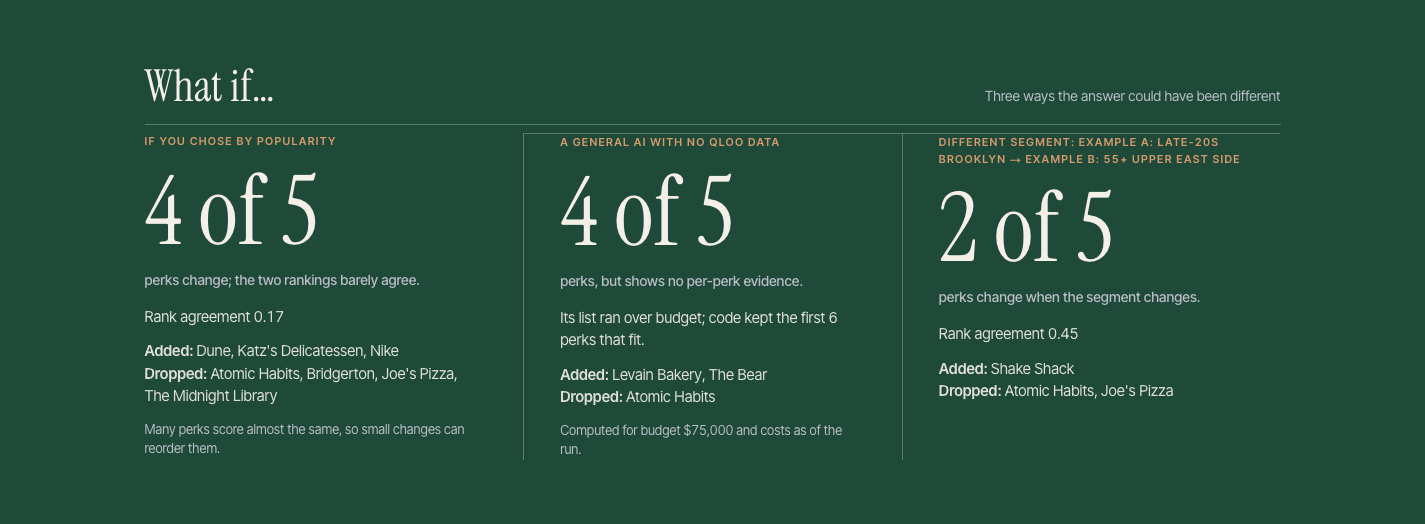
What if: by popularity 4 of 5 perks change; a general AI shows no per-perk evidence; a different segment changes 2 of 5.
-
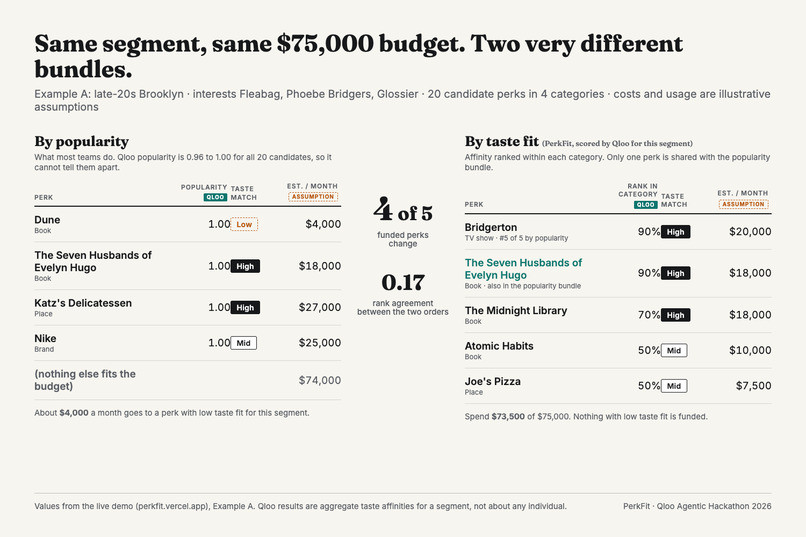
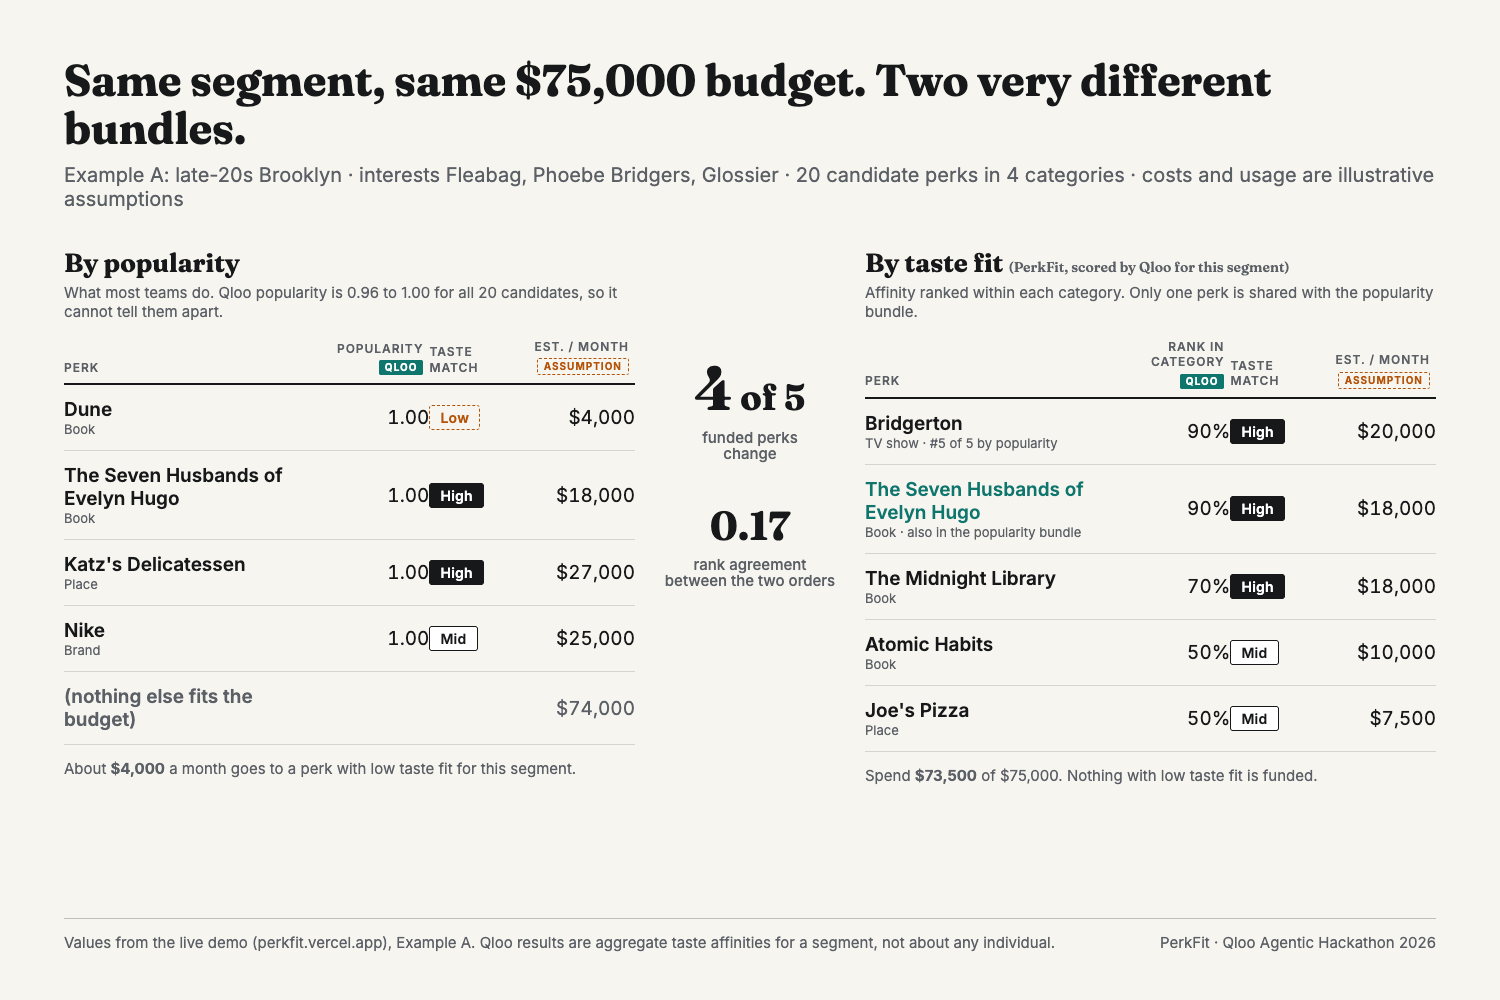
Same segment, same budget: the popularity bundle and the taste bundle differ on 4 of 5 perks (rank agreement 0.17).
-
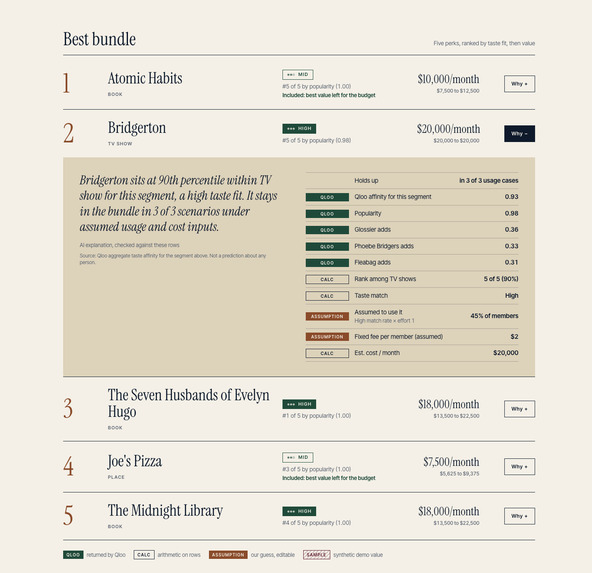
Every perk has an evidence receipt: rows labelled QLOO, CALC or ASSUMPTION, and the model's sentence is checked against them.
-
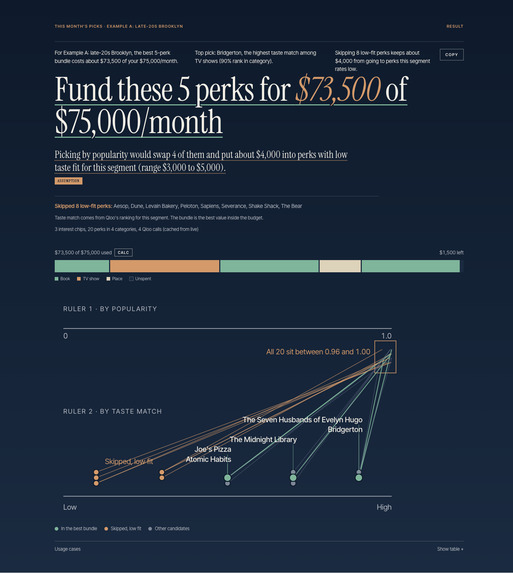
The answer first: fund these 5 perks for $73,500 of $75,000/month, with a copyable summary and the budget meter.

Inspiration
Popularity gives every audience the same list. Qloo can score places, TV shows, brands and books against one audience segment in a single pass, so the list moves when the audience does. That gap is the product.
Picture a partnerships lead at a new card app, three months after launch (an illustrative scenario, not a real program). She has $75,000 a month to spend on perks for 10,000 members, which is $7.50 a member or $900,000 a year, and 20 candidate partners. With no purchase history to say which of them this audience cares about, the usual tie-breakers are popularity and whichever partner pitched first. In our example that habit puts about $4,000 a month, roughly $48,000 a year, into perks with low taste fit for the audience, and uses a slot a better-fitting perk could have had. Nobody notices, because a perk that few members use never raises an alarm. PerkFit asks the audience-level question before the money is committed.
What it does
You enter a segment (three interests and an age band), a monthly budget, a member count and a catalog of 20 candidate perks across places, TV, brands and books. PerkFit asks Qloo how well each candidate fits the segment's taste, sorts them into High, Mid and Low taste match, and picks the best bundle that fits the budget.
The result leads with the answer: "Fund these 5 perks for $73,500 of $75,000/month. Picking by popularity would swap 4 of them and put about $4,000 into perks with low taste fit for this segment." A three-line summary with a Copy button gives a partnerships lead the sentences to bring to her boss. Answer first, evidence on demand: every perk has a "Why?" that opens an evidence receipt with Qloo affinity, Qloo popularity, how much each interest contributed, the rank in its category, and the assumptions (usage share, unit cost) behind the monthly figure. Each row carries a badge: QLOO, CALC or ASSUMPTION.
The proof is one picture. "Same 20 perks, two rulers" sits at the top of the page: by Qloo popularity all 20 candidates sit between 0.96 and 1.00, so popularity cannot tell them apart; by taste match for this segment they spread from low to high, and the five funded perks are the ones at the top. In Example A, Bridgerton ranks last of five TV shows by popularity (0.98 against 0.99 to 1.00), yet it is a High taste match for this segment and is funded; a popularity list would never have picked it. Switch to Example B (55 and older) and 2 of the 5 perks change, so the answer is about the audience, not a fixed top ten.
Below the bundle: a holdout test plan (how to check the taste hypothesis by hiding each perk from 10% of members for four weeks) and three what-if comparisons: choosing by popularity (4 of 5 perks swap, rank agreement 0.17), asking a general AI with no Qloo data (it lands near the same bundle but cannot show per-perk evidence or say what changes for another segment), and switching the segment (2 of 5 swap, rank agreement 0.45).
Why this is not another recommender
Most Qloo projects answer "what should this person like?" PerkFit answers a budget question: "which partner perks should we fund for this audience?" It is a decision tool for the people who design card and membership benefits, and its output is a bundle with a cost, not a ranked list. The core move is a contrast: for the same 20 candidates and the same budget, ordering by popularity and ordering by taste fit disagree on 4 of the 5 funded perks, and the screen turns that gap into dollars under labelled, editable assumptions. It reasons about audience segments only, never individuals.
How Qloo is used
- One Insights request per category, four per run. The segment's interests and age band go in as signals; the category's five candidates go in as the entities to score, so Qloo ranks our shortlist rather than returning its own.
- Affinity and popularity, side by side. Both are kept for every candidate. Popularity is nearly flat across the catalog (0.96 to 1.00 for all 20), so it cannot separate the candidates; affinity does.
- Explainability per interest. Qloo's per-signal contributions appear in each perk's evidence receipt (for example, how much "Fleabag" adds to a TV show's score).
- Within-category percentiles. Affinities sit in a 0.10 to 0.17 band inside a category, so ranks drive the tiers, not raw scores, and a sensitivity line shows how many bundle perks survive when the tier cuts move.
- Segment sensitivity. The same catalog scored for a second segment changes 2 of 5 funded perks (rank agreement 0.45); against popularity order the agreement is 0.17.
- Location is available as a signal but left optional, because it silently drops candidates outside the area.
How I built it
- Engine: Qloo scores are ranked within each category and cut into High, Mid and Low. A budget-packing step (a small knapsack problem: pick the set of perks with the most taste-weighted value whose monthly costs fit the budget) runs for pessimistic, base and optimistic usage assumptions. A popularity-ordered baseline is computed with the same assumptions so the contrast is like for like.
- Evidence ledger: every number on screen is a row with a source (Qloo, calculation or assumption) and the rows it was derived from. The headline, the summary and the holdout plan are filled by code from those rows.
- Agent: a tool loop on the Vercel AI SDK with Claude Opus 5.5. The agent resolves interests, scores categories, runs the optimiser, plans the holdout test and writes one explanation per perk as a template with slots. A validator checks each template against the ledger (allowed slots, tier consistency, no numbers outside slots, no behaviour prediction) and discards anything it cannot support. A deterministic orchestrator runs the same steps when the model is unavailable.
- Stack: Next.js 16, TypeScript, Tailwind, Vitest (434 tests on synthetic fixtures), Upstash Redis for daily limits, Vercel. Example segments are served from a server-side cache in about 70 ms; custom segments run live within daily limits.
Challenges I ran into
- Qloo affinities for a fixed candidate list sit in a narrow band, so raw scores are hard to read. Ranking within each category and cutting into three tiers made them usable, and the sensitivity line shows how many bundle perks survive when the cuts move.
- A location signal silently drops candidates outside the area, so it is optional rather than default.
- Claude Opus 5.5 always thinks, and thinking tokens count against the output budget. Short structured calls were truncated until I sized the budgets for thinking plus JSON and lowered the effort for those calls.
- The first result screen led with "Skip 8 low-fit perks", which is true but names the wrong thing. A review by five AI reviewer roles (judge, designer, target user, skeptic, copywriter) rebuilt it around what to fund, and a second round of design, frontend and marketing proposals produced the editorial look you see now.
Accomplishments that I'm proud of
- Every number on screen can be traced to a Qloo response, an arithmetic step, or a labelled assumption. Nothing is invented by the model.
- The explanations are model-written but code-verified: 25 of 25 passed on the first try across the two examples.
- The example segments run from a server-side cache in milliseconds; custom segments run live within the daily limits.
What I learned
Most tools use Qloo to discover things. I use it to score a fixed list of commercial candidates across four categories for one audience, and the product is the gap between taste order and popularity order. Taste data is most useful as a contrast, not a score: the popularity order and the taste order of the same candidates barely agree for a given segment, and showing both side by side is what makes the recommendation legible.
What this does and does not show
It ranks candidates for a segment and prices the cost of ignoring that ranking inside a budget. It does not show redemption lift. Costs and usage shares are labelled assumptions, and the on-screen holdout plan is how a team would test the hypothesis on 10% of members.
What's next
- Import a partner rate card so unit costs are negotiated prices, not illustrative ones.
- Run the holdout plan with a live program: two bundles, comparable member groups, segment-level redemption as the metric, a pre-agreed threshold to keep or drop the taste-based bundle.
- Take the segment from the program's own aggregate interest data and the catalog from its real partner network.
Responsible use
PerkFit reasons about audience segments only. It never scores an individual, and taste fit is not a forecast of anyone's behaviour, credit or finances. Usage shares and unit costs are editable assumptions and are labelled as such on screen.
AI assistance
The problem framing, product decisions, safety rules and acceptance of every design and screen are the author's. Claude (Anthropic) worked as a coding assistant under that direction: drafting the design from the author's plan, writing most of the implementation and tests, and running structured reviews, with the author testing the result end to end and owning the submission. At run time the app calls Claude Opus 5.5 for the agent loop and explanation templates, and every sentence it writes is checked by code against the evidence ledger before it is shown.
Built With
- claude
- next.js
- qloo
- tailwind
- typescript
- upstash
- vercel
- vercel-ai-sdk
- vitest

Log in or sign up for Devpost to join the conversation.