-
-
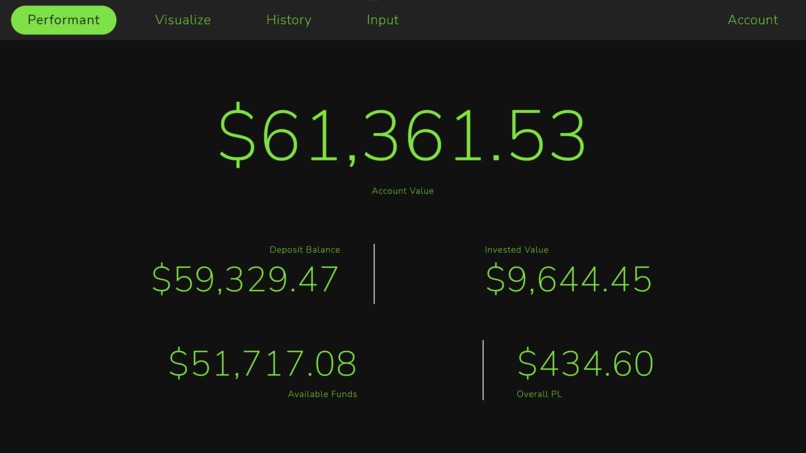
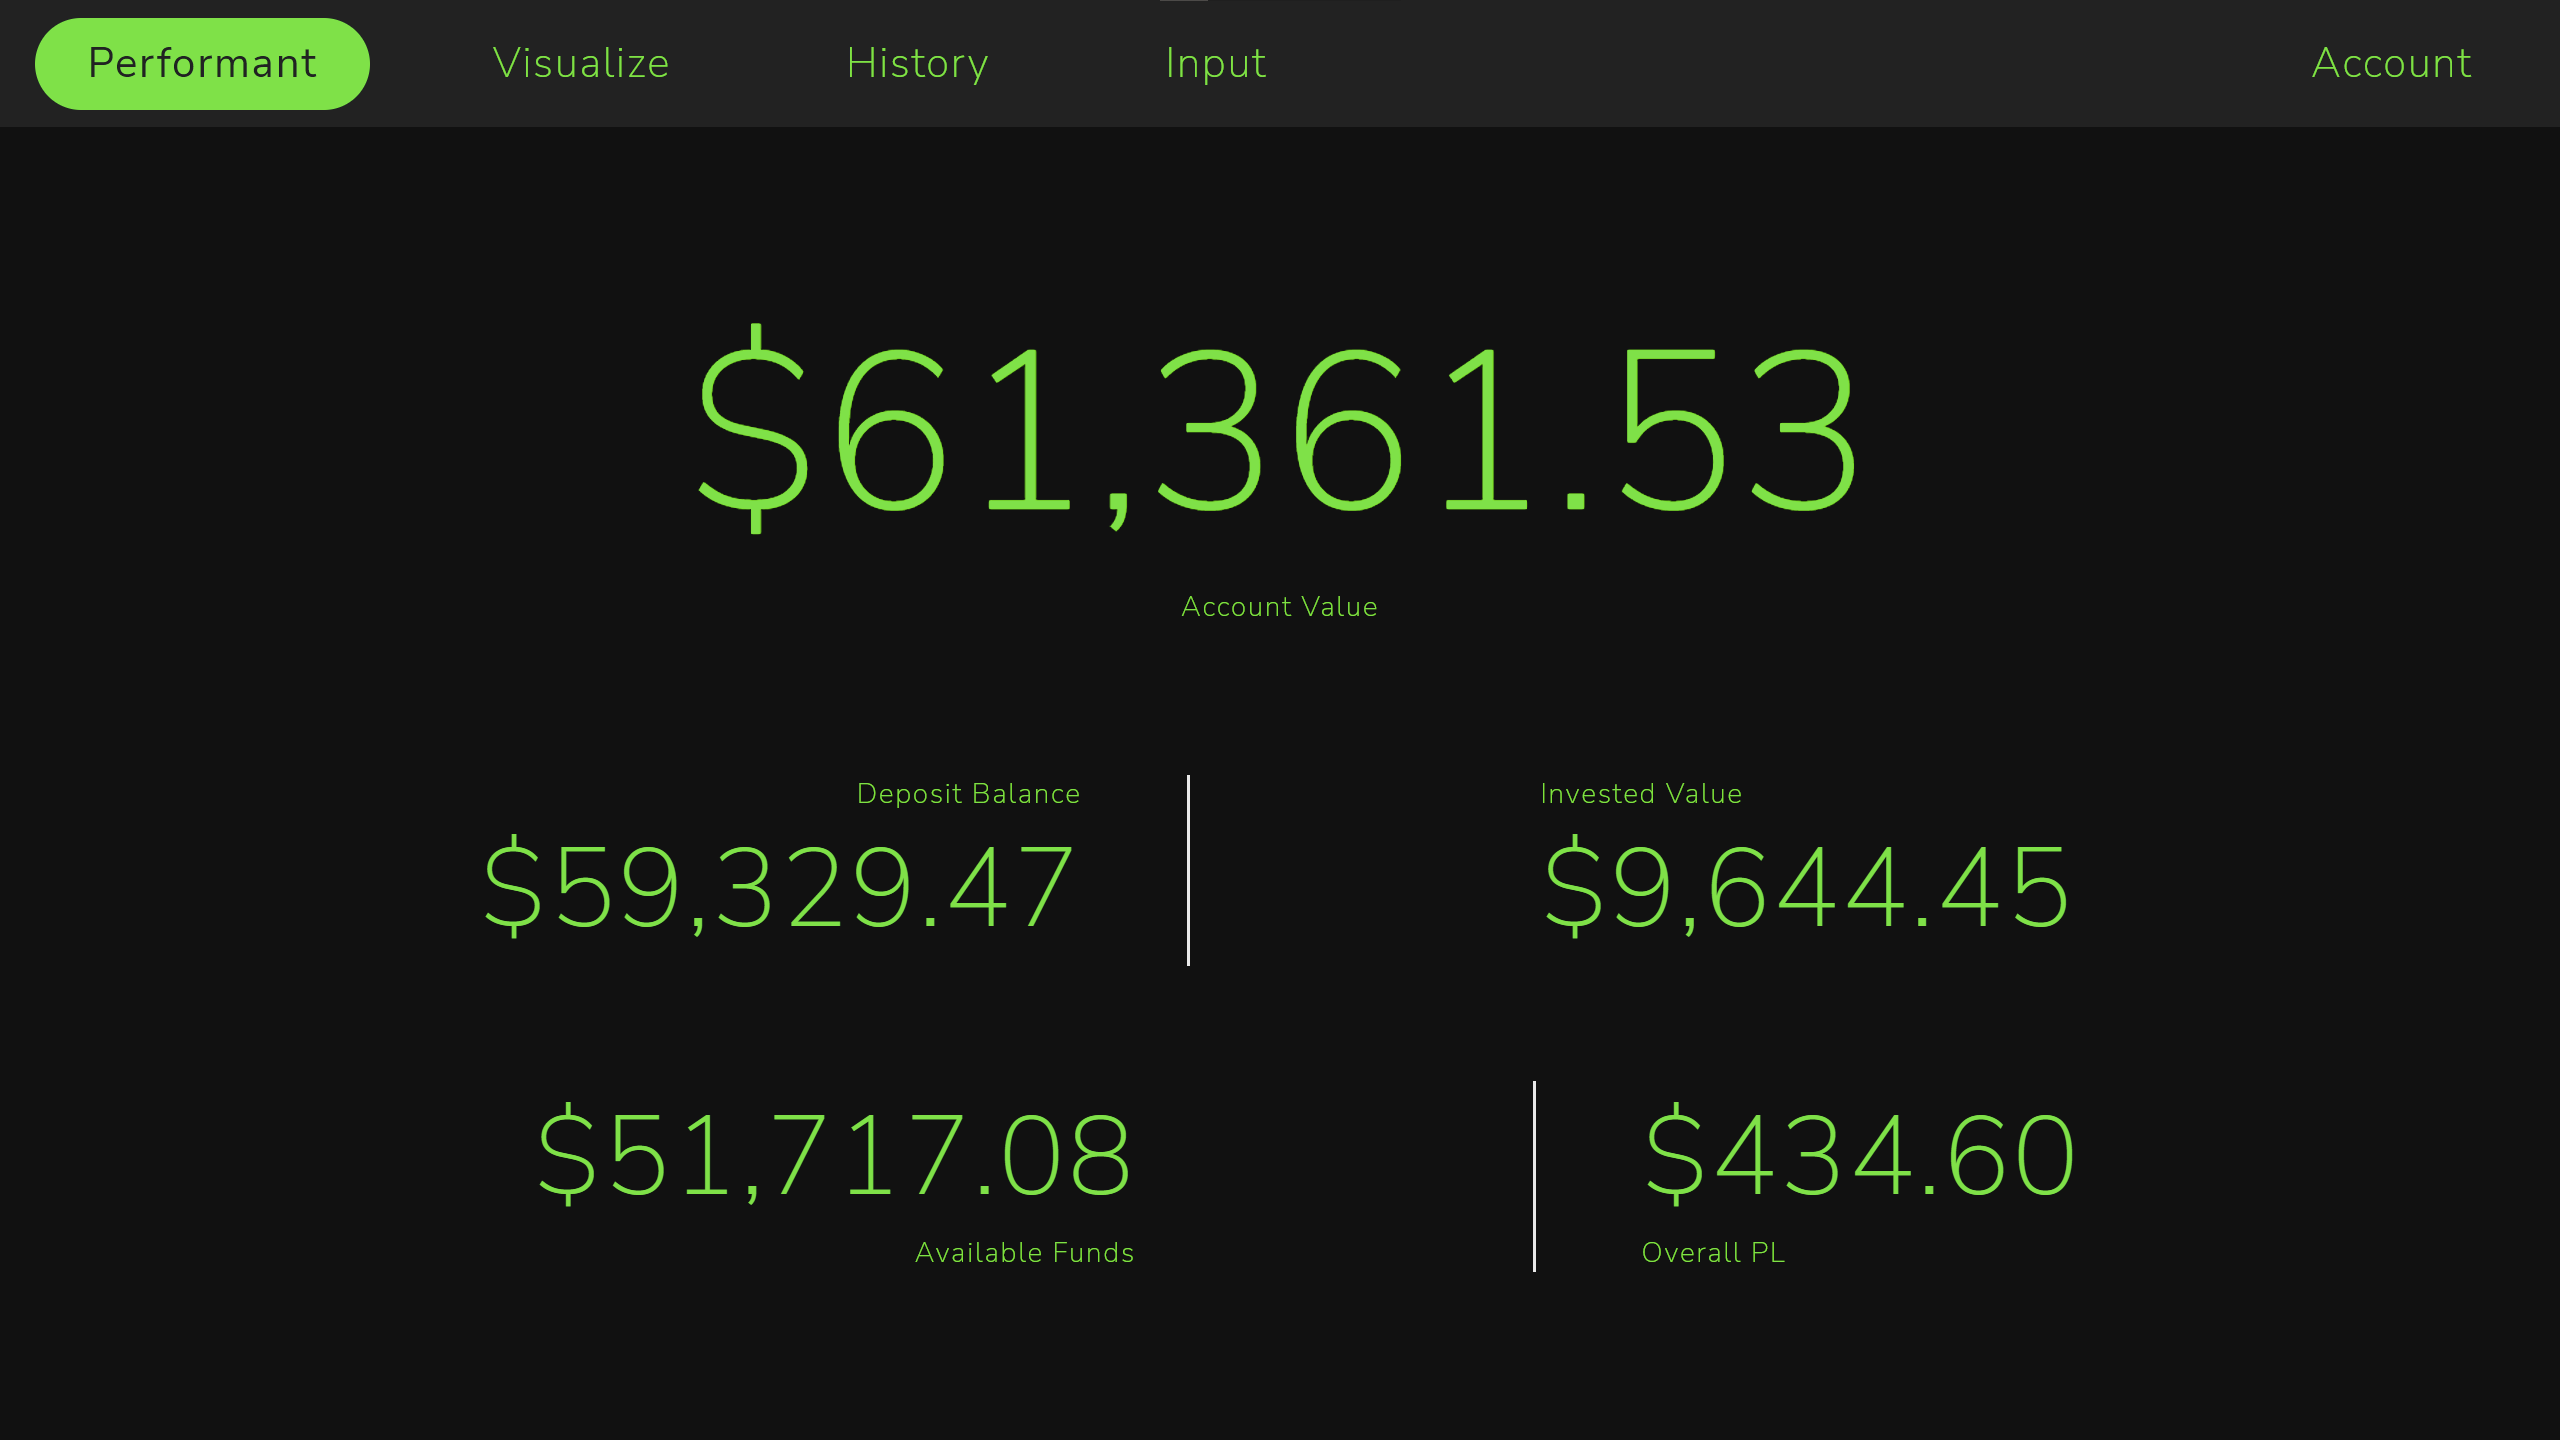
The home page for Performant with the total account value, deposits, investments, free cashflow, and an estimated profits and losses.
-
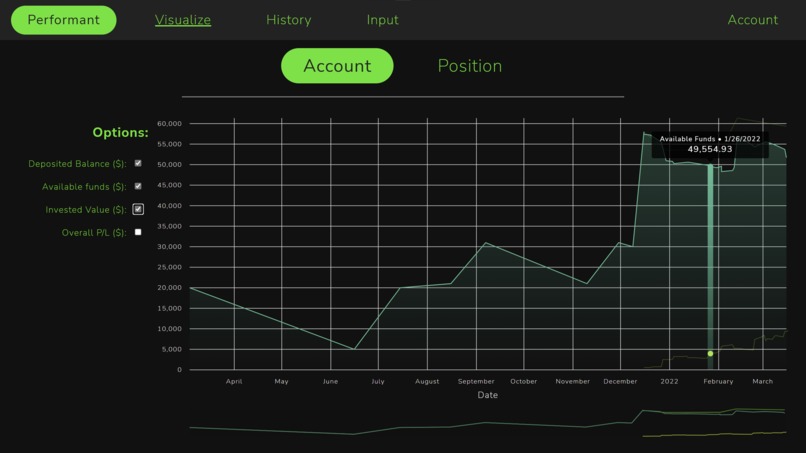
Demonstration of the account visualization tool, targeting available funds in the account over time.
-

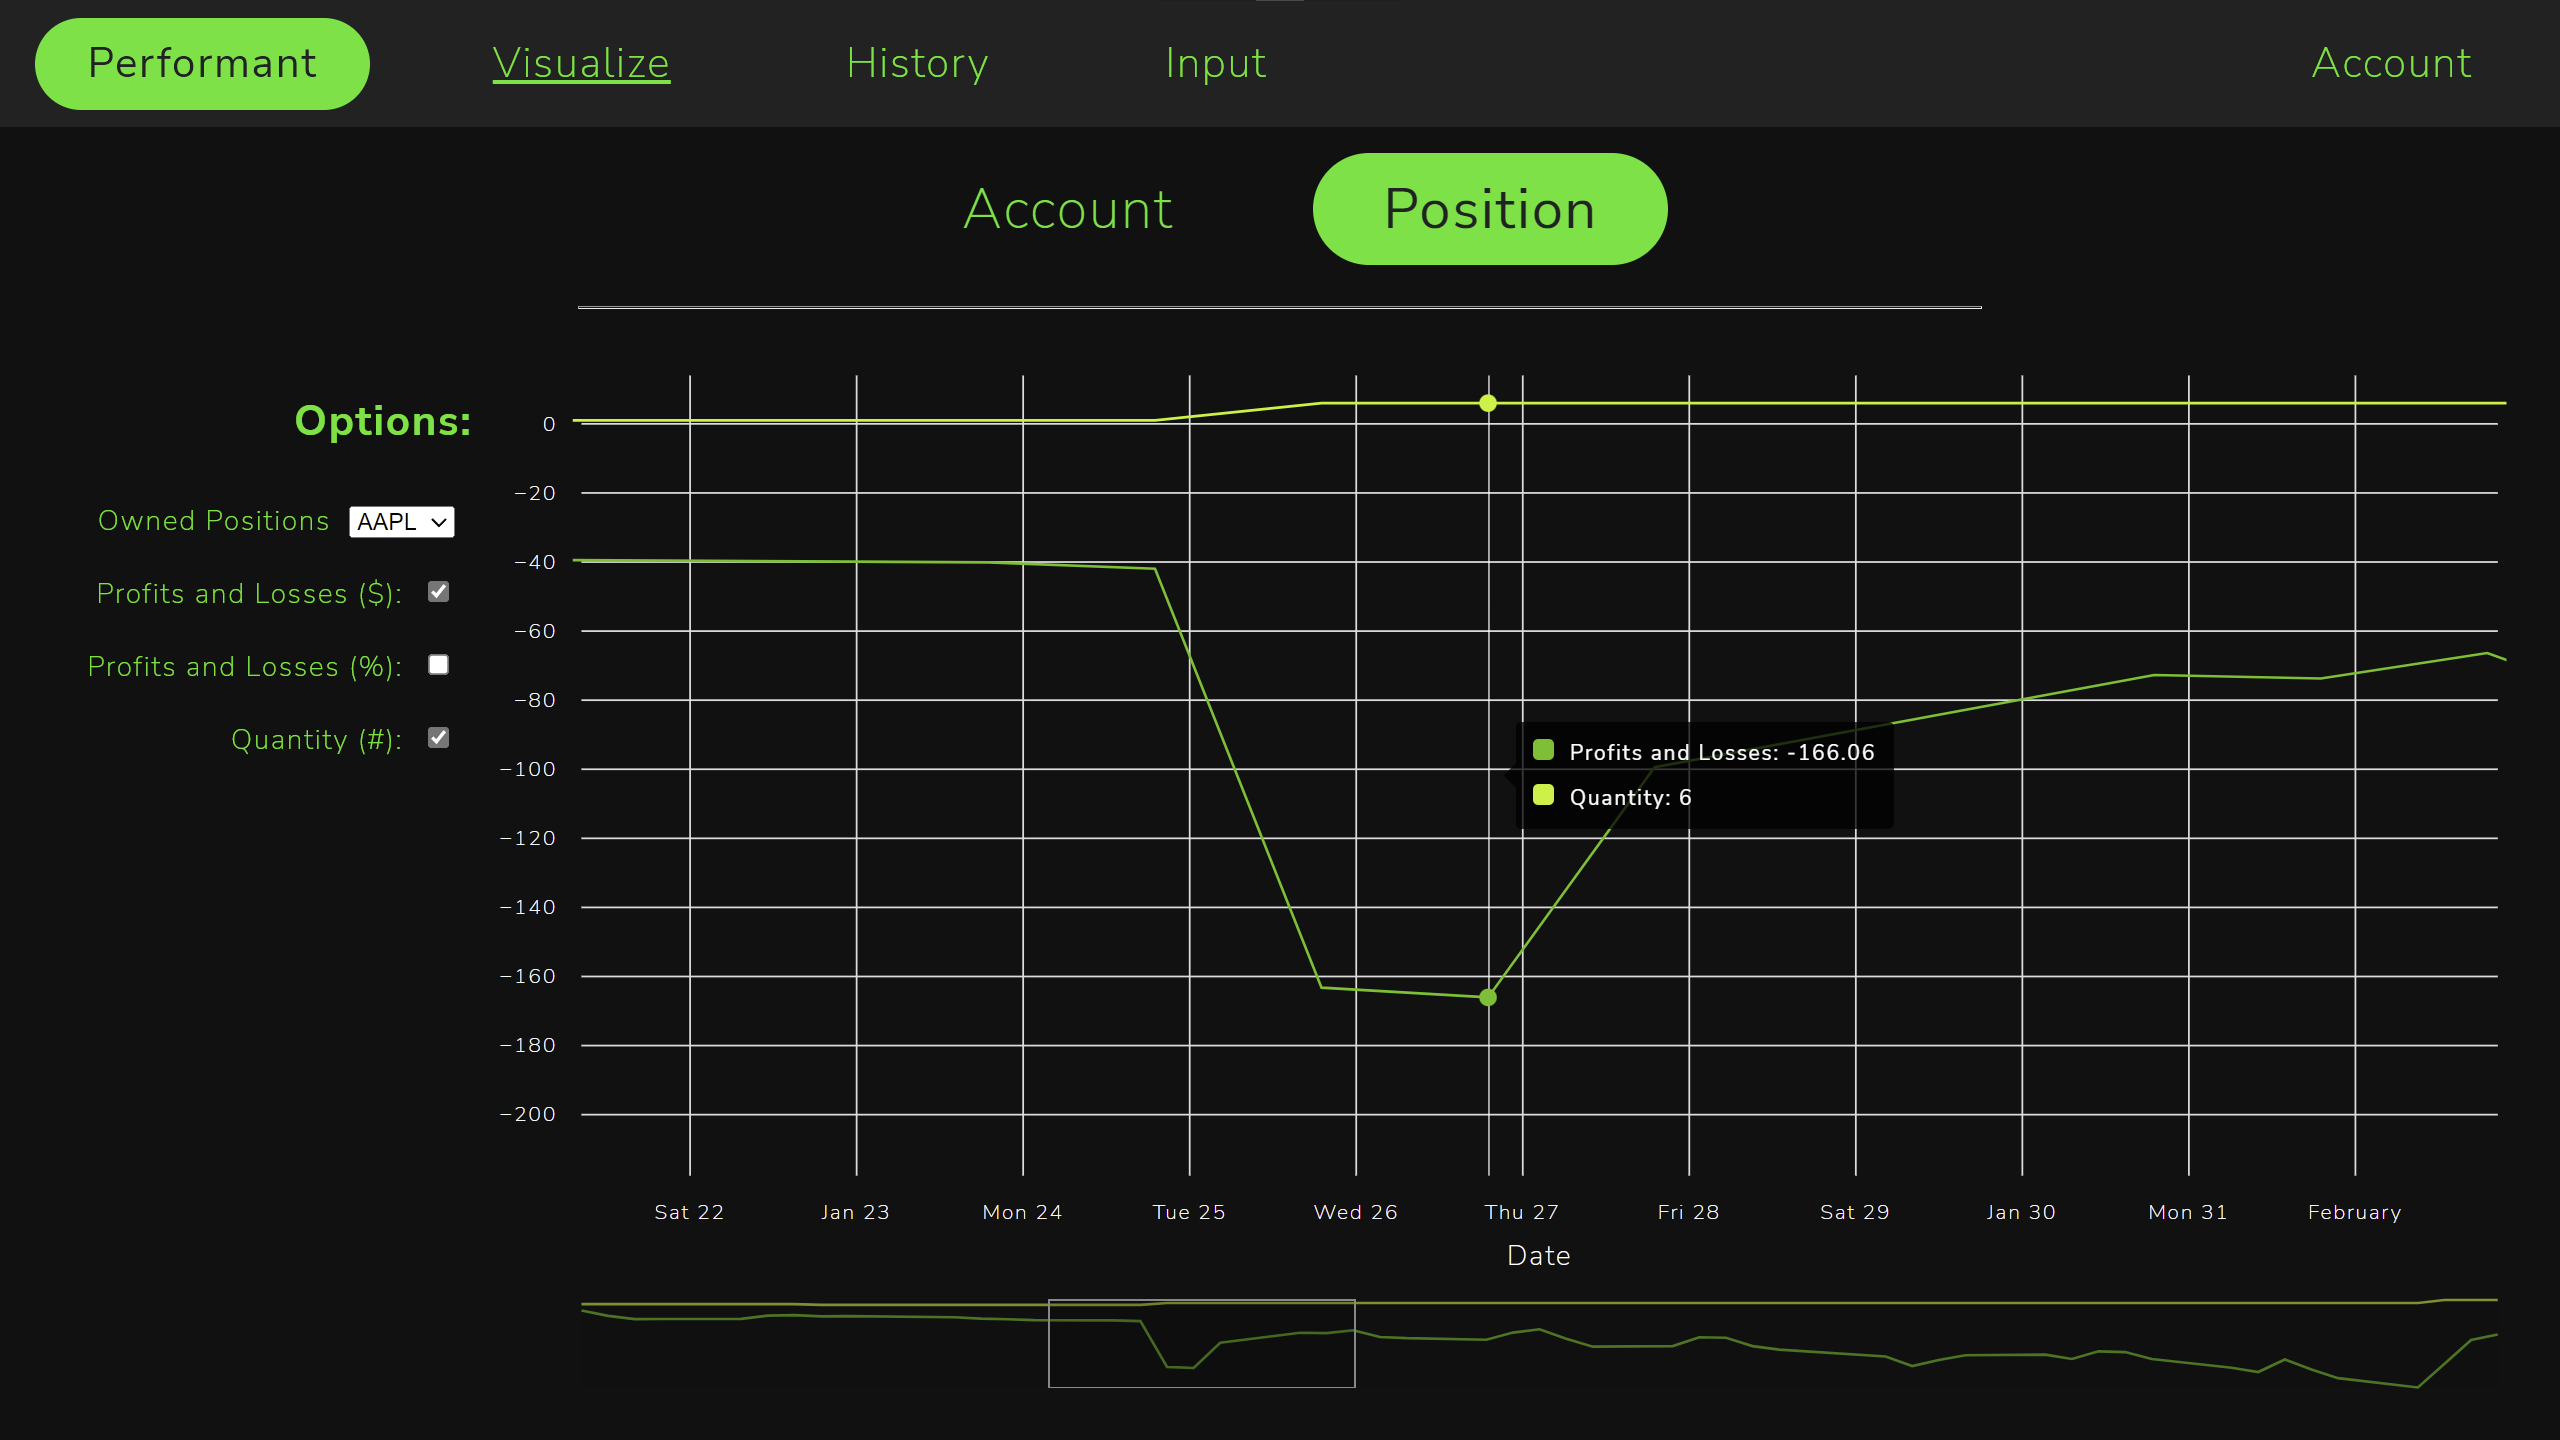
Zoomed in on the position (AAPL) analysis tool considering the quantity vs profits and losses.
-
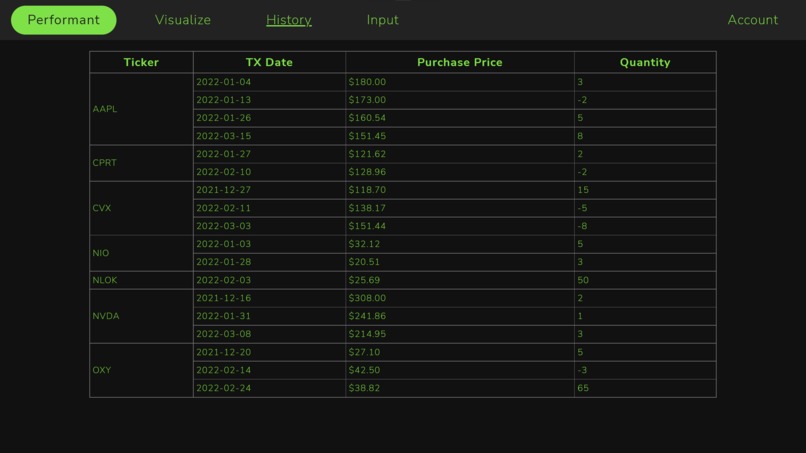
A digest of all of the past transactions made on the account so far, including the ticker, price, quantity and transaction date.
-
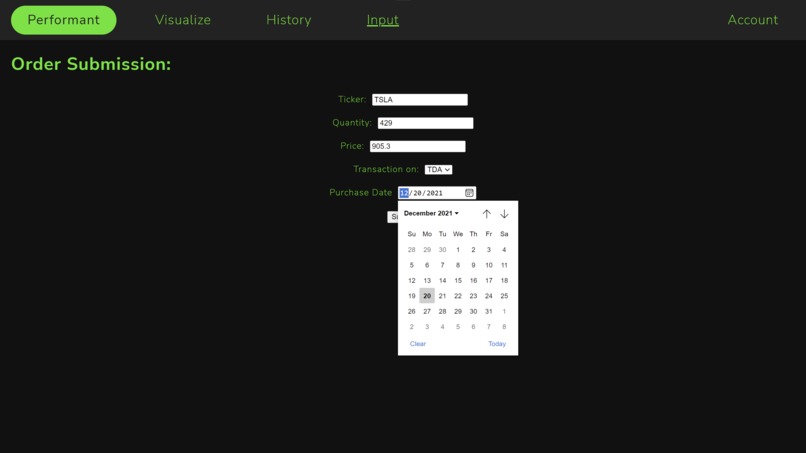
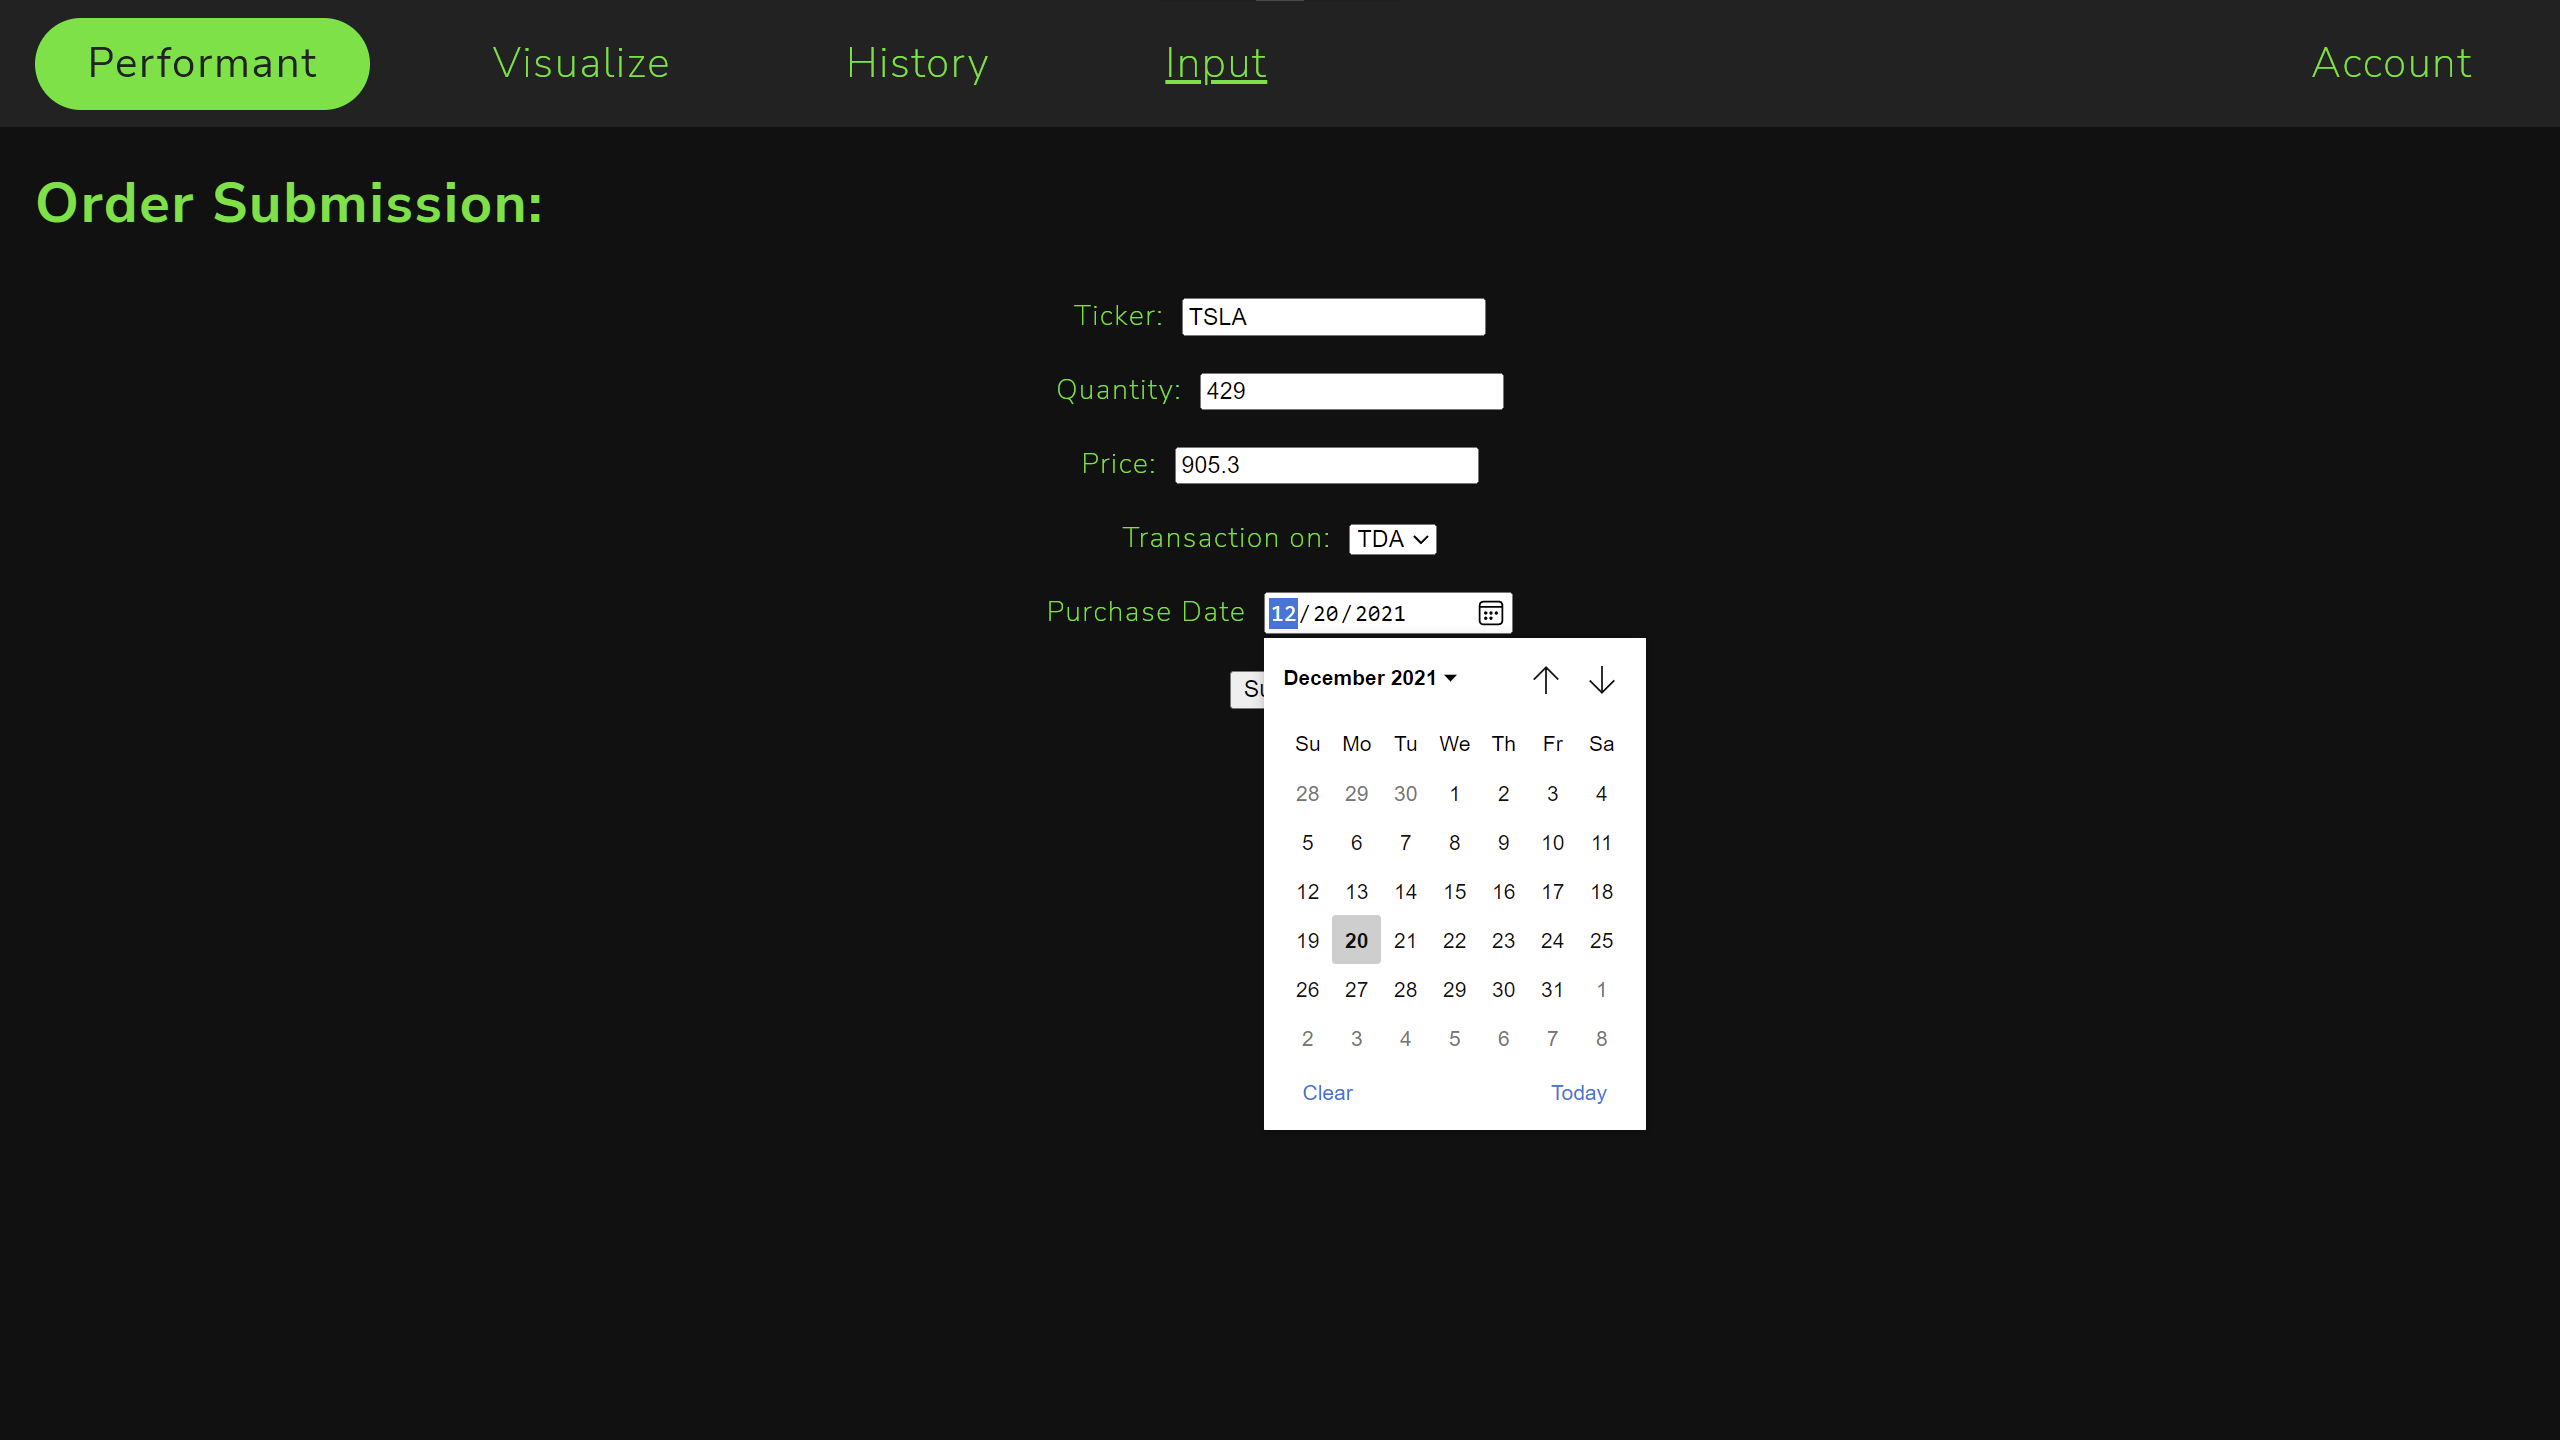
The stock input page which allows you to enter a new position demoed with TSLA stock.
-

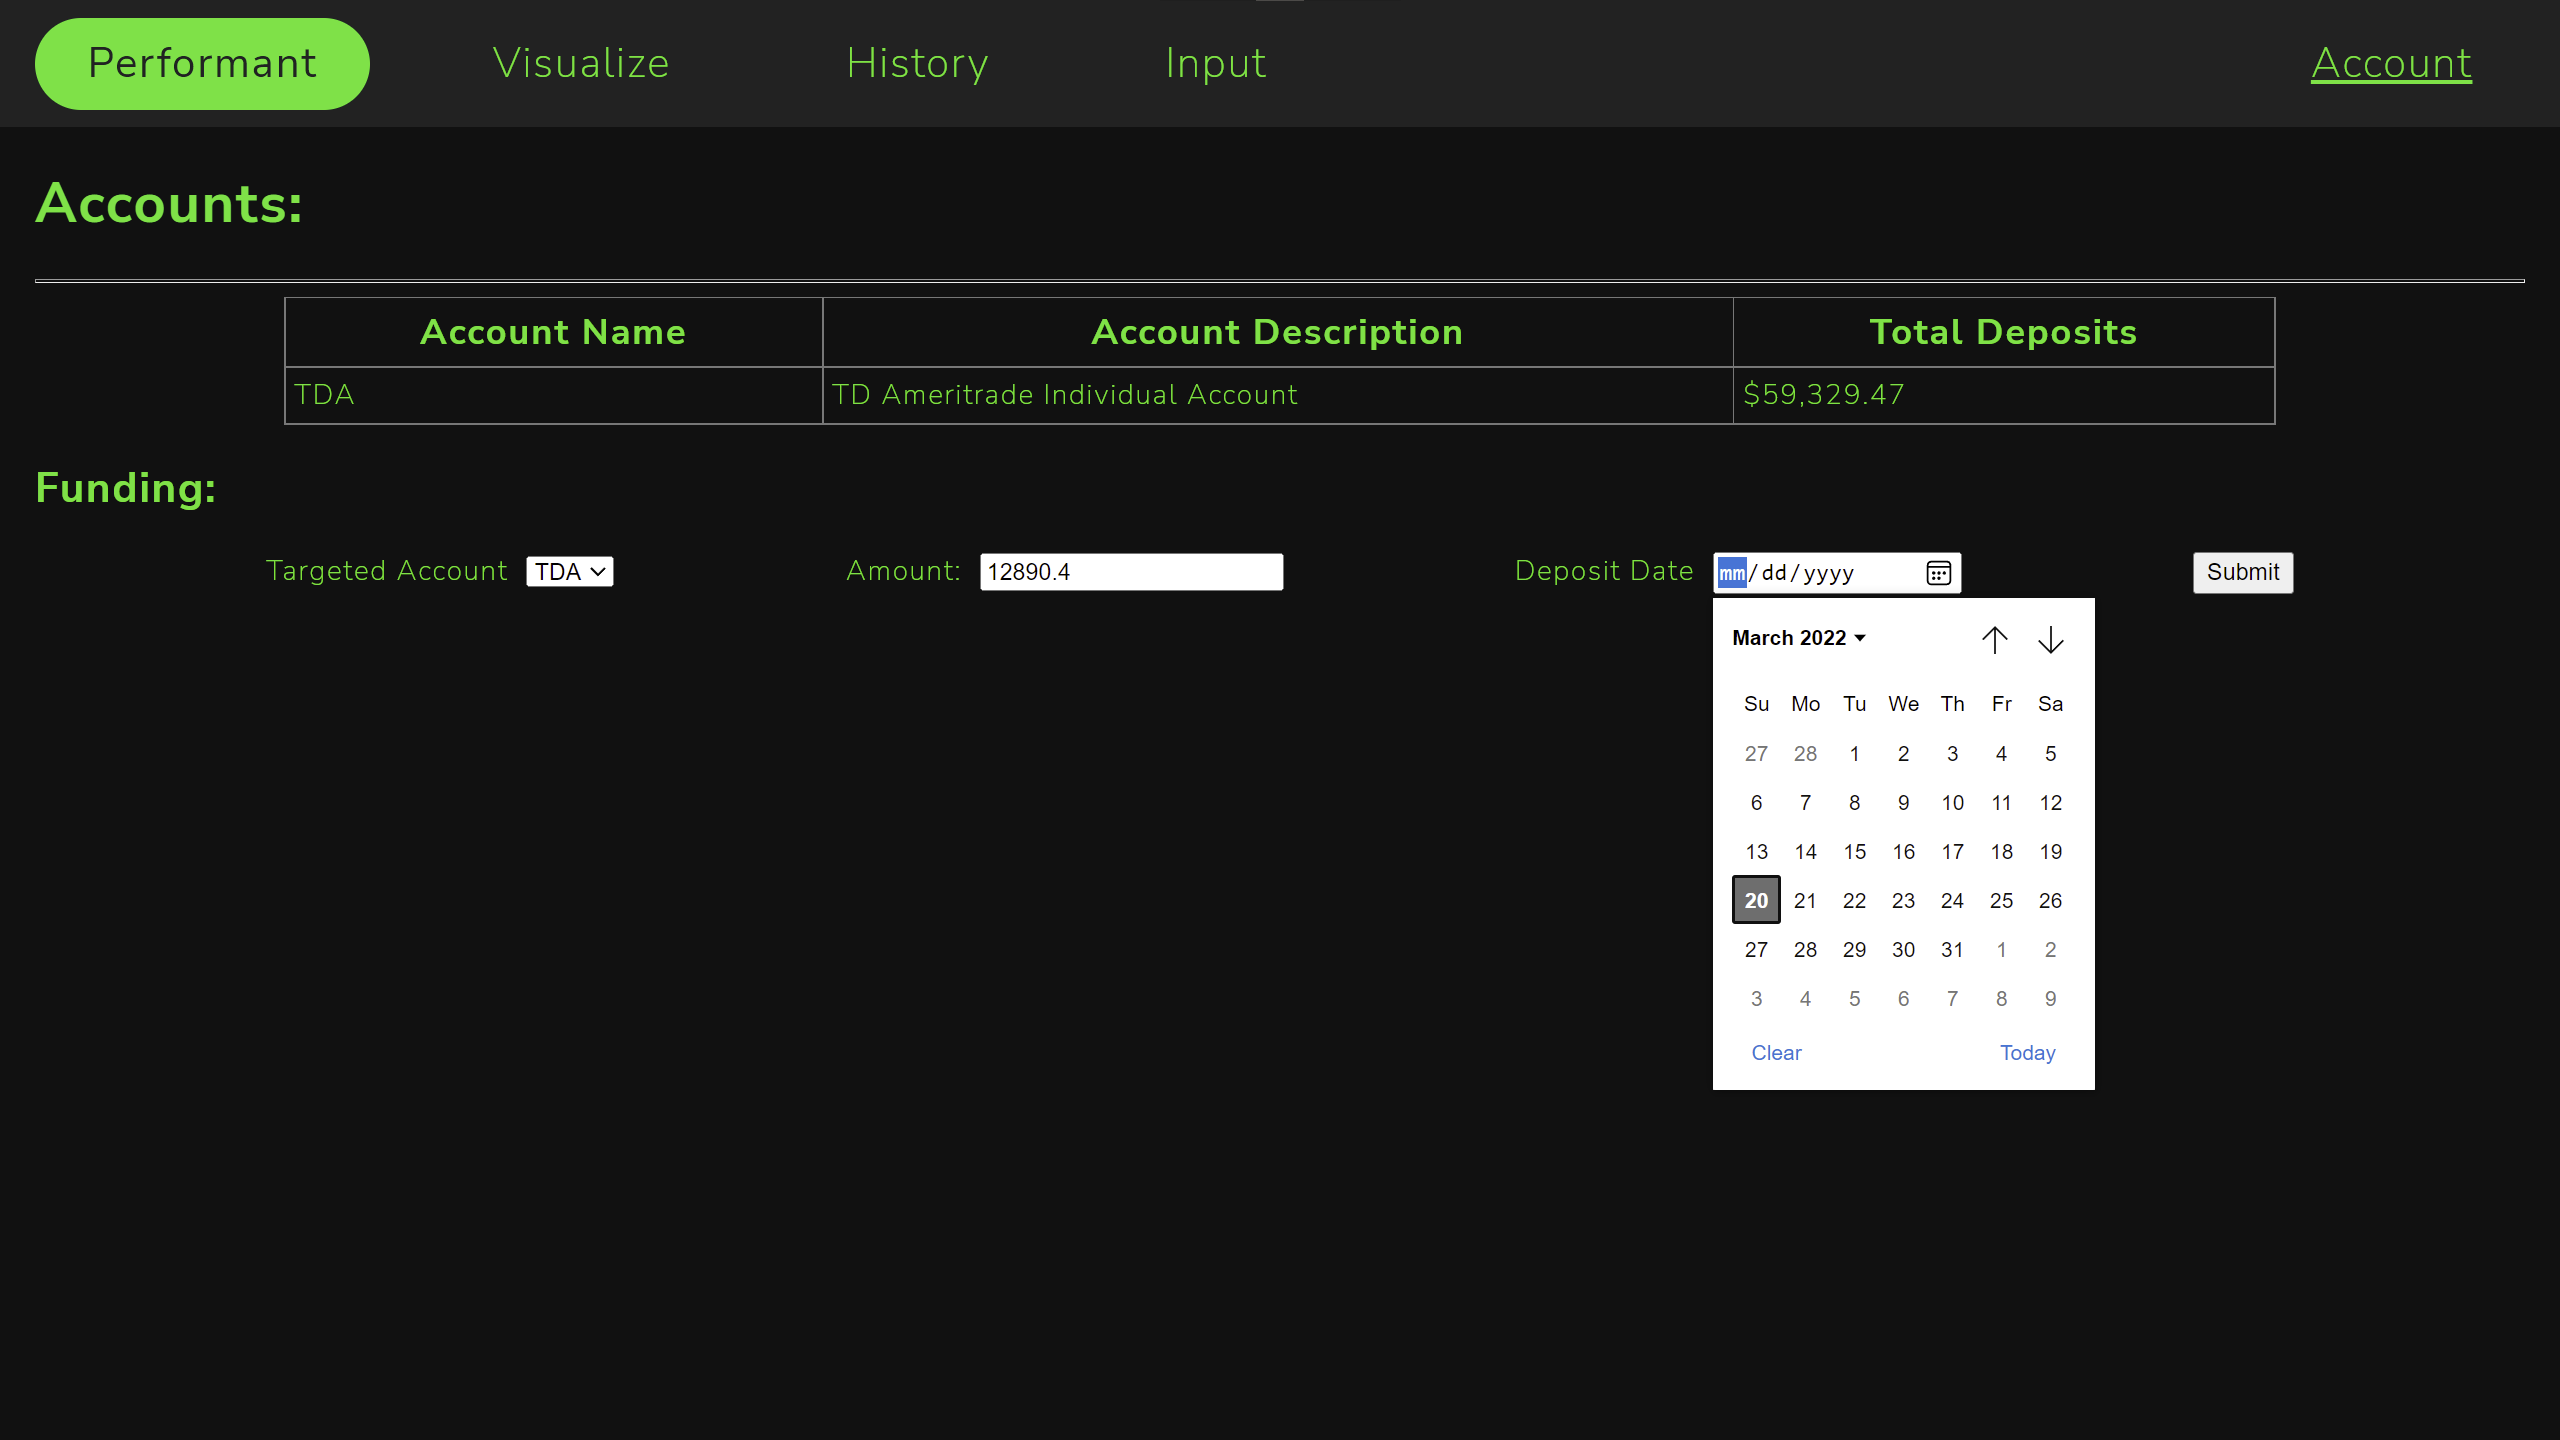
The account funding page which allows you to deposit or withdraw from an account.


Inspiration
Successful investments are all about managing risk and evaluating factors that may be beneficial. As such, there are many calculations, averages and metrics associated with it. Even more so when you consider technicalities such as selling designations (FIFO) and other of the other hundred bits of information necessary. All of this information has made the investment space difficult to track, making it hyper cluttered.
What it does
Performant hopes to remedy this by providing a single, simple, and semi-automated process for getting a high-level overview of your investment portfolio. This could then inform you of your risk tolerance, or the general market trends compared to your decisions. Perhaps it might even illustrate how bad you are at this, saving you money in the long run by pushing you towards safer strategies such as ETFs and Funds!
More in the details, Performant provides a simple account funding and stock transactions page, which draws from TDA's market API and calculates useful metrics automatically. There are then spaces to allow you to explore graphs and summaries. In this regard, it is meant to inform your own decisions, and not meant for high frequency or intra-day trading.
How we built it
In a nutshell, this is an Angular SPA built with Typescript, SCSS, and HTML using graphing library ngx-charts which is supported by a flask / python backend talking with both a Postgres 14.2 database using psycopg2 and the TDA Ameritrade Developer API through the python requests library.
But honestly I still can't believe I was able to get it built.
If you are interested in learning more about how it's built (and hopefully less about the actual messy gluesticked-together code that a sleep deprived mind generates), feel free to check out the GitHub! I tried to make sure that I had all of the details laid out in each readme (one for the project, and then one each in backend, database, and frontend).
Challenges we ran into
1. ngx-charts: One of the biggest hurdles was using a graphing library. I have never used one before (and generally stick away from them) but I needed one for all of the graphing tools. Even though it did work in the end and does look nice, there were a lot of issues trying to get it fully integrated and styled (such as issues between global and local styling because they're Angular components). These issues also made me migrate the project to SCSS which was generally a set back.
In the future, I will definitely look into graphing libraries, or learn how to use them before working on a project centered around them...
2. Python calculations and timecodes Another major hurdle was not just doing the python calculations for PL or quantities, etc but figuring out how. What is semi-efficient, what can be stored, how the schema will handle it, how to translate it to / from the database... I am definitely not proud of the solution I came up with, but am proud of the fact that it is a solution.
Also figuring out timecodes. They make the world run, but it was very difficult juggling timecodes from TDA, storing them in Postgres, and then using them in angular. I'm still not sure if I did it right.
3. Feature creep Finally, it's highly likely I bit off more than I could chew. There were definitely a lot of features both on the table, and on the cutting room floor for this project. For instance, my starry eyed self wanted to add margin calculations, dividends, and custom timescales! But the reality of making something (and building the entire stack) within 36 hours quickly caught up with me.
Accomplishments that we'reI'm proud of
To be honest, I'm fairly proud of being able to finish the entire application on a whole (by myself). If you told me that I would be creating a database from scratch, linked to a backend API from scratch, serving a frontend UI from scratch, used for investment management which was linked to TDA's trading API all in 36 hours, I would have curled up in a hole and hid.
But all in all, the look, the not-completely-broken-ness of the application, and the reasonably okay organization of it is, nice to see :)
What we I learned :(
How to use Flask! I didn't realize how simple it was to use. Especially when it comes to creating a simple python connected backend API, I will definitely be coming back to Flask. Especially since it's easy and quick to connect with Postgres through psycopg2.
ngx-charts. A lot of stuff sucks to learn the first time and this is definitely one of those cases. Even though I think I've come out of this with a severe dislike for ngx-charts and the sad state of documentation for it (even as one of the premier Angular graphing libraries), I can see myself learning about their custom graphs.
How to use APIs. Quite embarrassingly, REST APIs
wereare quite foreign to me so being able to work with the TDA API was a pretty big leap forward. Since it also includes real trading, this was a very nice jumping off point for me to delve more into it and figure out what I can do with it beyond just price history.
What's next for Performant: Semi-Automated Investment Analysis
Pure heartless abandonment for at least a couple hours while I get some much needed sleep.
I want to actually use this, so I will keep developing it and most likely deploy it to a local server (while cranking up the automation to 11). As a local server, I wouldn't have to worry (too) much about security, and can use the application very much like it is now. Hopefully I don't lose all my money!
I originally wanted to build this using some technologies like React, but I had zero experience so I went with tools I was more familiar with. But, in the future, I would like to try and port this into React since I heard React native apps were very nice. Long stretch goal for sure.
Built With
ANGULAR devpost, angular.js != angular. smh
Built With
- angular.js
- flask
- html
- ngx-charts
- postgresql14.2
- psycopg2
- python
- requests
- scss
- typescript

Log in or sign up for Devpost to join the conversation.