-
Perceptio
-
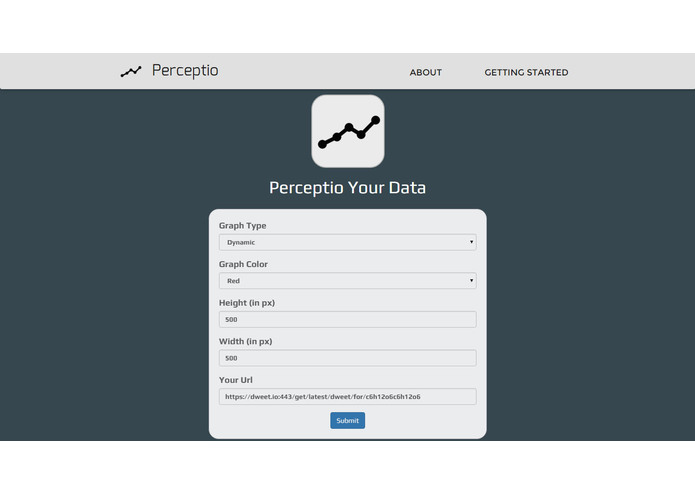
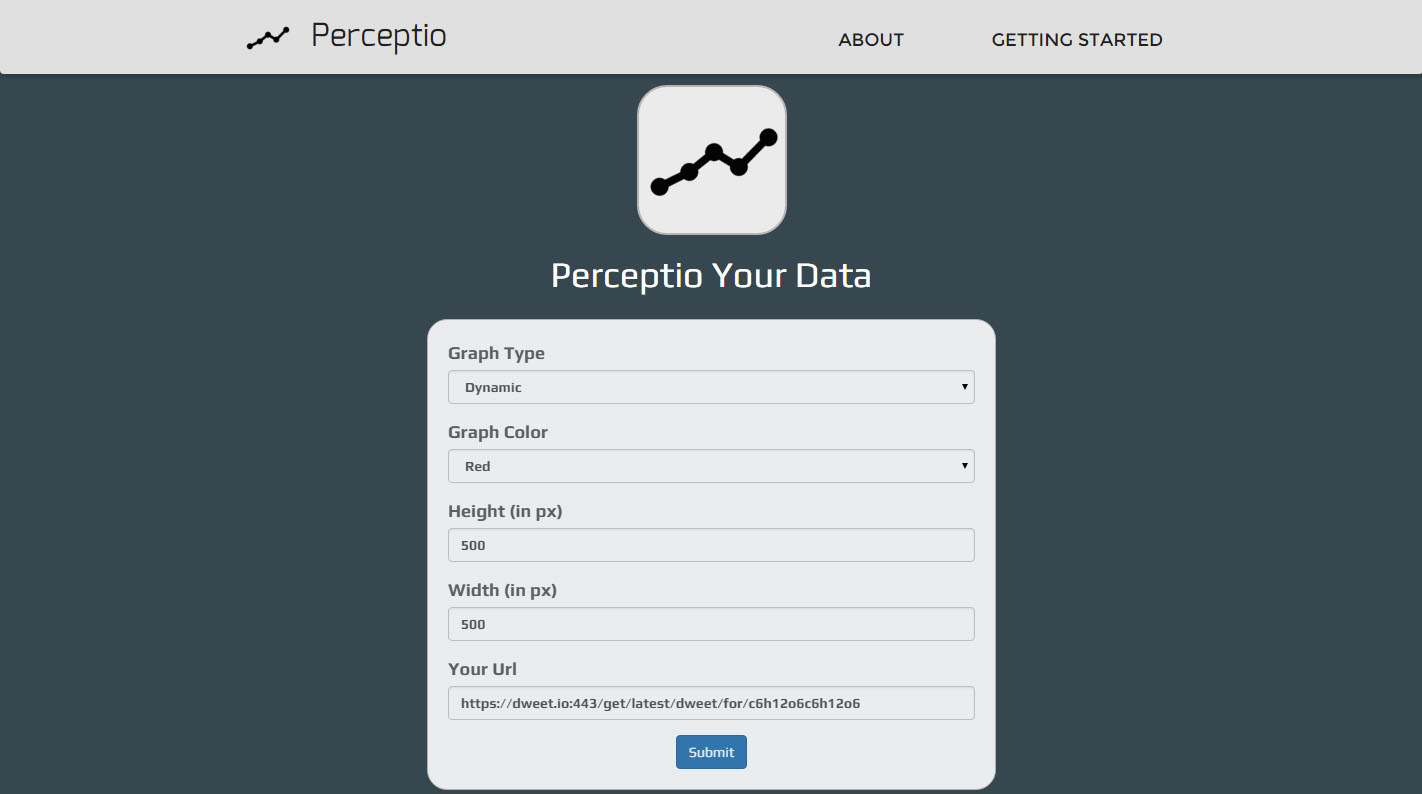
Graph Settings
-
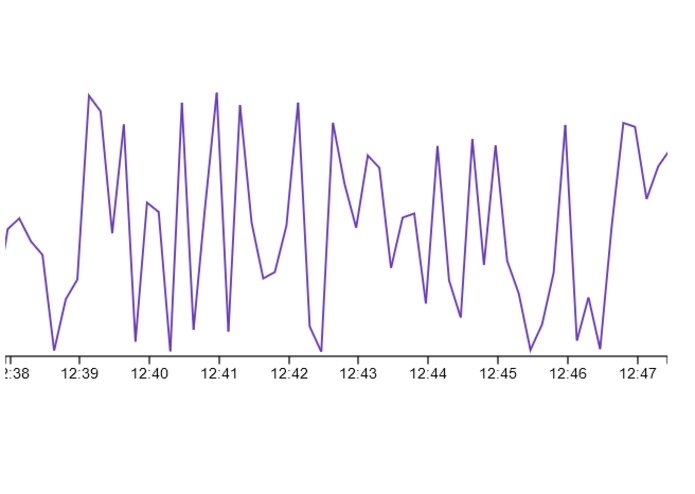
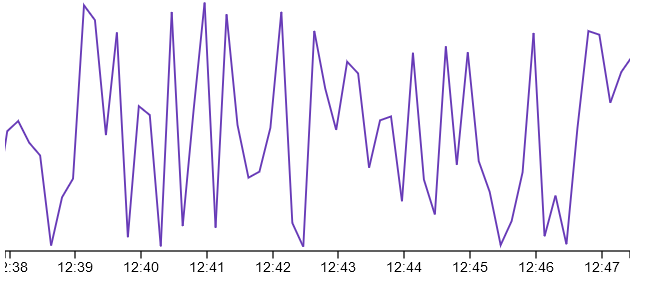
Graph Plot

Inspiration
Once upon a time, a furious king in the land of ksami was trying to visualize the data of all his villages in his city, however he could not find a application that could do what he wanted. One poor villager called zjion decided to resolve the issue by calling in the members of the secret chamber. ken-chan, guohao-kun, nigel-kun and thearith-sama then went on a mission to solve king ksami problem...
What it does
Simplifies the process of visualizing data.
How we built it
We used node.js server along with d3.js library to render the graphs.
Challenges we ran into
Servers-side rendering of SVG to png. Scaling of all graphs.
Accomplishments that we're proud of
The front-end interface. Realtime graphs and server-side rendering.
What we learned
Phantom.js / D3.js / How to handle realtime data. Structure of a web server. Design and testing.
What's next for Perceptio
To implement other types of diagrams such as pie charts and venn diagrams and 3d visualization

Log in or sign up for Devpost to join the conversation.