-
-
Presentation, readable in any browser
-
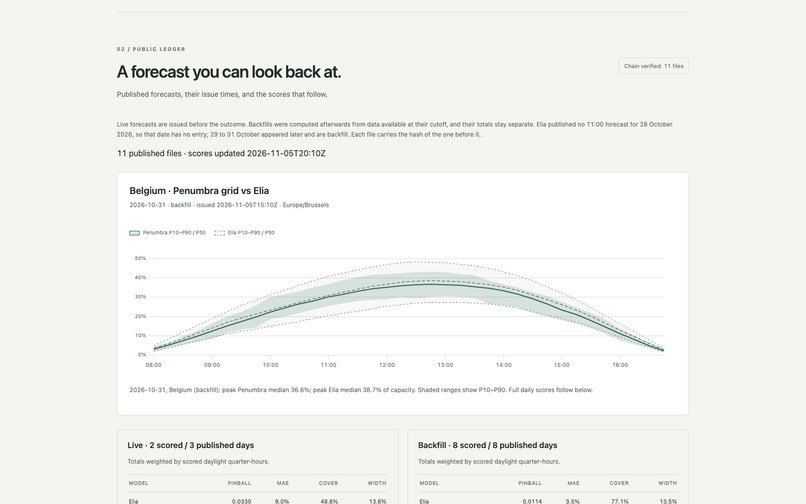
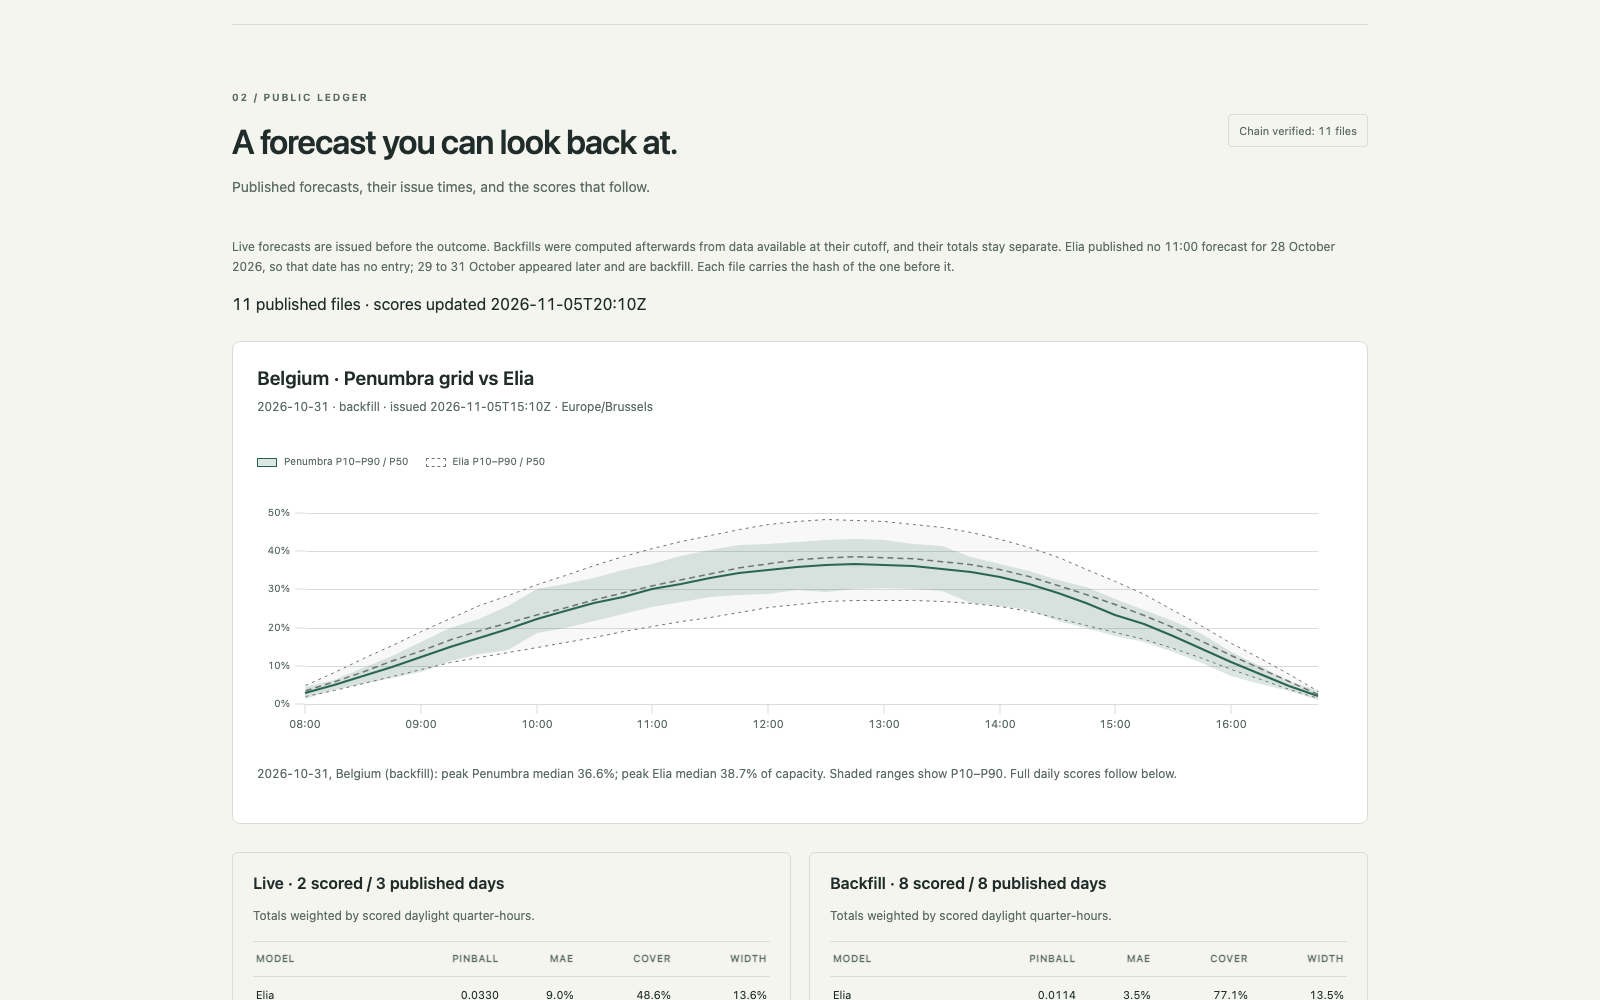
Public ledger: every forecast next to Elia's, scored the next day
-
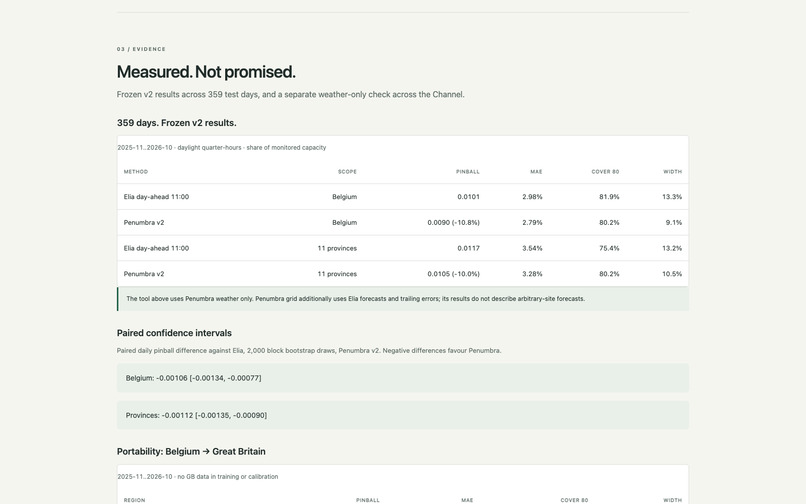
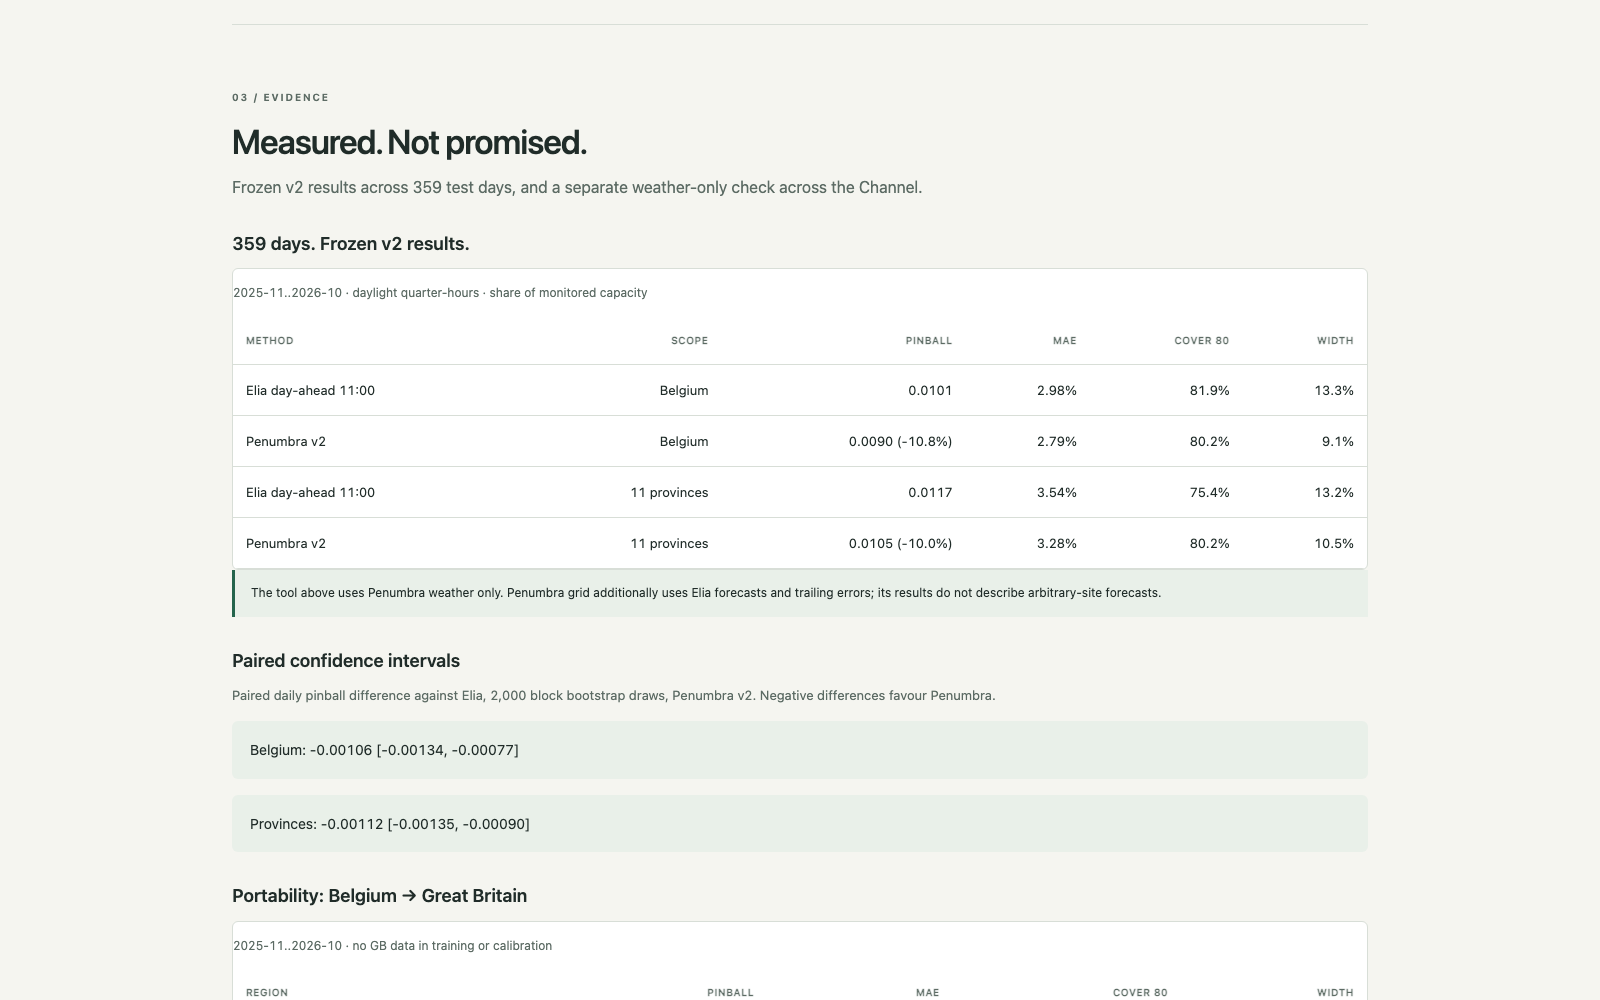
Evidence: 359 test days against the grid operator
-
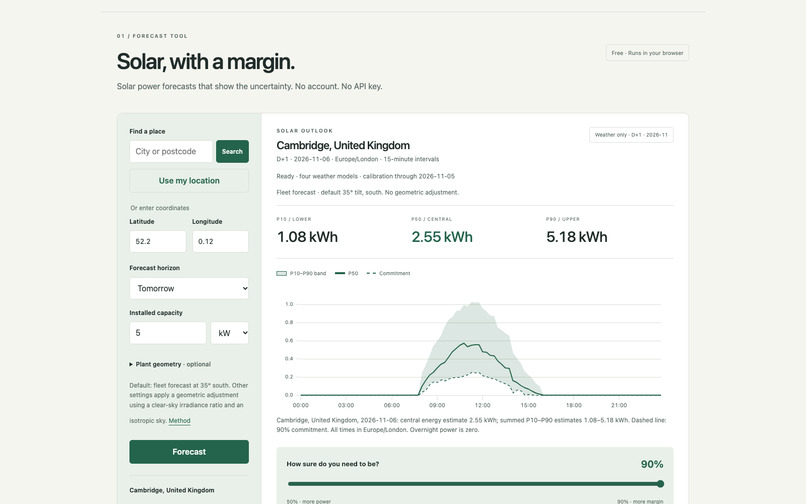
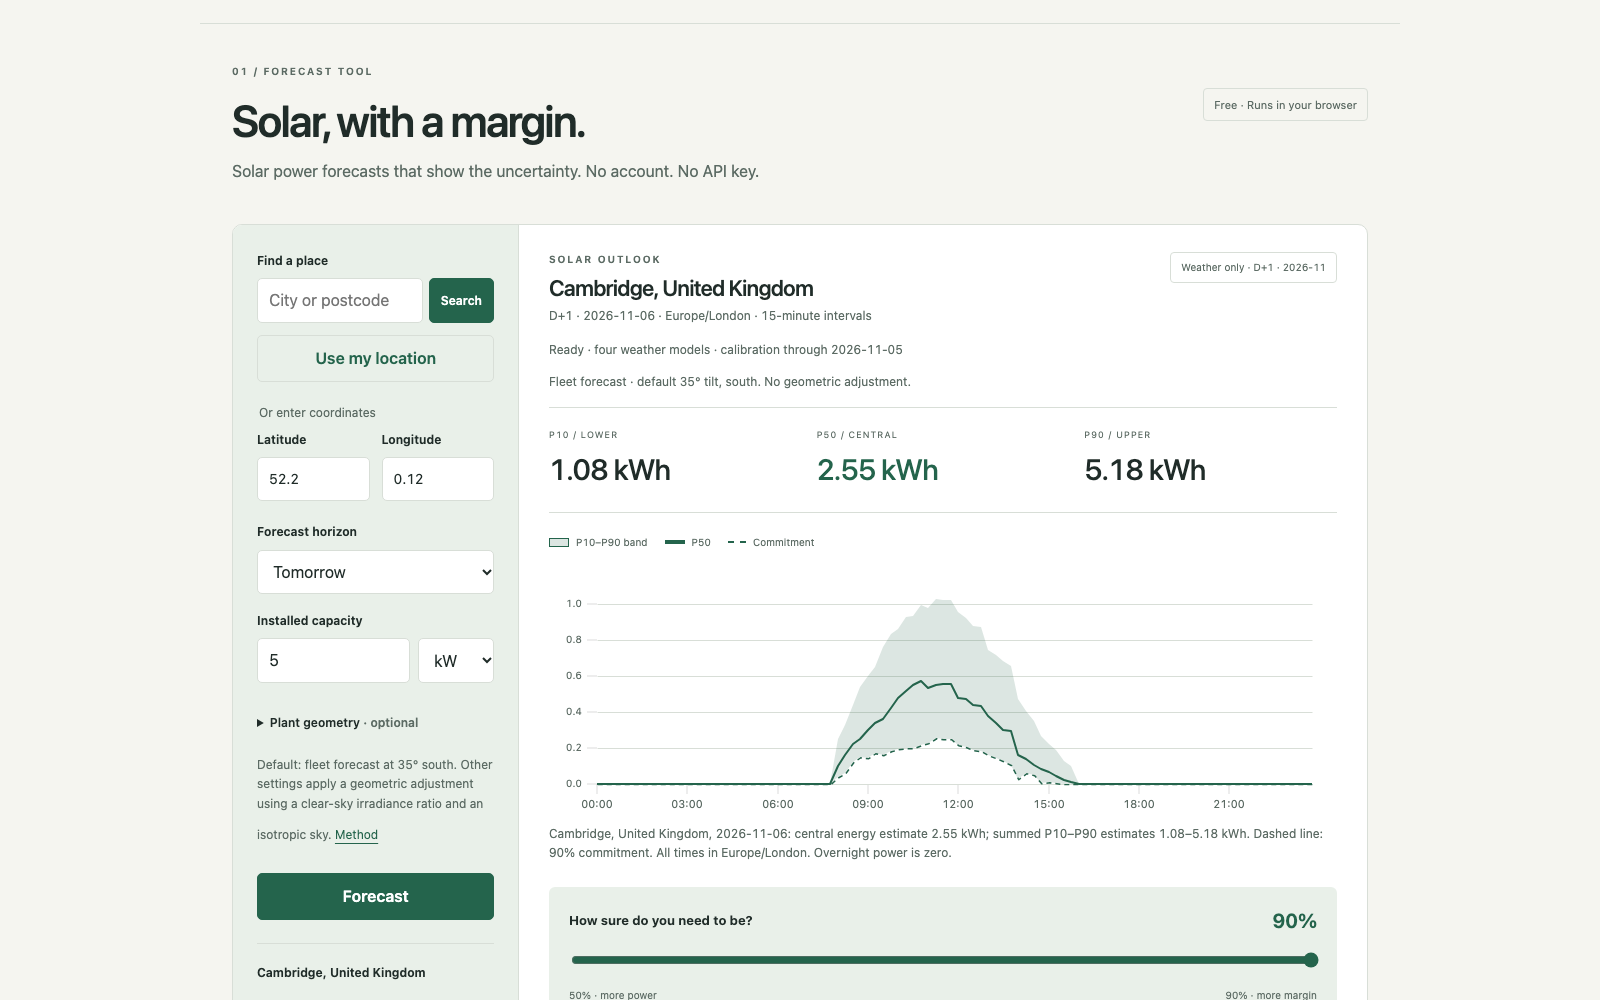
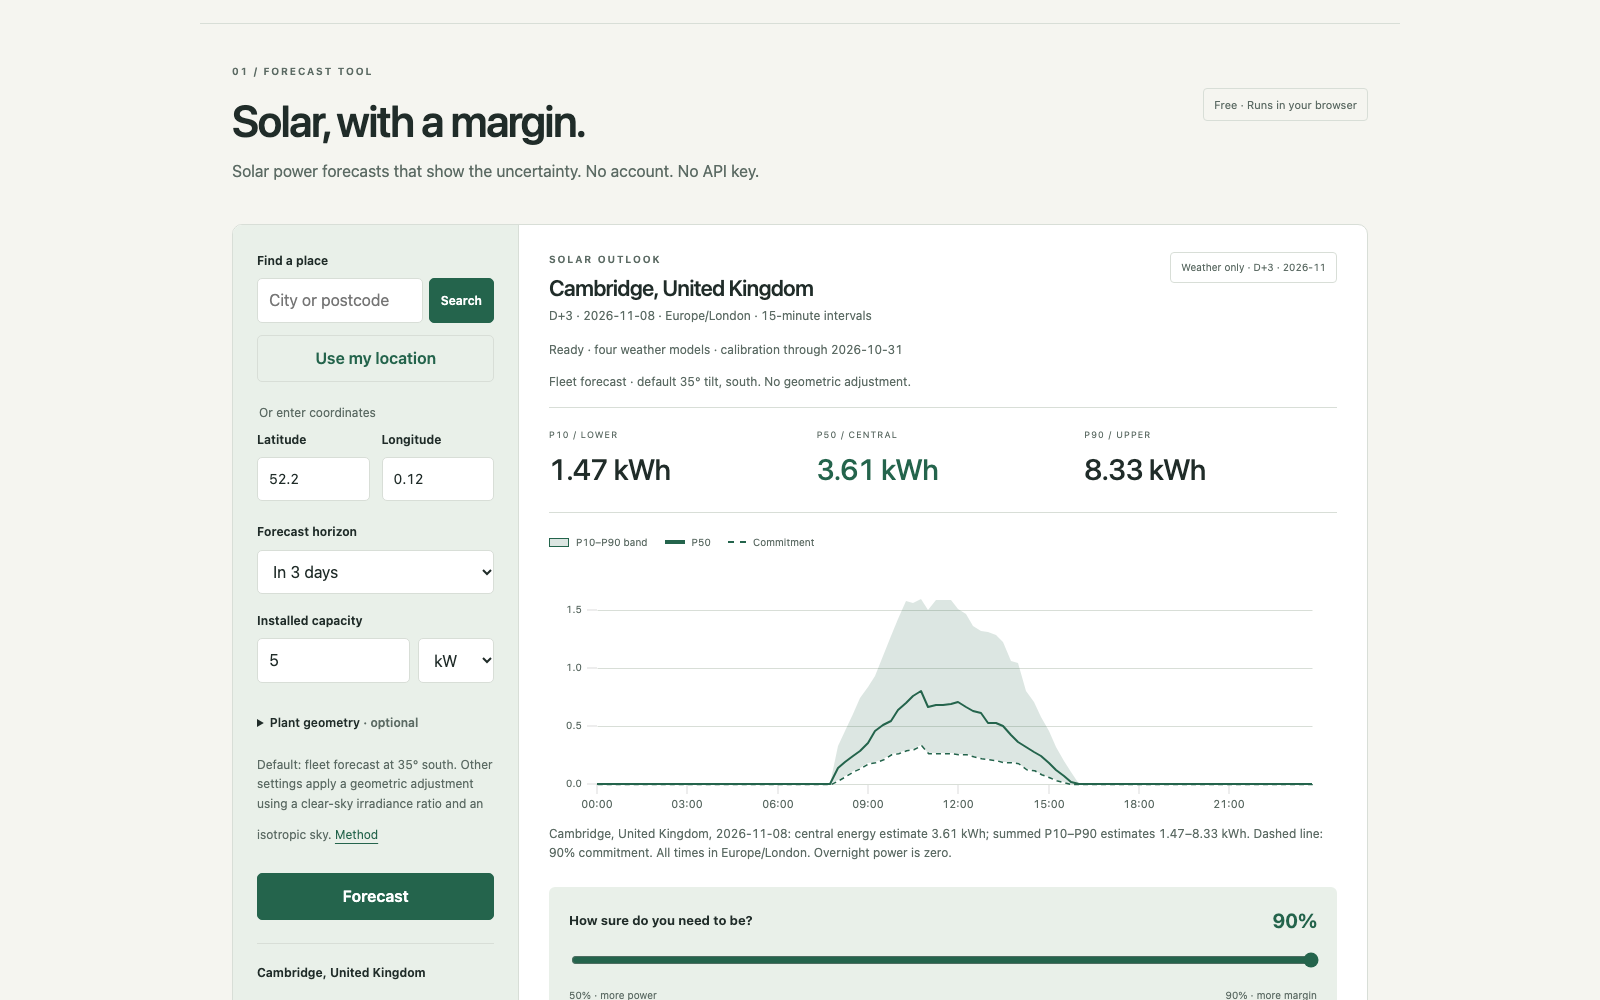
Forecast for any place and panel setup: low, expected and high range, with a conservative plan line
-
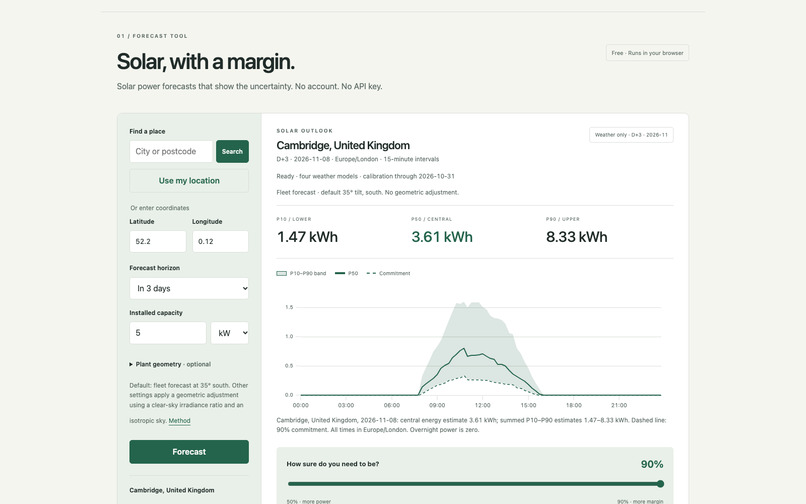
Forecasts for tomorrow, in 2 days or in 3 days
Overview
Penumbra is two things built on one idea, learning the forecast error. A grid model forecasts Belgium's solar fleet every day beside Elia, the grid operator, and is scored in public. A planning tool brings the same calibrated P10–P90 approach to any place and panel setup: drop a pin, describe your panels, and get a low, expected and high range for today and the next three days, the best solar window, and a conservative plan at the margin you choose. It is free, needs no account, installs on a phone, and runs its model on your device.
The grid model is where the headline comes from. Penumbra publishes its national forecast every day next to Elia's and scores both the next morning in a public, hash-chained ledger. On 359 held-out test days (November 2025 to October 2026, day-ahead) it cut pinball loss by 10.8% against Elia's own probabilistic forecast, with a band almost a third narrower (9.1% vs 13.3% of capacity) while still covering 80% of outcomes.
Problem
Elia publishes its day-ahead solar forecast with a P10–P90 range at 11:00 the day before, and the market plans around it. A single number is not enough to plan on, and a range that is wider than it needs to be makes solar harder to schedule. Accuracy claims are also easier to trust when they can be checked: Penumbra publishes its forecast next to Elia's every day and scores both the next morning.
Solution
Penumbra does not re-forecast the weather. It learns where the official forecast goes wrong. A LightGBM model learns the P10, P50 and P90 of the gap to Elia's median, using four weather models, fresh GFS, solar geometry, D-1 morning output and recent Elia error. A rolling conformal step then corrects the band using the last 60 days. A second model uses weather alone, needs no local history, and runs in the visitor's browser for any place.
Tech stack
Python, pandas, LightGBM, rolling conformal quantile calibration. A static site in plain JavaScript with uPlot, and LightGBM trees exported to JSON for browser inference. A scheduled daily job maintains the ledger.
Implementation and demo
- Live site: https://yy5652-hash.github.io/penumbra/
- Presentation: https://yy5652-hash.github.io/penumbra/deck.html · PowerPoint download
- Code: https://github.com/yy5652-hash/penumbra
- Forecast tool: pick a place on a map, by search or GPS; up to three roof arrays with capacity, tilt, direction and an optional inverter limit, using forecast irradiance on each tilted plane; Today to In 3 days; low, expected and high (P10/P50/P90) energy and a 15-minute chart; the best solar window for the selected day, with an optional check of how much of a planned load the low case covers; a margin slider that turns the band into a conservative plan; saved sites, share links, CSV and JSON export; installable on a phone, with the last forecast available offline.
- Check the headline in seconds: the
evidence/folder in the repository holds every scored test quarter-hour for Penumbra and Elia, andpython src/verify_headline.pyrecomputes the results table and confidence intervals without retraining. - Public ledger: one forecast per day, each carrying the hash of the one before, checked in the browser. Live forecasts begin with 4 November 2026.
- Parity tests confirm that the browser matches Python to 0.0001 on real weather responses.
Results and validation
Inputs include four weather models from runs at least 48 hours old, fresh GFS 00z of D-1 from the NOAA archive, and D-1 morning measured output before the 11:00 cutoff. Training history starts in 2021. Other output lags stop at D-2. Choices were made on May to October 2025. Scores cover 359 test days, November 2025 to October 2026. The test window was used twice: first by v1, then by v2, which was chosen on validation and frozen in 6e8d5b8 before its single run. The first frozen version was v1 (2d11d22).
| Method | Scope | Pinball | MAE | 80% coverage | Band width |
|---|---|---|---|---|---|
| Elia day-ahead 11:00 | Belgium | 0.0101 | 2.98% | 81.9% | 13.3% |
| Penumbra v2 | Belgium | 0.0090 (-10.8%) | 2.79% | 80.2% | 9.1% |
| Elia day-ahead 11:00 | 11 provinces | 0.0117 | 3.54% | 75.4% | 13.2% |
| Penumbra v2 | 11 provinces | 0.0105 (-10.0%) | 3.28% | 80.2% | 10.5% |
Paired daily pinball difference: Belgium -0.00106 [-0.00134, -0.00077]; provinces -0.00112 -0.00135, -0.00090. Quartz, the strongest open-source baseline we found, scored 11.9% MAE on the same provinces with the same-age weather. In three British regions the Belgium-trained weather model reached 4.14% MAE against 11.1% for Quartz, with 75.4% band coverage and no local calibration.
Impact
The average Belgian band falls from 1,561 MW to 1,073 MW. Mean P10 rises from 1,851 MW to 2,054 MW. Output met P10 in 89.9% of intervals for Penumbra, against 90.4% for Elia. Provincial band width falls from 13.2% to 10.5%, while coverage rises from 75.4% to 80.2%.
Team contributions
Yi Yu: problem framing, data, modelling, validation, product and presentation. AI coding assistants helped write and check code.
Third-party acknowledgements
Elia Open Data; NOAA GFS archive; Open-Meteo.com (CC BY 4.0); Sheffield Solar PV_Live; Energy-Charts; Quartz Solar Forecast (MIT), used only as a baseline; uPlot (MIT); Leaflet (BSD-2-Clause) with OpenStreetMap data (ODbL); rany2/open-meteo-solar-forecast (MIT), whose multi-array approach was adapted; Matplotlib; PptxGenJS; Playwright.
Built With
- github
- javascript
- lightgbm
- open-meteo
- pandas
- python
- uplot
