Inspiration
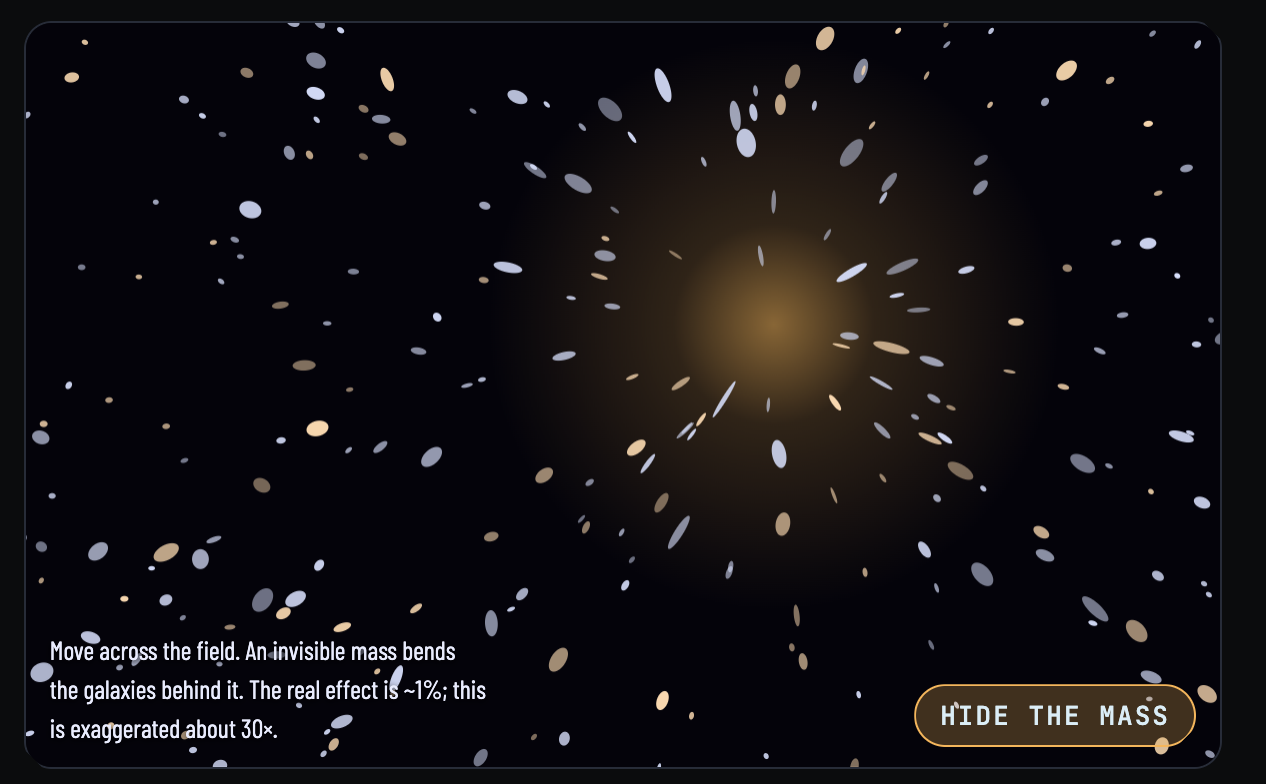
About 85% of the matter in the universe is dark matter. We can't see it, but it has mass, and mass bends light. When light from a distant galaxy passes a clump of dark matter, its shape is distorted very slightly. This is weak gravitational lensing.
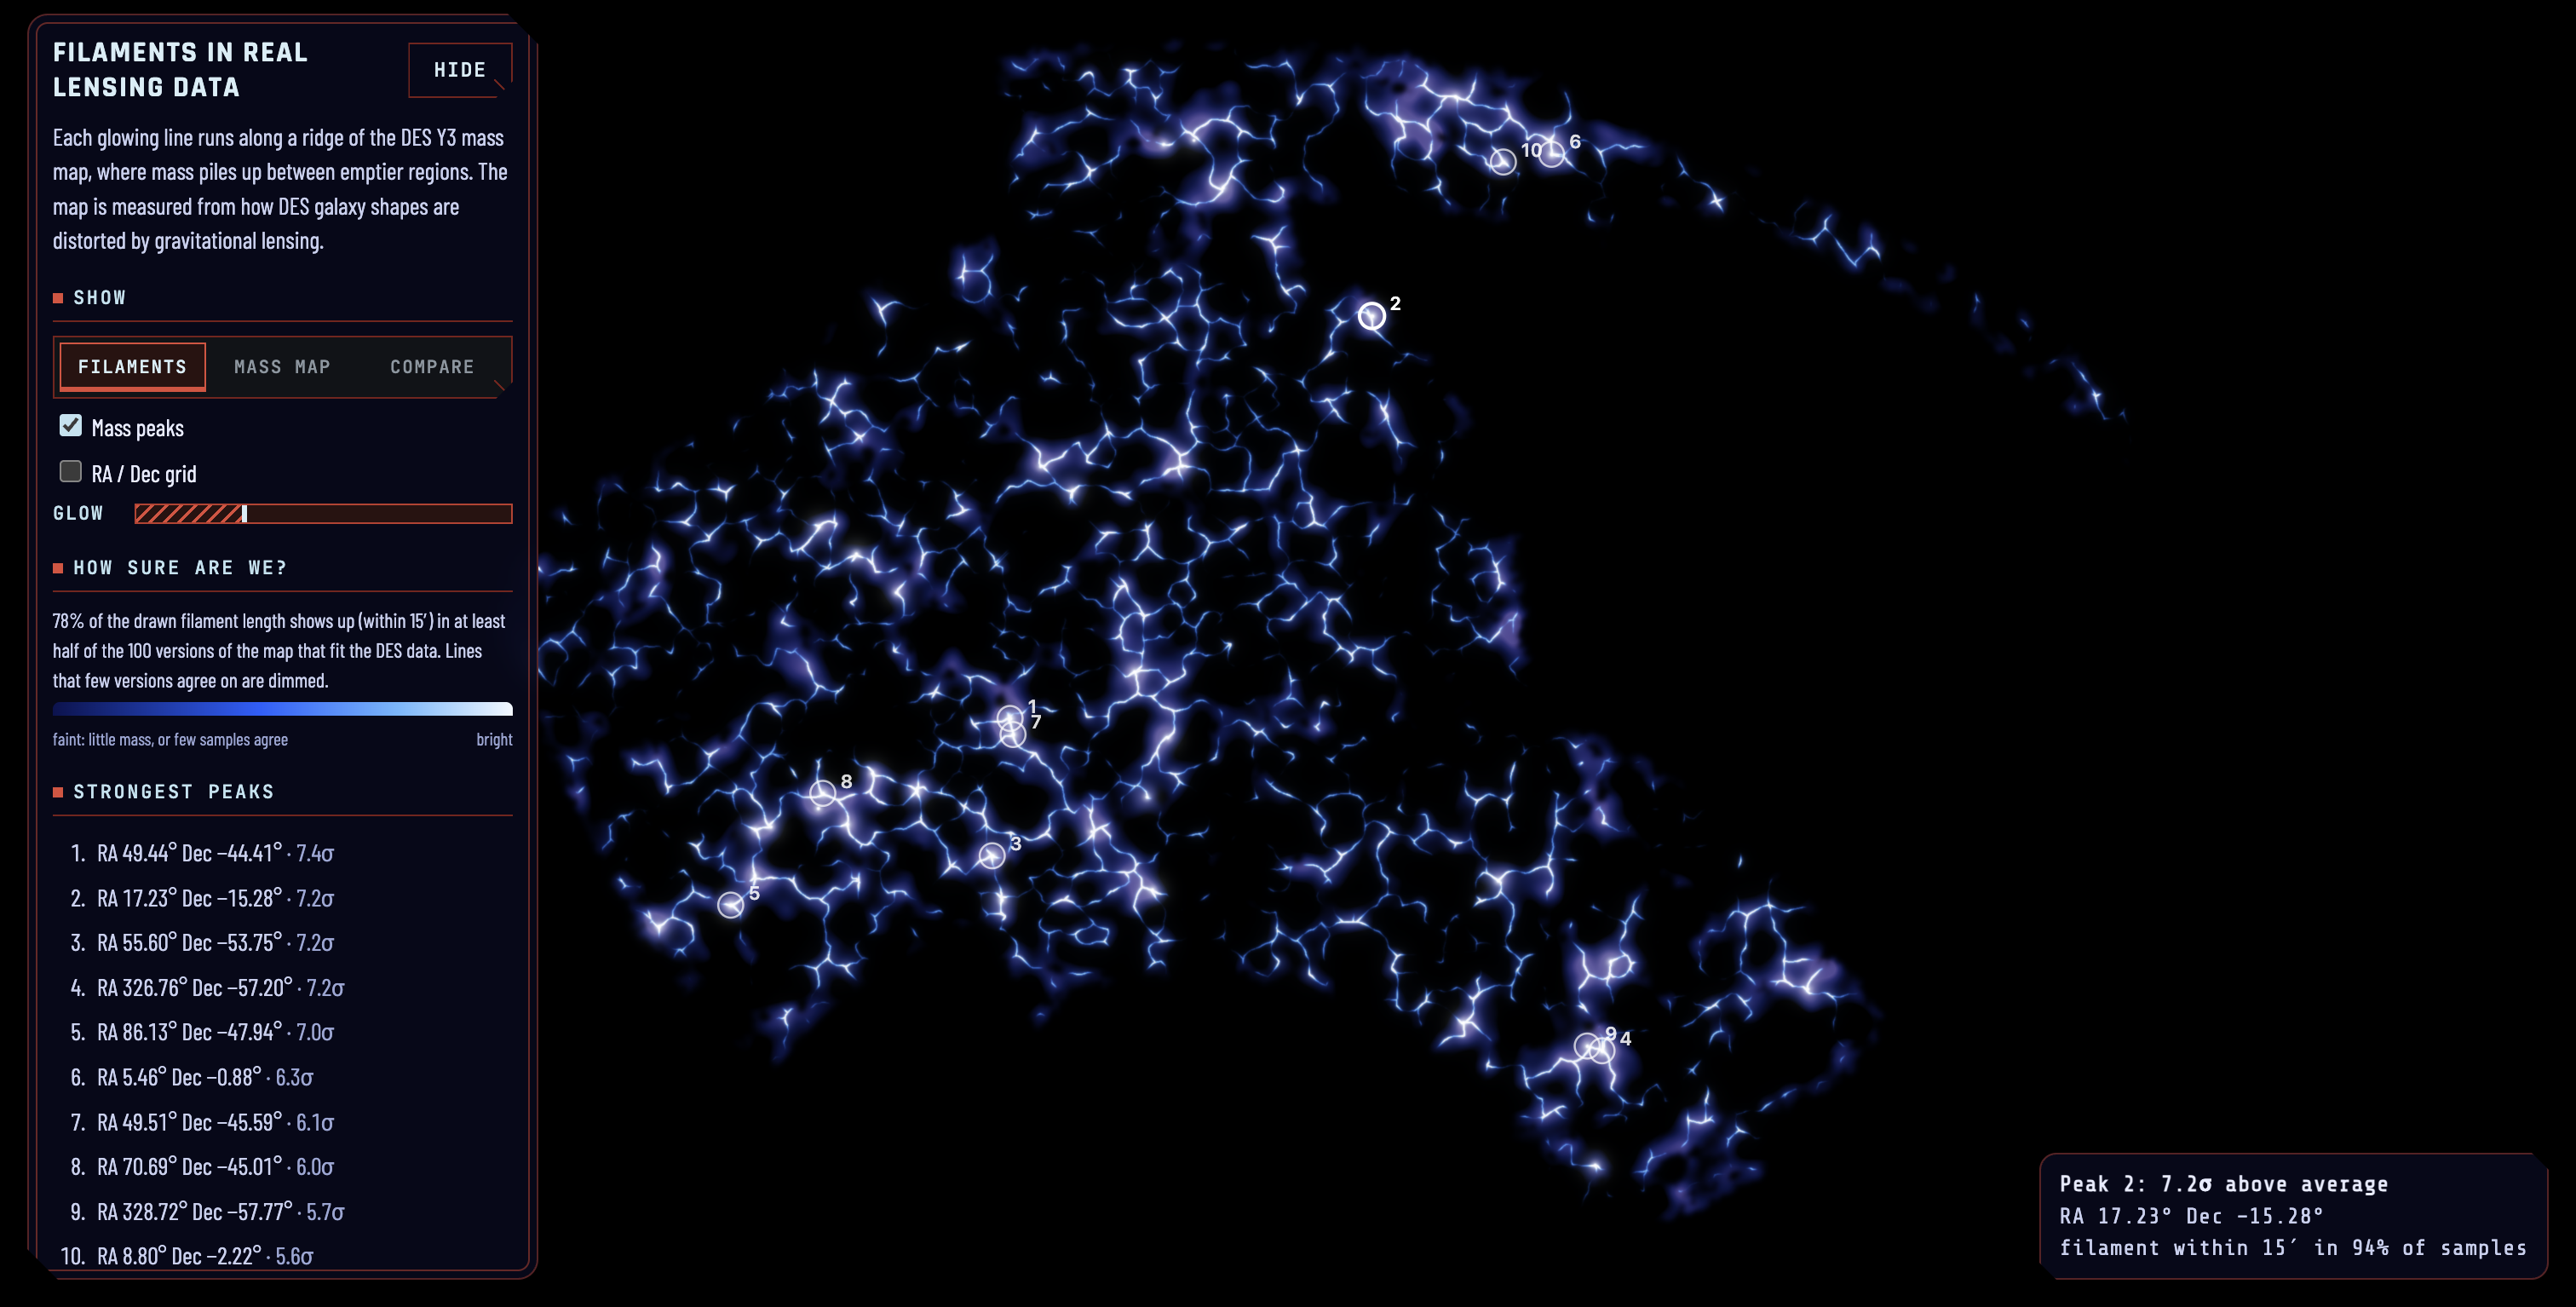
For almost six years the Dark Energy Survey (DES), run from CTIO in the Chilean Andes, measured the shapes of hundreds of millions of galaxies across about an eighth of the sky. Averaged over many galaxies, those tiny distortions become a map of where the mass is. That map is public, but almost nobody outside cosmology ever looks at it.
Dark matter also matters to our own existence. In modern cosmology it plants the seeds of the cosmic web, a scaffold of halos joined by faint filaments. Galaxies form in those halos, galaxies make stars, and stars make solar systems and life.
Big ideas like dark matter can feel impressive or intimidating, depending on how they're presented. We wanted to remove the intimidation. So we asked: what if the universe felt like it was in the palm of your hand, instead of light-years away? That became our design philosophy for citizen science: anyone with a browser should be able to explore real data, play with the physics, and understand what they're looking at, with no astronomy background.
What it does
Penumbra lets you explore real dark matter maps and the physics behind them in your browser.
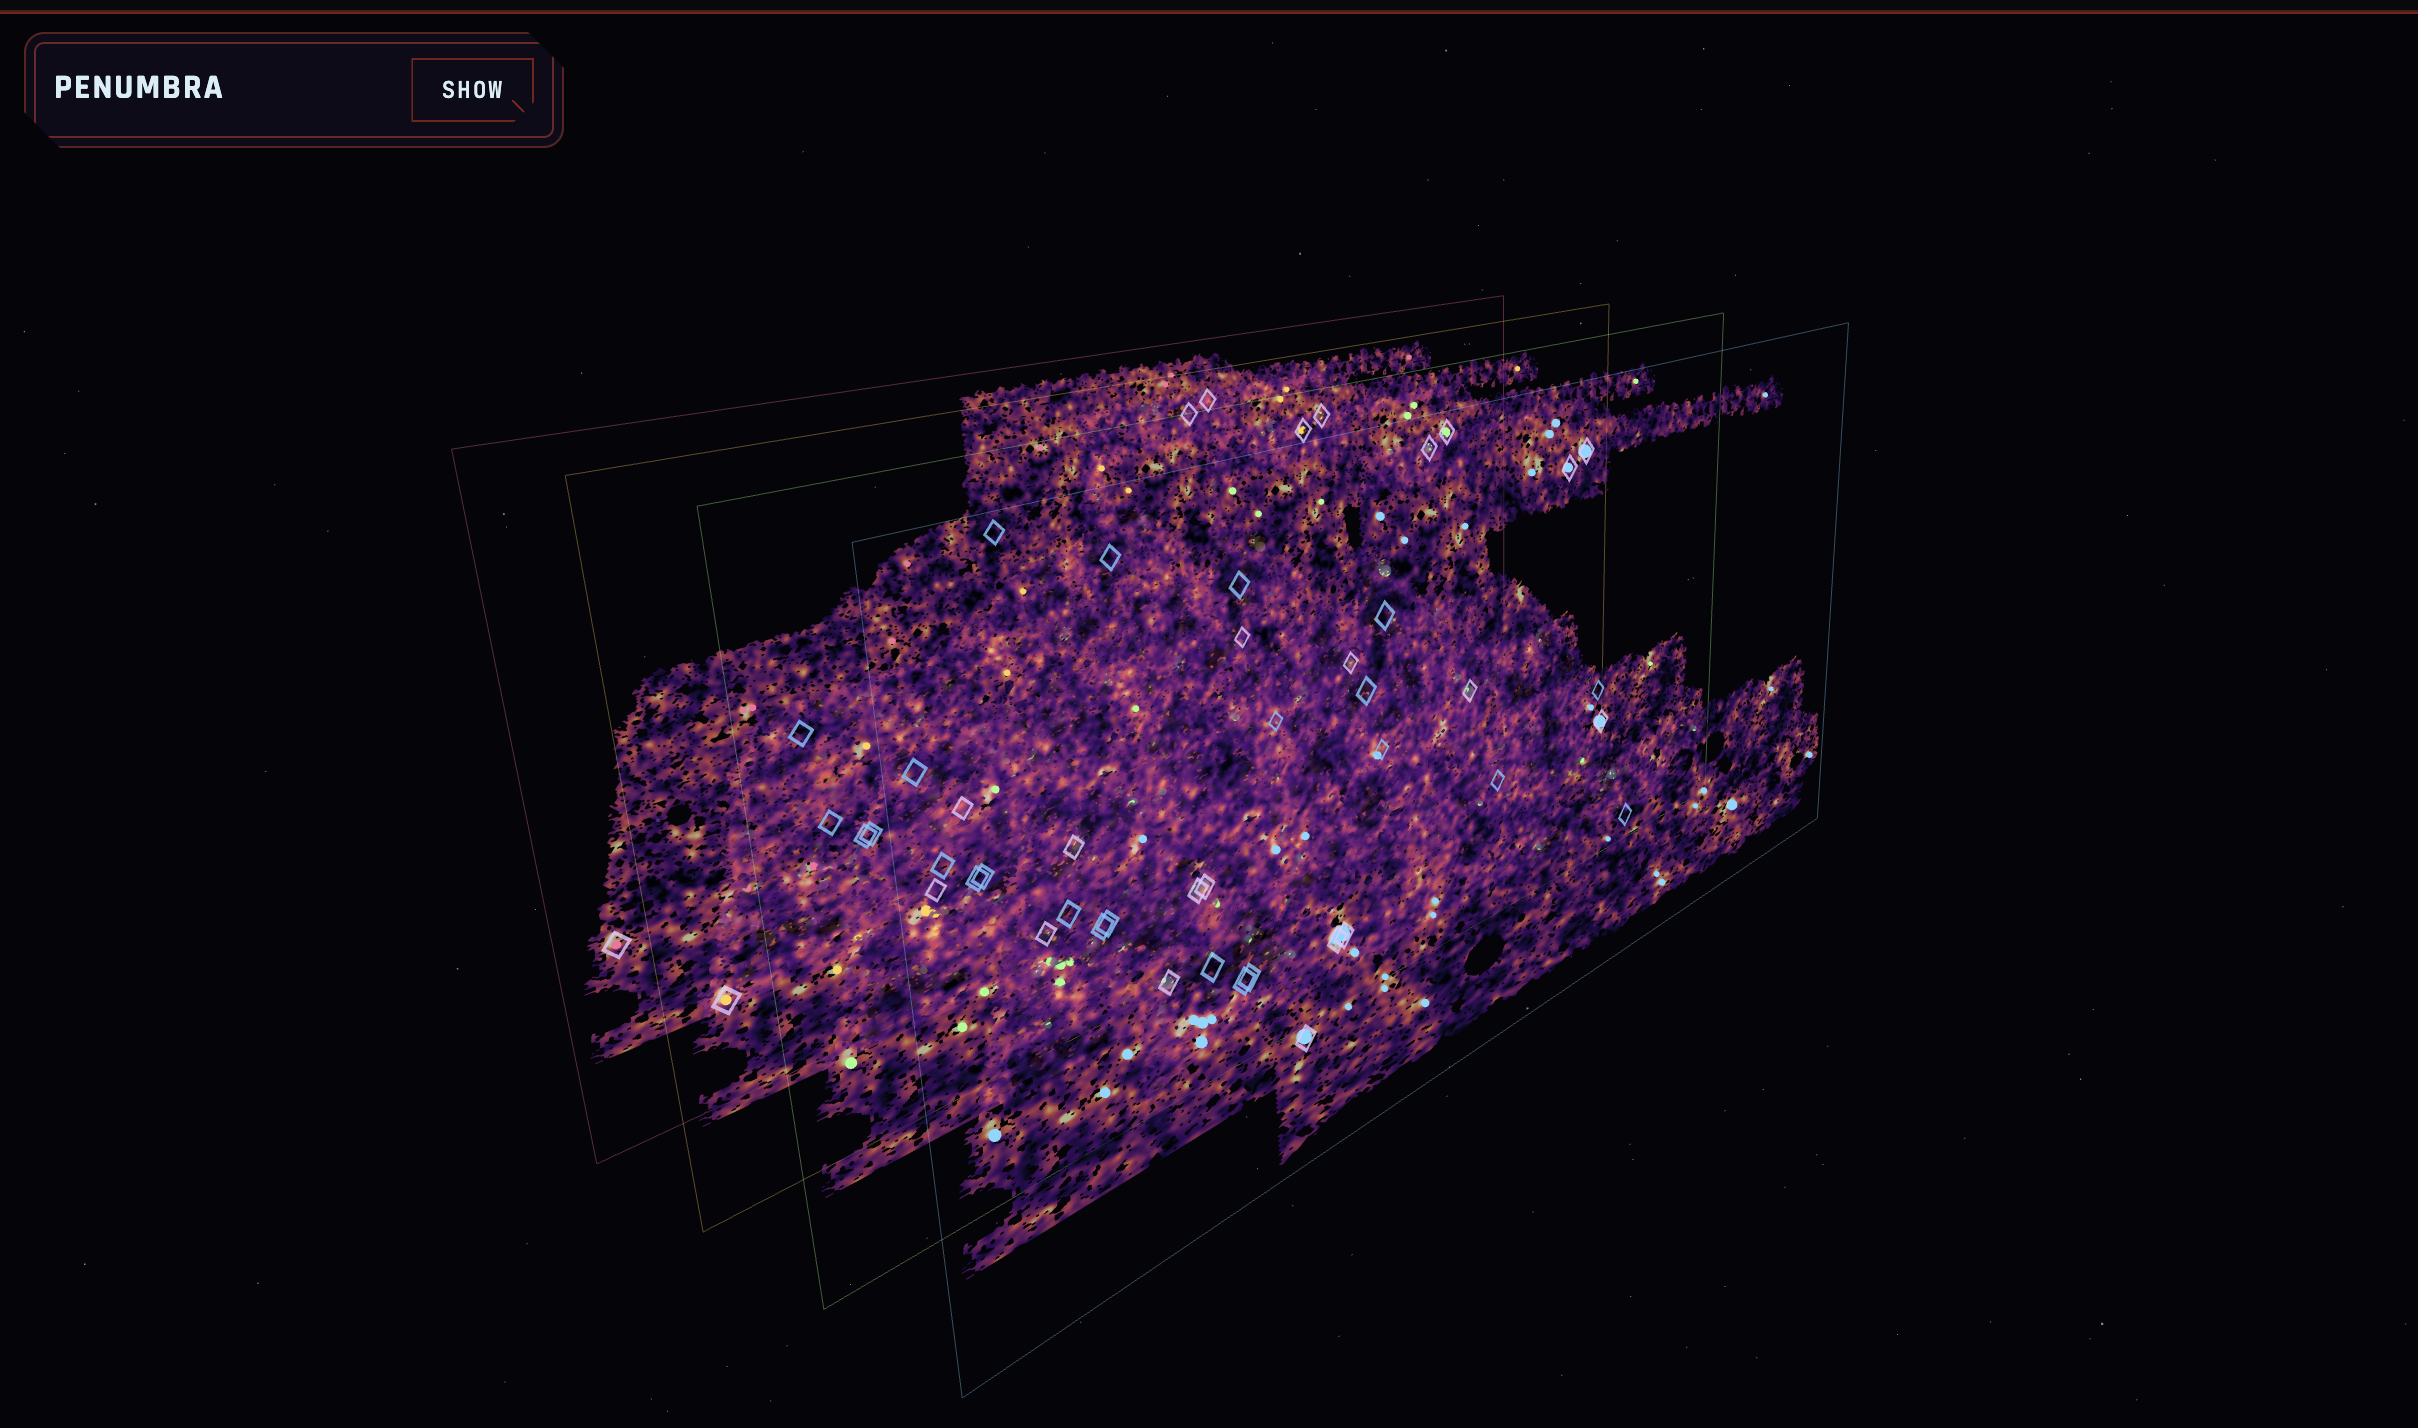
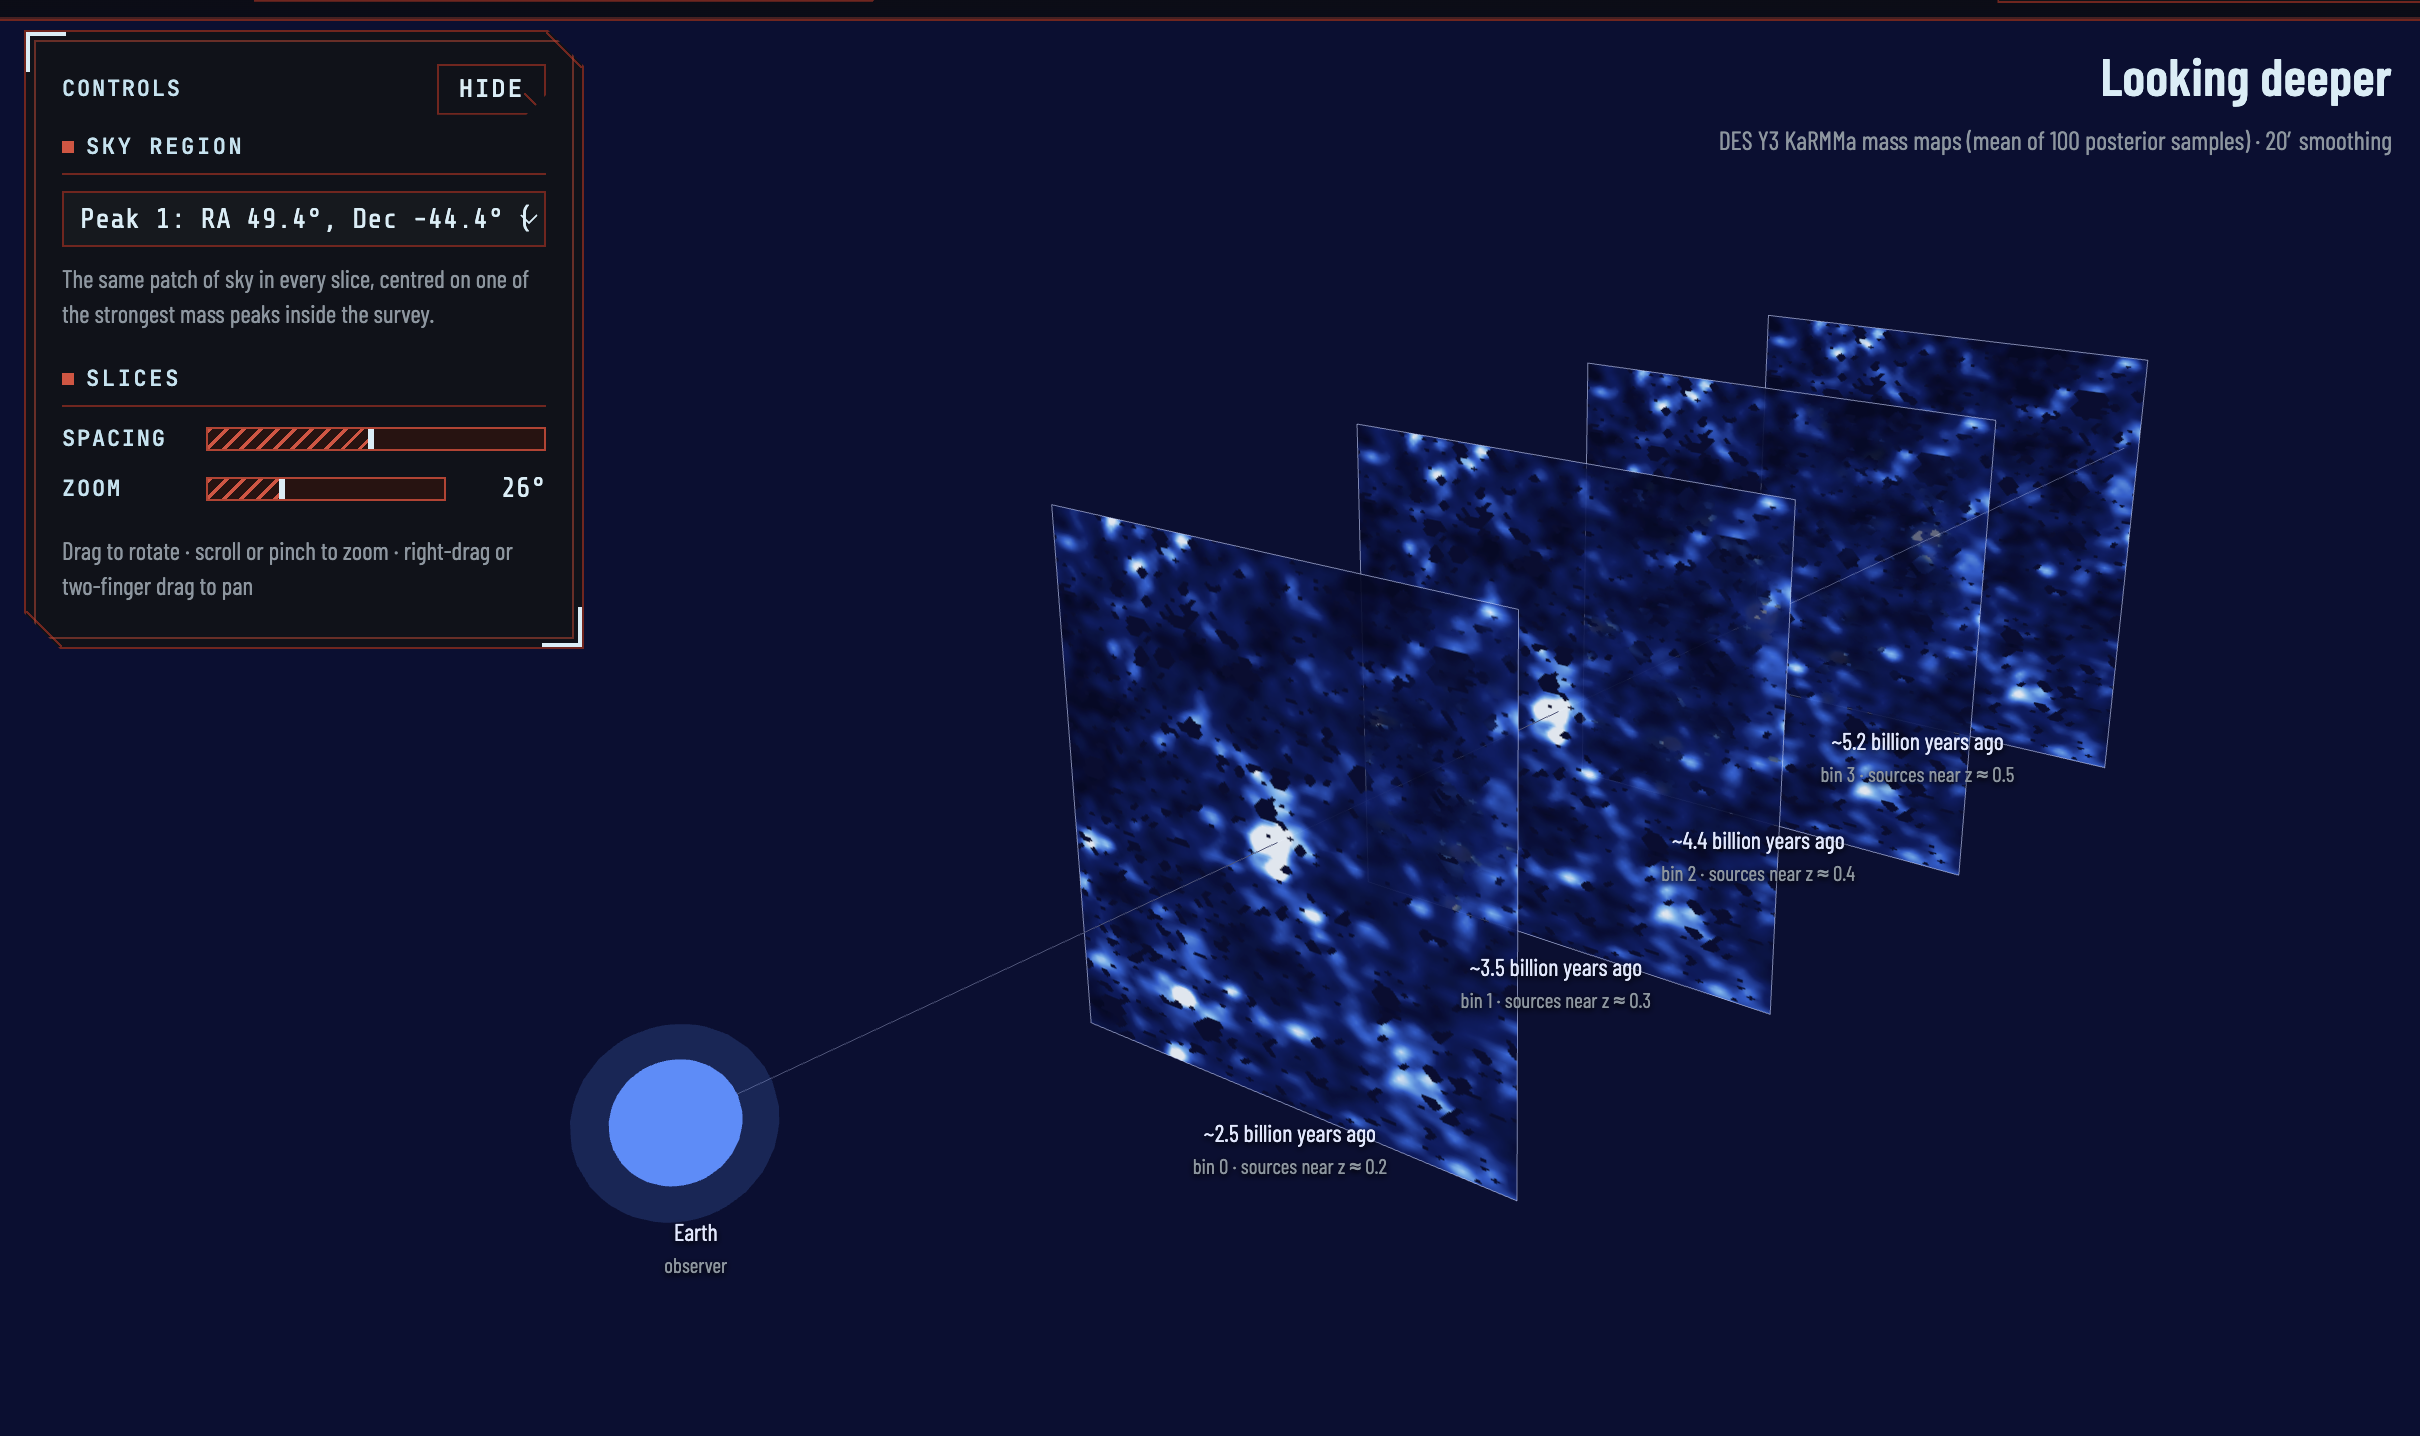
- Real DES Y3 mass maps. Four tomographic bins, shown as sky layers and as line-of-sight slices. Each bin looks progressively deeper.
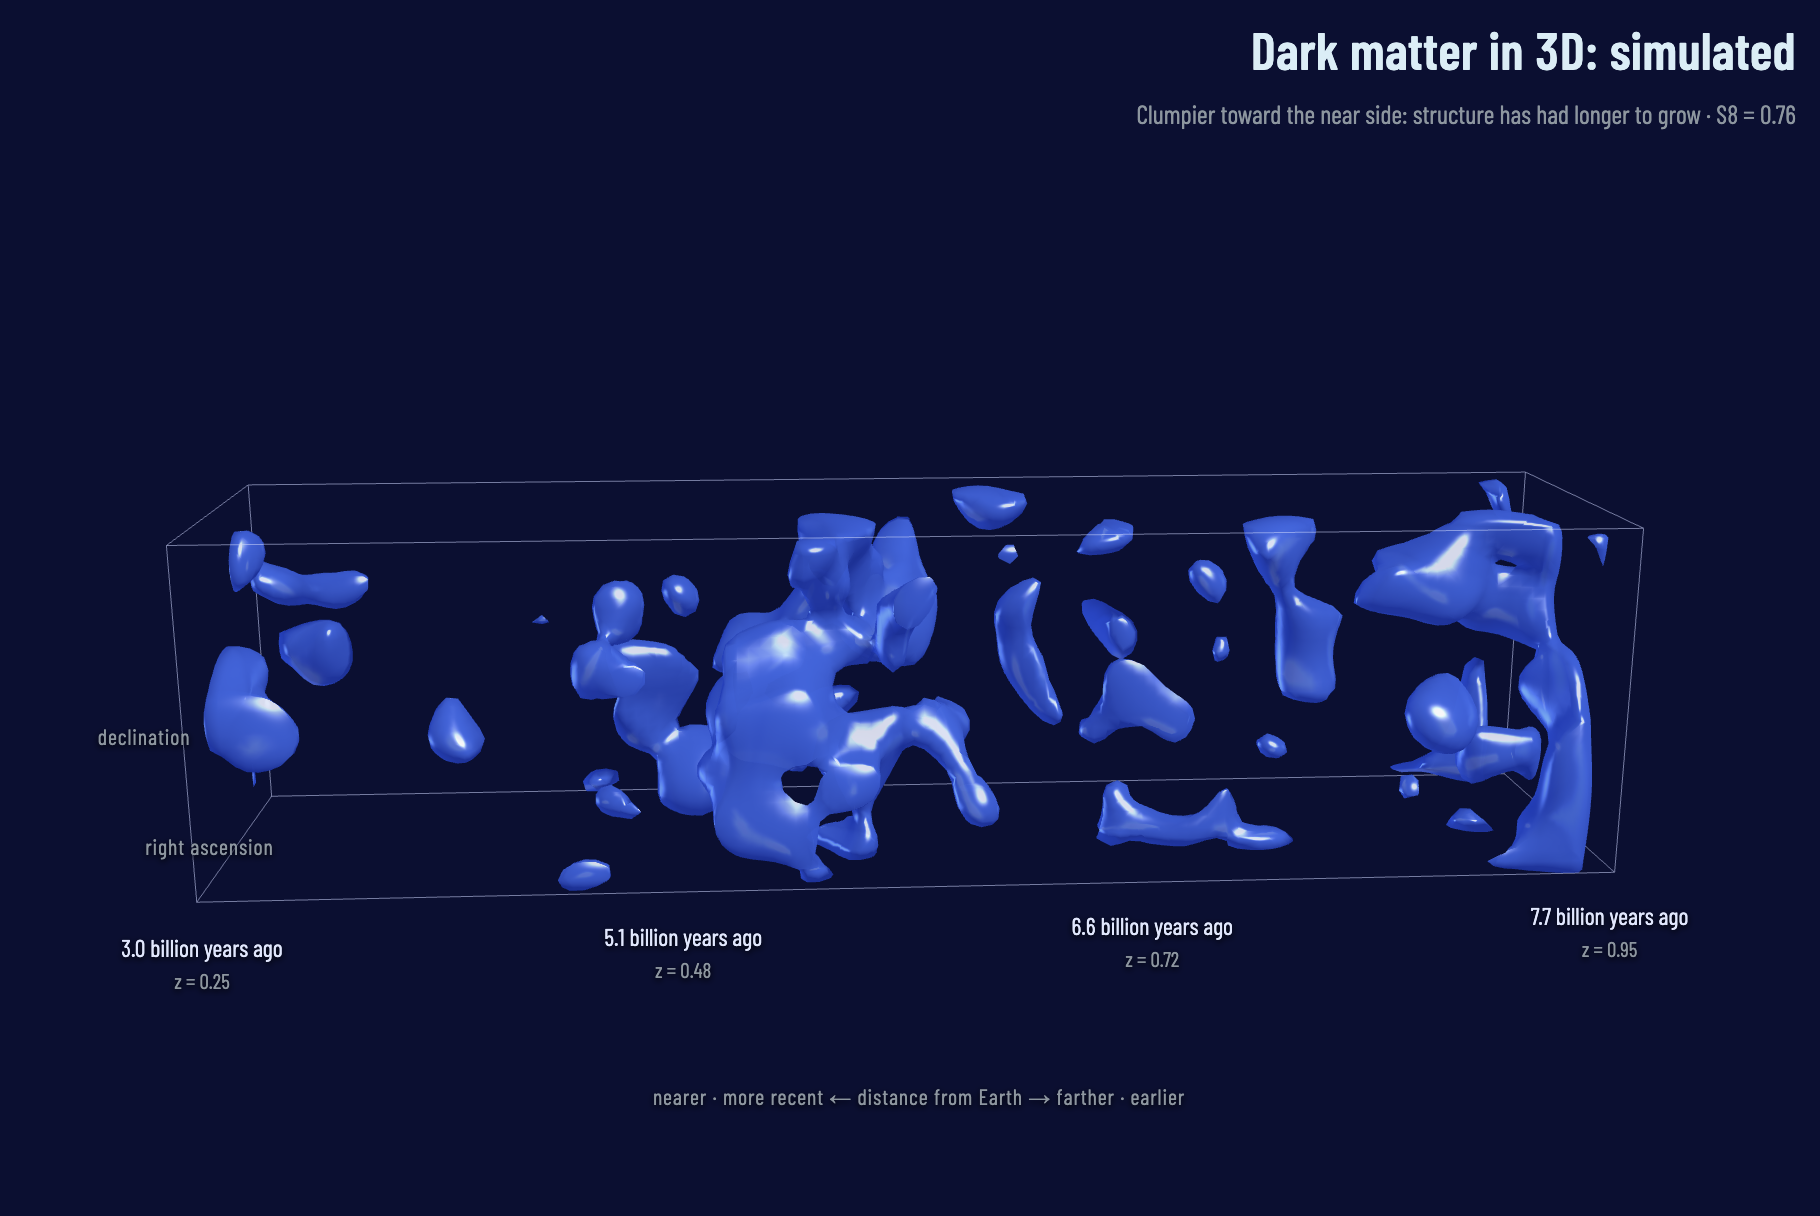
- Our rebuild of the COSMOS 3D map. We rebuilt the 3D dark matter map of the Hubble COSMOS field (Massey et al. 2007) from the public Leauthaud et al. 2007 shear catalog of 261,123 galaxies. Our strongest peak sits at RA 149.93°, Dec 2.51°, z ≈ 0.7, which matches the known z ≈ 0.73 cluster.
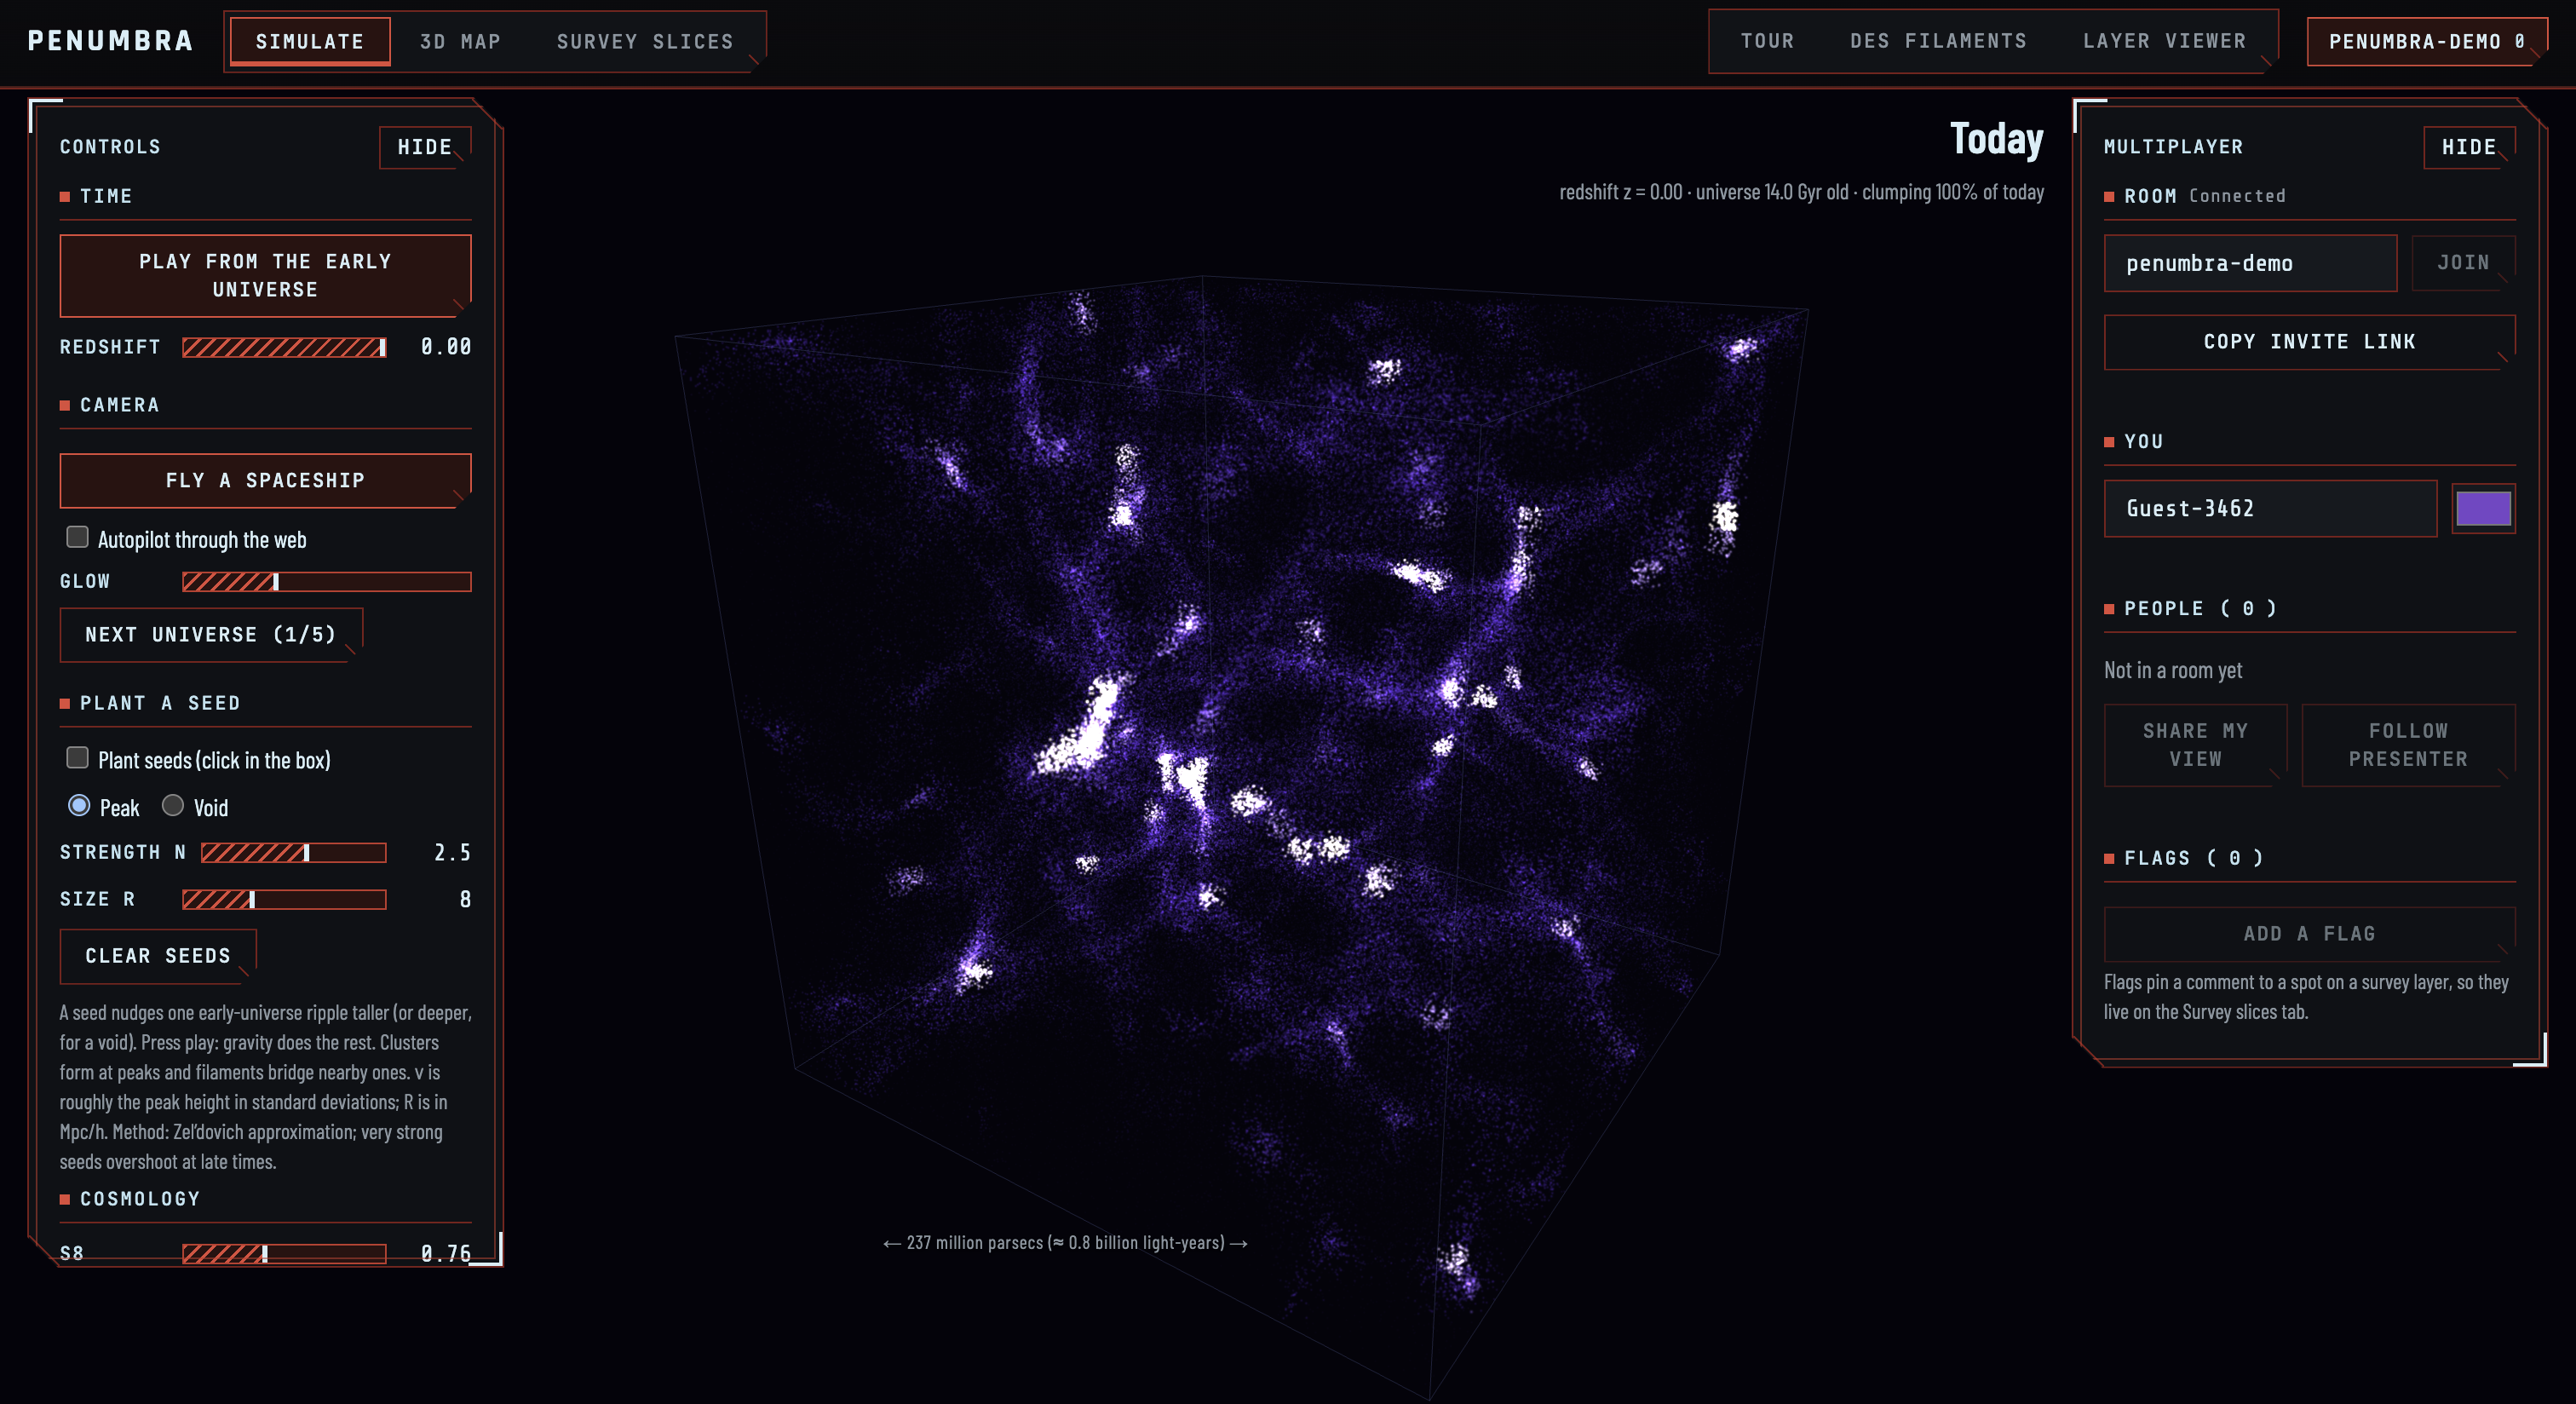
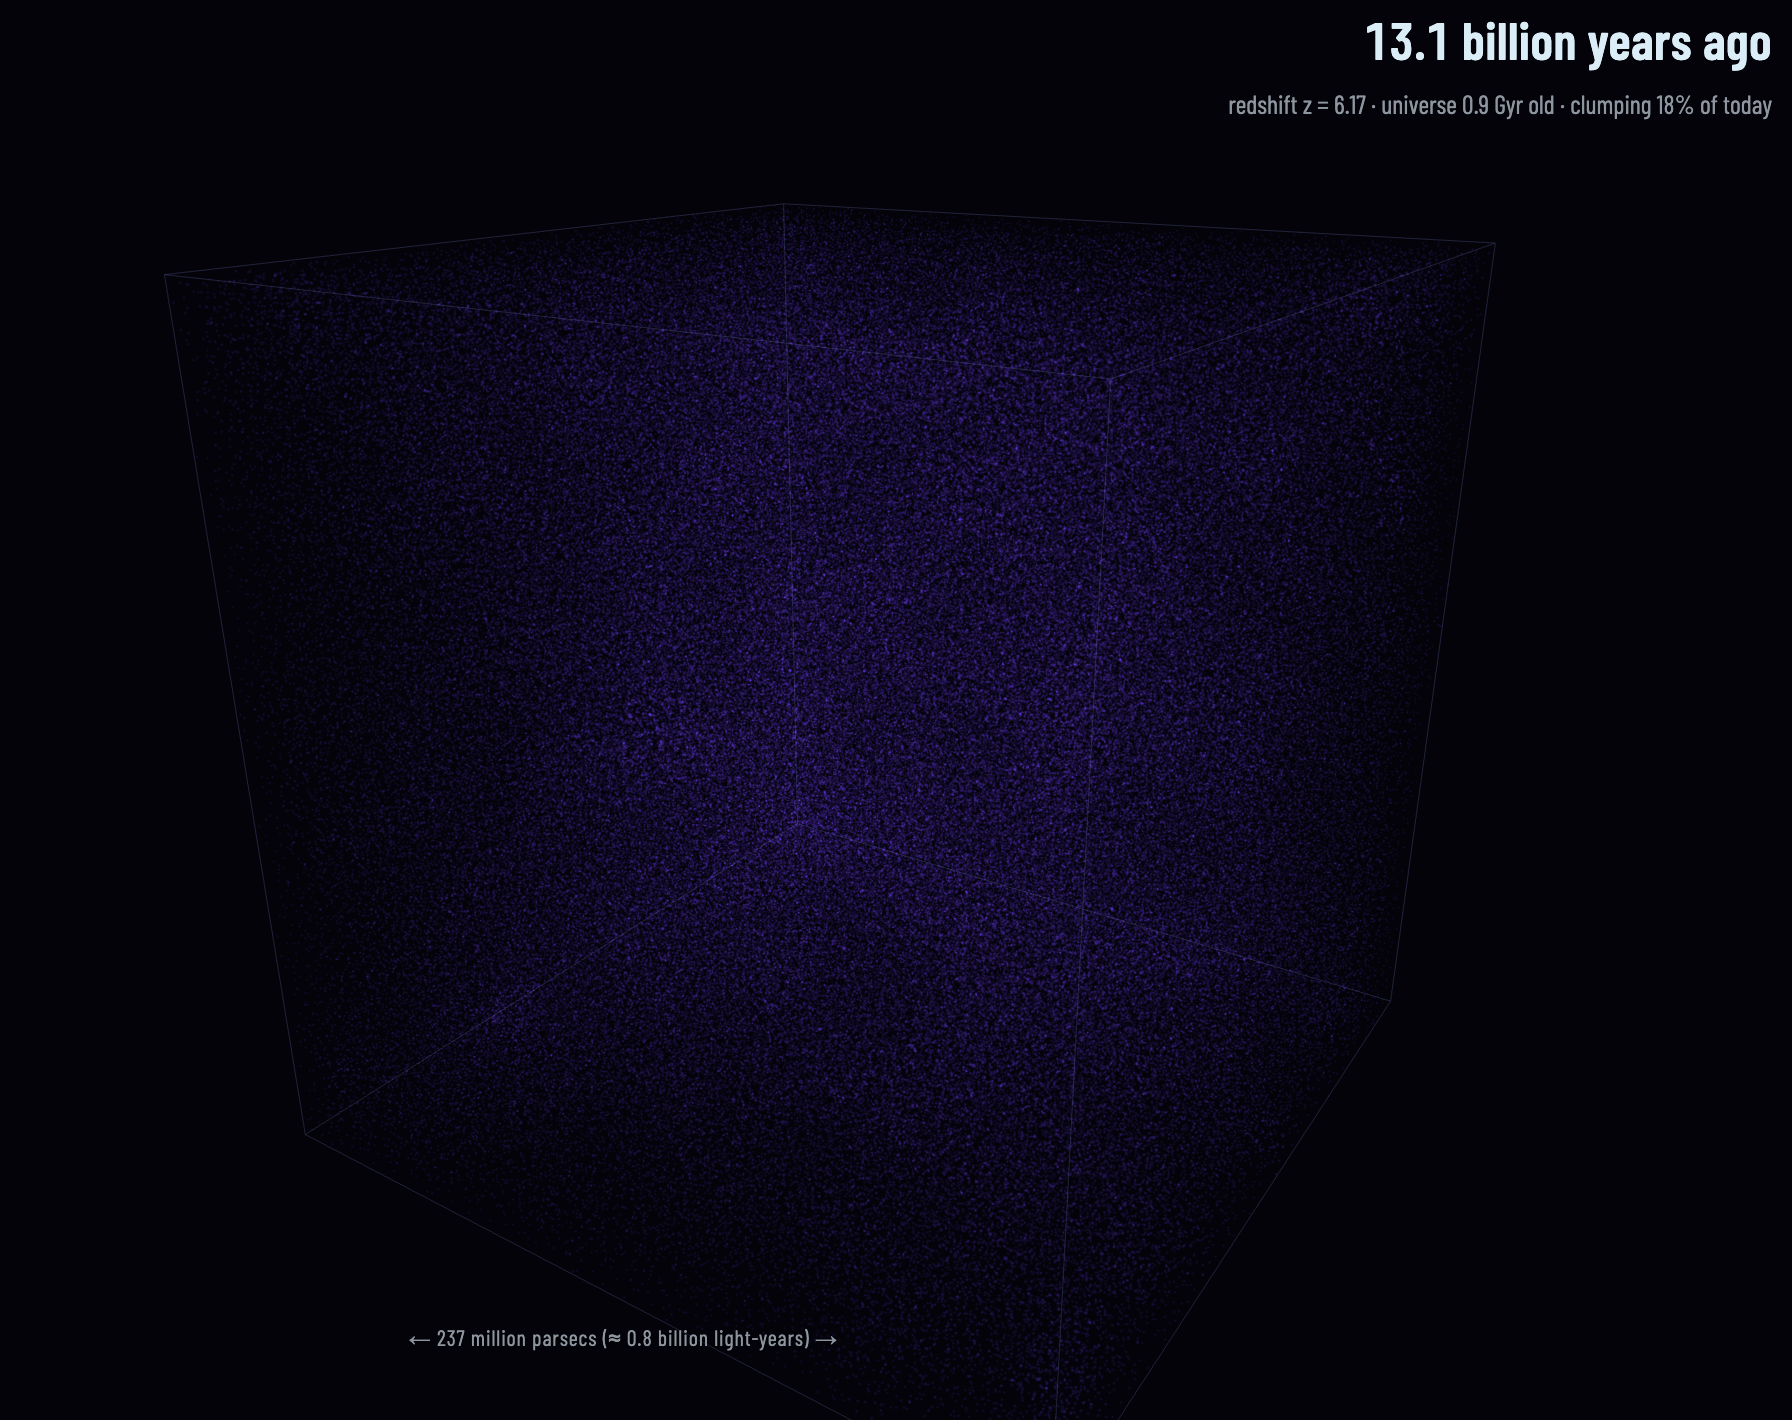
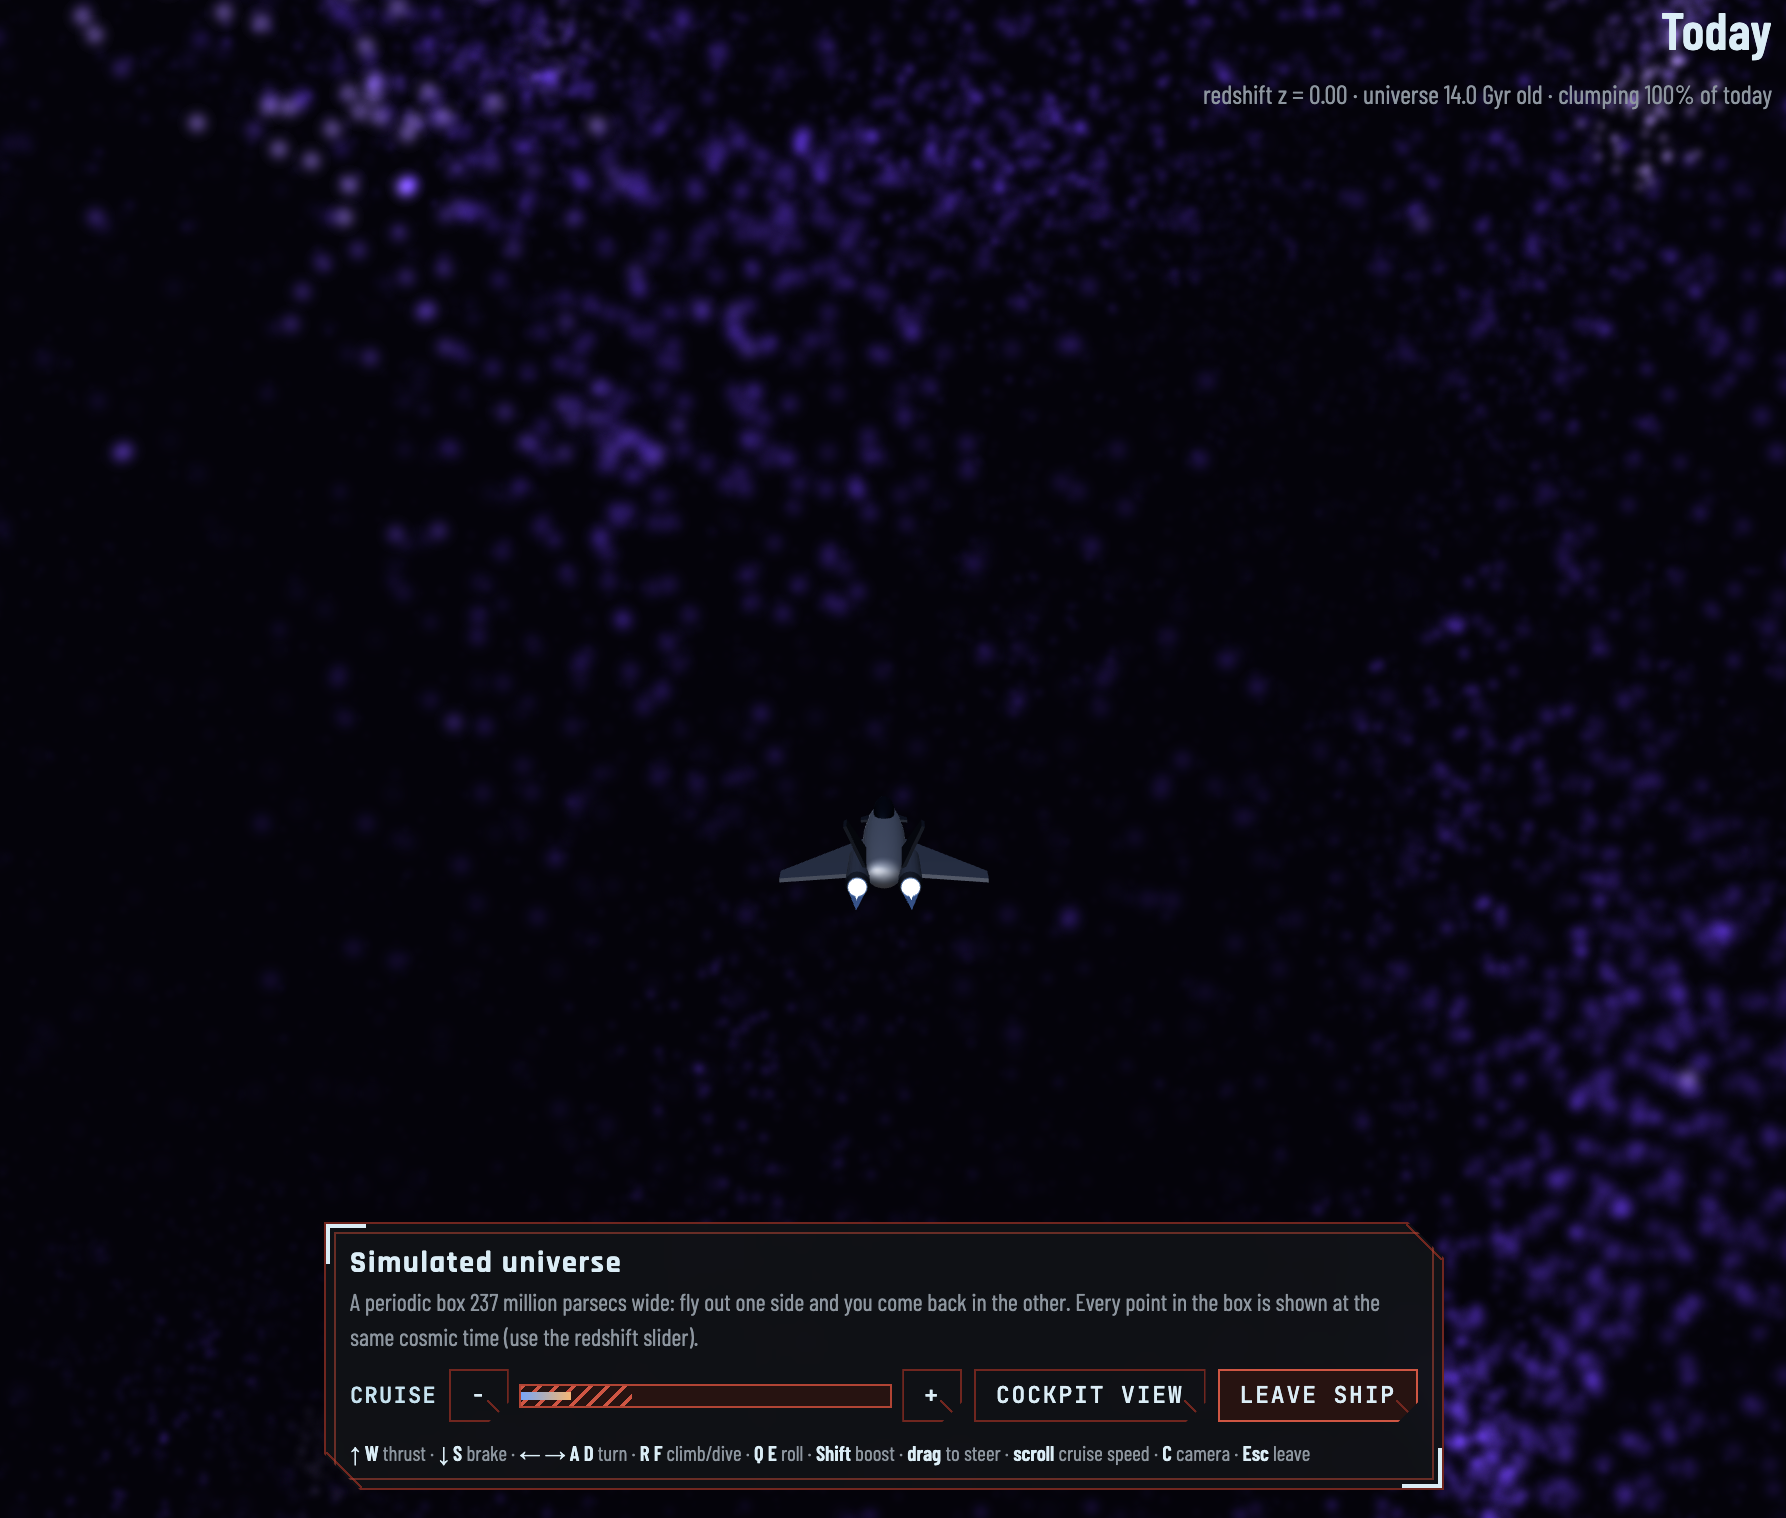
- A live fake universe. A real-time Zel'dovich simulation runs in the browser. You can plant dark matter seeds at the start of time, change $\Omega_m$ and $S_8$, press play, and watch halos and filaments form and merge.
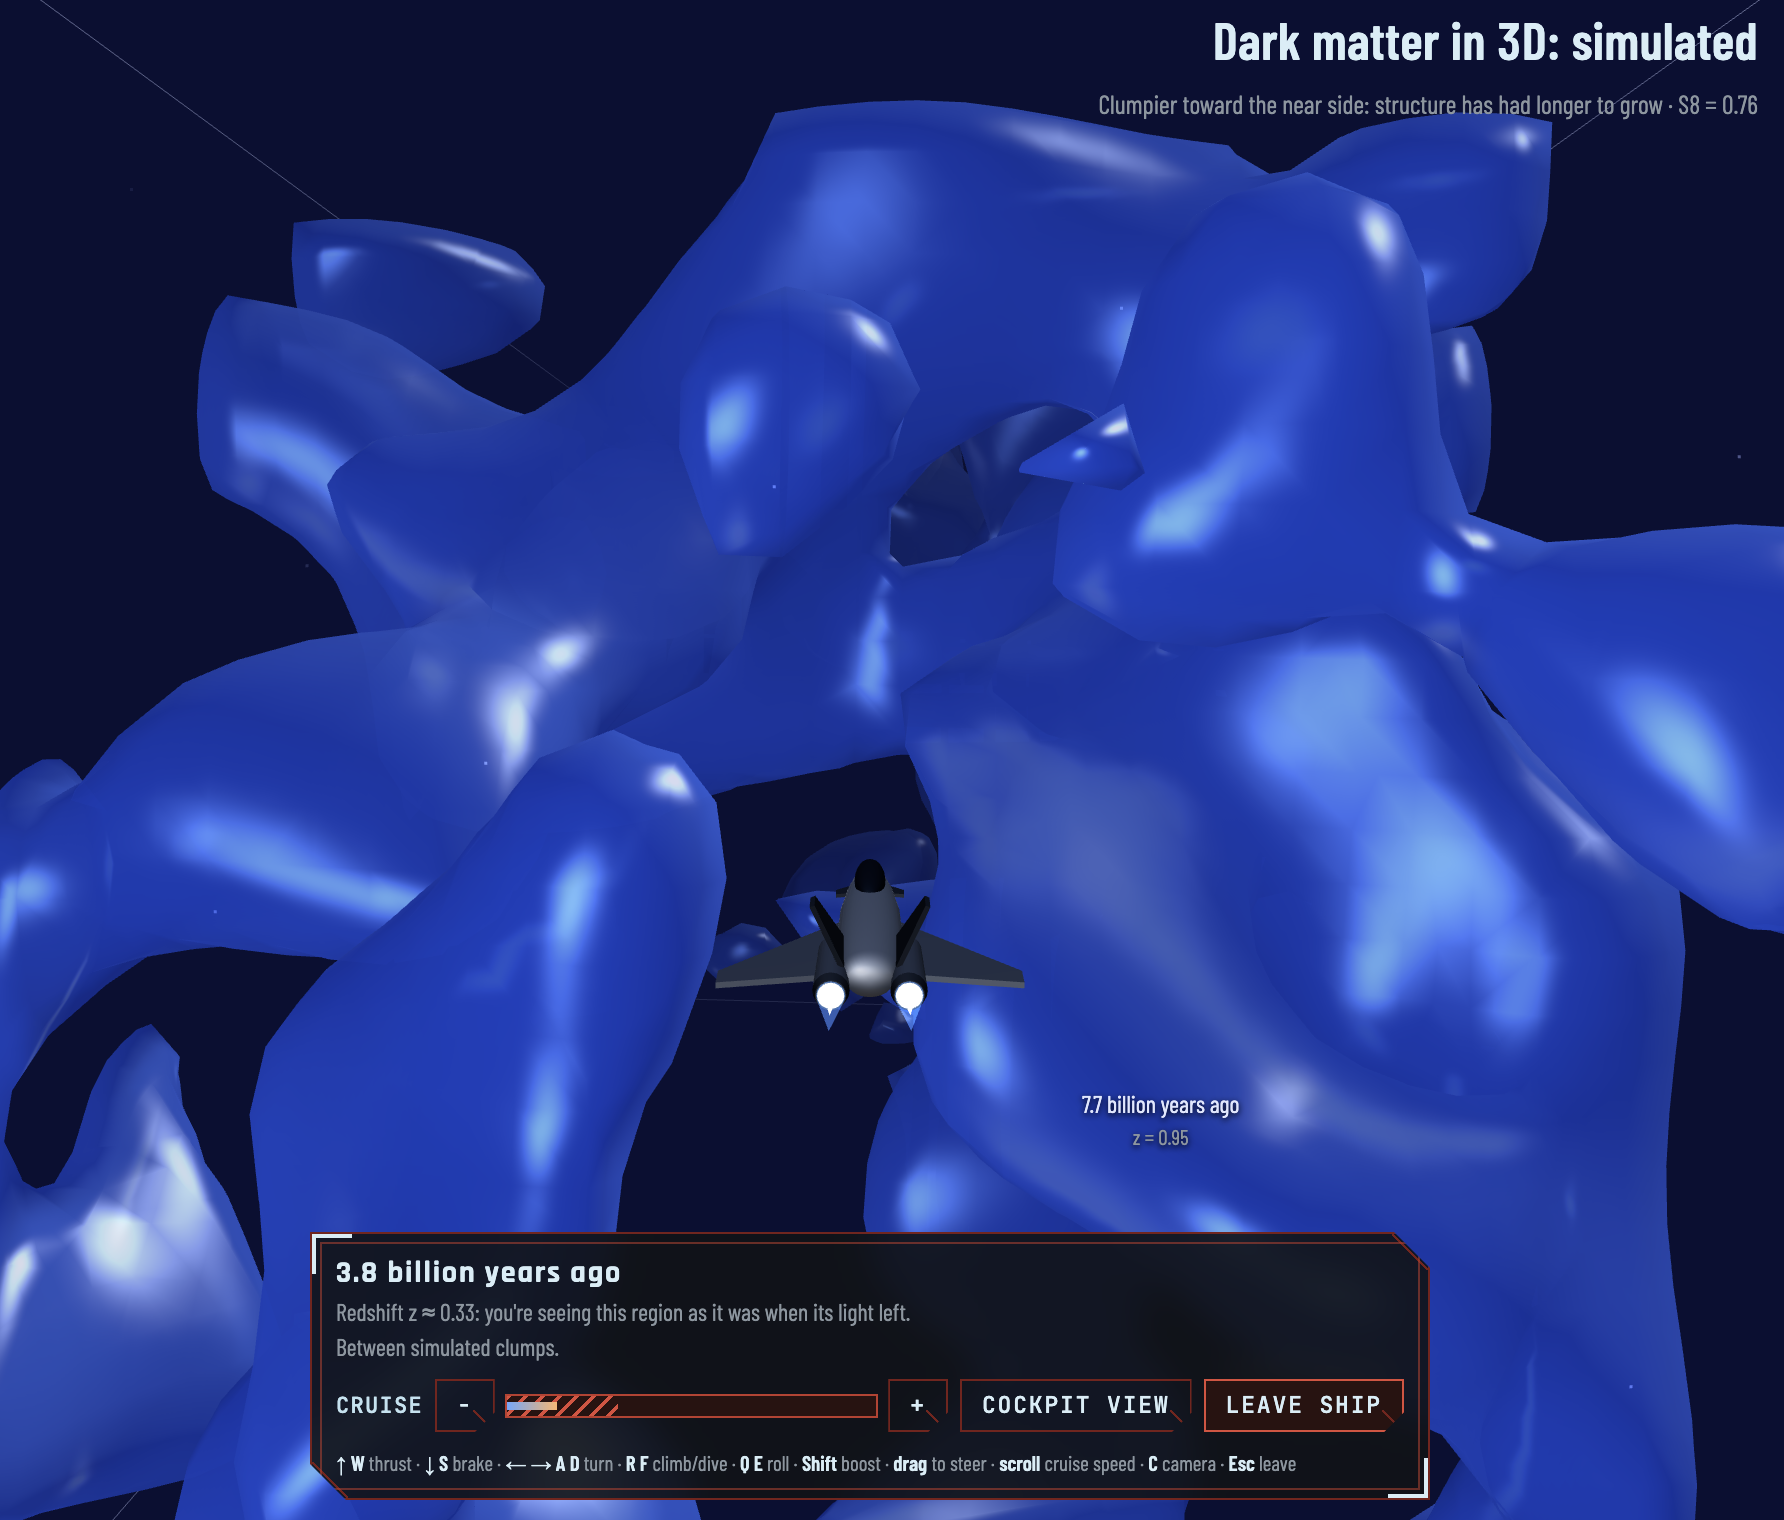
- A spaceship you can drive. Fly a small ship through the simulated universe as structure forms, or through our COSMOS map. Choose a chase or cockpit view, steer with the keyboard, mouse or touch, and see a live readout of where you are, such as the redshift.
- Gravitational lensing under your cursor. The front of the Tour shows a field of background galaxies that stretch and arc around a hidden mass. You can make the mass follow your pointer and reveal it, so you see how lensing works before reading a word of explanation. (The effect is exaggerated about 30× so it's visible, and the page says so.)
- A guided Tour. Seven short stops explain the science in plain language: seeing by bending, the map, reading the universe's recipe, the clumpiness puzzle, citizen science, and what's next. A status board shows where the project and the field stand.
- An AI explainer for the map. Claude gets rendered images of the DES map plus measured extrema, and writes a plain-language description of the map's shape. Every statement links to a pin on the map. Click a sentence and the viewer flies to the spot it describes. Statements are labelled Measured, Visual impression or Quality note, and a Limitations section is always shown. The text is an AI description, never a measurement, and it never feeds the cosmology numbers.
- Simulation-based inference (SBI). An offline pipeline reads $\Omega_m$ and $S_8$ off a map and compares the result with Planck.
- Shared rooms. With SpacetimeDB, multiple people can share a room, follow a presenter, and drop flags anchored to places on the sky. A teacher can lead a class through the map, and students can follow along or explore on their own.
Citizen science and accessibility
Making the science open was a goal from the start, not a feature added at the end.
- No installs, no accounts. Everything runs in the browser, and the heavy science is done offline. The site only streams compact precomputed data, so it works on an ordinary laptop.
- Plain language everywhere. Instead of a wall of jargon, each control has a short hint that says what it does and what the number means. For example, S8 is "how clumpy matter is today," and Ωm is "the fraction of the universe's energy in matter." The Tour uses everyday analogies. A mass map that adds up all the mass along one line of sight is described as "like a shadow puppet."
- Play before you read. The lensing field, the seed-planting simulation and the spaceship let people build intuition by experimenting first, with the explanation next to it.
- An AI explainer that is honest about itself. It cites its evidence, flags uncertainty, can decline to describe a map, and shows a "toy data" badge when the stored result doesn't match the displayed map. Those labels are meant to help people trust the tool and to model good scientific habits.
- Flexible controls. The spaceship works with keyboard, mouse drag, scroll or pinch, and touch. The 3D views support rotate, zoom and pan with mouse or touch gestures. The spaceship's controls carry text labels (
aria-label) and the flight readout is also shown as text, not only graphics. - Respecting preferences. The lensing demo honors the system's reduced motion setting.
- A real citizen-science cross-check. The Tour describes how Galaxy Zoo volunteer-trained classifications can be compared with the mass map to ask whether merging galaxies cluster where the mass is densest. A null result would still be a real result.
How we built it
Mapping mass from light. A lensing map shows the convergence $\kappa$, a weighted projection of the matter overdensity $\delta$ along the line of sight:
$$ \kappa(\hat{\theta}) = \frac{3 H_0^2 \Omega_m}{2c^2}\int_0^{\chi_s} \frac{\chi\,(\chi_s-\chi)}{\chi_s}\,\frac{\delta(\chi\hat{\theta},\chi)}{a(\chi)}\,d\chi . $$
DES splits its source galaxies into four redshift bins. Each bin is the mass projected toward sources at that depth. The bins overlap, so they are not slices of space. That is why the UI says "looking deeper" and not "3D map". Only COSMOS has real, though coarse, depth information.
Simulating dark matter with fluid mechanics. The Simulate tab treats cold dark matter as a pressureless fluid. It uses the Zel'dovich approximation, which moves each particle from its starting position $\mathbf{q}$ along a displacement field:
$$ \mathbf{x}(\mathbf{q}, t) = \mathbf{q} + D(t)\,\boldsymbol{\Psi}(\mathbf{q}), \qquad \nabla\cdot\boldsymbol{\Psi} = -\delta_{\rm lin}/D . $$
Here $D(t)$ is the linear growth factor in flat $\Lambda$CDM. We start from a random field with the BBKS transfer function, and we compute everything with an FFT written in TypeScript. Where the flow converges, particles pile up into halos, sheets and filaments.
The spaceship. The ship is a reusable rig that knows nothing about the data. Each 3D view describes its space (where to launch, how big the ship is, what to show at a position), and the rig provides the model, 6-degree-of-freedom flight with quaternions, chase and cockpit cameras, the flight HUD, a speed bar and an orientation globe. We wrote a short guide so that any new view can add the ship in a few steps. Climbing through the COSMOS map, the readout shows the redshift at your position.
The AI explainer. The Claude map reader follows one rule: the model describes, the code measures. Python extracts the peaks and extrema, annotated images are rendered, and Claude receives both. It returns structured JSON that is validated against a schema. Every claim has to cite a measured target, and the viewer renders the text with textContent only, so no model output is ever parsed as HTML. The explainer cannot change any cosmology result.
Reading the universe's parameters off a map. The quantity DES lensing constrains best is
$$ S_8 = \sigma_8\sqrt{\Omega_m/0.3}. $$
Our offline pipeline uses SBI. It computes summary statistics (peak counts and a binned power spectrum), trains a normalizing flow on simulated universes, and outputs a posterior over $(\Omega_m, S_8)$. It also runs an emcee baseline as a cross-check. The key rule, from the skill that started this project, is: whatever you do to the real map, do exactly the same to every simulated map. That covers mask, resolution, smoothing, mean subtraction and noise. The shape noise per pixel is
$$ \sigma_{\rm pix} = \frac{\sigma_e}{\sqrt{n_{\rm eff}\,A_{\rm pix}}}, $$
and simulations get the same noise as the data.
The stack.
- Frontend: TypeScript, Vite and three.js. There are three main tabs (Simulate, 3D map, Survey slices), a sky-sphere layer viewer with the AI panel, and the Tour.
- Data prep: Python (HEALPix, NumPy, SciPy) turns raw DES KaRMMa samples (100 posterior samples, 4 bins, HEALPix $N_{\rm side}=256$) and the COSMOS catalog into compact files the browser can stream.
- Science:
sbi(PyTorch),emcee, and a frozen summary-statistic config. - AI: Claude, with schema-validated output.
- Multiplayer: SpacetimeDB handles presence, presenter/follow and sky-anchored flags.
- Design and tooling: We prototyped designs quickly in Figma, and built the site with a mix of Claude, Cursor and Grok.
Challenges we ran into
- Honest depth. A 2D lensing map tempts you to draw a 3D one. We spent a lot of effort making sure the interface never claims more than the data supports. COSMOS's depth resolution is poor, so clumps stretch along the line of sight. The faint haze there is mostly shape noise, so we label it low-confidence and never call it "filaments."
- Fun without being wrong. Making things playful risks making them misleading. A spaceship flight through a map with log-compressed distances is not a literal journey, so we label those choices on screen. The same goes for the exaggerated lensing and for toy data.
- Making an AI explainer trustworthy. A fluent paragraph can sound more certain than the data allows. We made the model cite measured targets, separate measurements from impressions, and show limitations, and we made the viewer warn when the description doesn't match the map shown.
- Different parts of the sky. COSMOS is not inside the DES footprint. Putting both on a shared sky frame meant being careful about coordinates, distance compression and labels.
- Making simulations match the data. The released DES map is already smoothed and carries almost no information below about half a degree ($\ell \lesssim 400$). The simulations must get the same noise and filtering, or $S_8$ shifts with no error message. This is why the real-data inference is still in progress. We checked the DES map against an independent KaRMMa reconstruction (correlation 0.87–0.89 over the footprint) before trusting it.
- Toy first, real later. We built the whole pipeline on a toy universe with a known answer, so every part could run end to end. We label that toy data as toy everywhere in the UI.
- Python environments. Mixing pip and conda PyTorch builds crashed training on macOS (OpenMP conflicts). We moved to a single pinned conda environment with one launcher.
- A shared view across very different scenes. We packed each view's state (simulation, 3D map, slices) into one existing multiplayer message format, so presenter/follow works without changing the server.
- Three people, three days. Several branches had diverged, with duplicated science scripts and incompatible data formats. Merging them took real work.
Accomplishments that we're proud of
- A real DES Y3 mass map and our own rebuild of the COSMOS 3D map, running in a browser.
- A physically motivated, live simulation of structure formation that you can fly a spaceship through.
- An AI explainer whose claims point back to measured evidence on the map.
- A tested codebase: unit tests, type-checking, a reproducible data build (byte-identical output), and a validated SBI smoke test.
- Wording we can defend to a physicist. Claude describes maps, and measurements come from lensing.
What we learned
- Weak lensing: how shear becomes $\kappa$, why the bins overlap, and why the arbitrary zero point (the mass-sheet degeneracy) means the mean must be subtracted from both data and simulations.
- Simulation-based inference: the hard part is forward modelling, not the neural network. Most "weird $S_8$" bugs are mismatches between data and simulations.
- Zel'dovich dynamics: a one-line fluid approximation is enough to produce believable halos and filaments, and to teach the idea that gravity amplifies small ripples.
- Designing for accessibility: the best way to teach a hard idea is often to let people play with it first. Plain-language hints, interaction and good defaults do more than a long explanation.
- Honest communication: an accessible explanation and an accurate one can be the same thing, if you are careful with the wording. Using AI to explain science works best when it is limited to describing what has been measured.
- Working with AI tools: Claude, Cursor and Grok are fast at building features, but the project's ground rules (data contracts, claims, tests) have to come from the people.
What's next
- Finish the forward model (noise, then the map's filter) and train on CosmoGrid simulations. Then run the trust check (coverage on unseen simulations) and report $S_8$ with its 68% interval next to Planck.
- Run the Claude map reader on the real DES map with survey-matched fiducial simulations.
- Add the Galaxy Zoo merger cross-check against mass density.
- Take Penumbra to classrooms and museums. The shared rooms are built for a teacher leading a group through the map.
Built with
TypeScript, Vite, three.js, SpacetimeDB, Python, HEALPix (healpy), NumPy/SciPy, PyTorch, sbi, emcee, Claude (Anthropic), Figma, Cursor, Grok. Data: DES Y3 (KaRMMa mass maps), COSMOS (Leauthaud et al. 2007), Planck 2018.


Log in or sign up for Devpost to join the conversation.