-
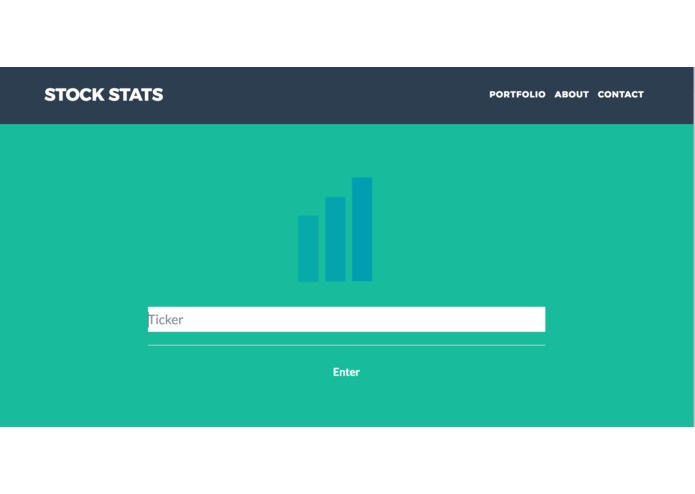
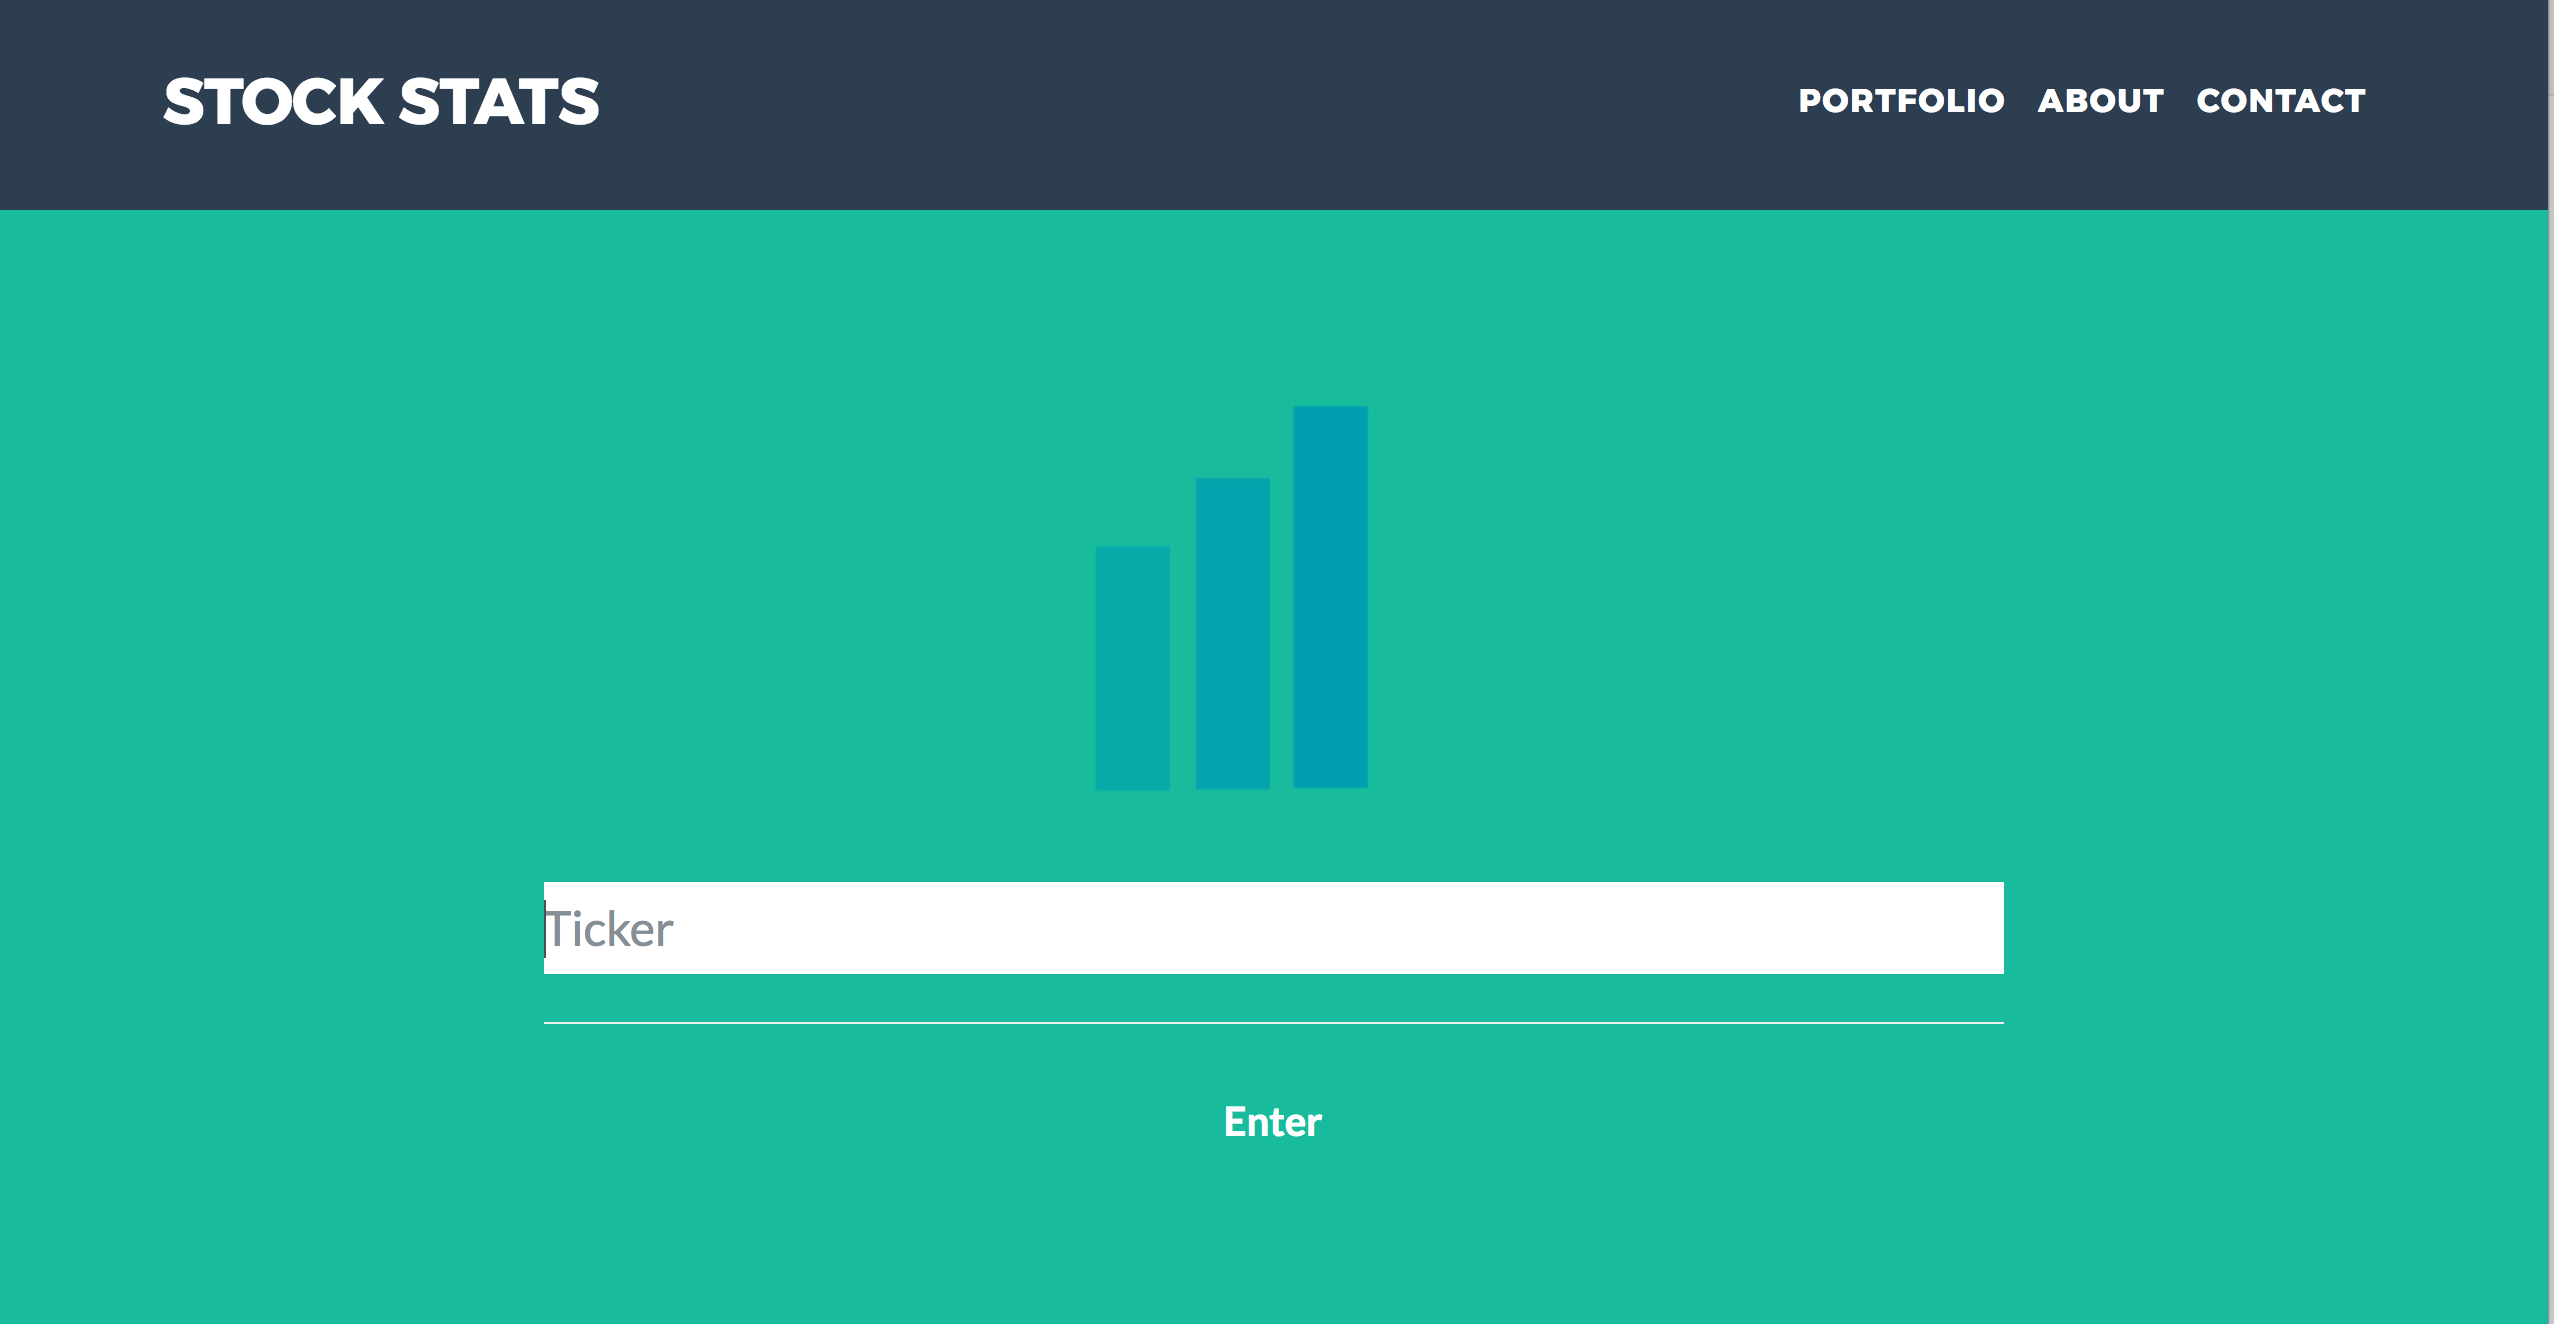
Main ticker entry point on index.html
Inspiration
After manually evaluating stocks with the Nasdaq Dozen (http://www.nasdaq.com/investing/dozen/) on Excel, I wanted to build an app that interfaces with the Aladdin API and checks how a stock compares with other companies automatically.
What it does
While it is not completed, the web app should be interfacing with the Aladdin API to gather the 12 metrics for the Nasdaq Dozen (http://www.nasdaq.com/investing/dozen/) and then provides a rating for how the stock should perform in the future. The twelve metrics for the Nasdaq Dozen include the following: Revenue, Earnings per Share (EPS), Return on Equity (ROE), Recommendations, Earnings Surprises, Forecast, Earnings Growth, PEG Ratio, Industry Earnings, Days to Cover, Insider Trading, and Weighted Alpha. This may require interaction with more than one API.
How I built it
I used bootstrapped HTML web pages on my local computer with ajax calls to the Aladdin APIs to make the product successful.
Challenges I ran into
I ran into a bug where I could not run the jquery get() method to navigate to the dashboard page. After this would have been completed I would have started searching for ways to check for the Nasdaq dozen. In addition, my team had several changes in project scope this weekend, so I had minimal time to try to implement my idea. I initially tried to build an app using Expo but ran into a few issues, but learned a lot about mobile development throughout the process.
Accomplishments that I'm proud of
I am proud of the look and vision of stock stats. I believe that is a solid foundation and could potentially become a great place to look up many statistics on publicly traded companies.
What I learned
I learned how to modify a bootstrapped web page and how important it is to properly define the scope of a project for a hackathon.
What's next for PennAppsXVI
I will hopefully continue to add to stock stats and complete the implementation I have in mind.


Log in or sign up for Devpost to join the conversation.