-
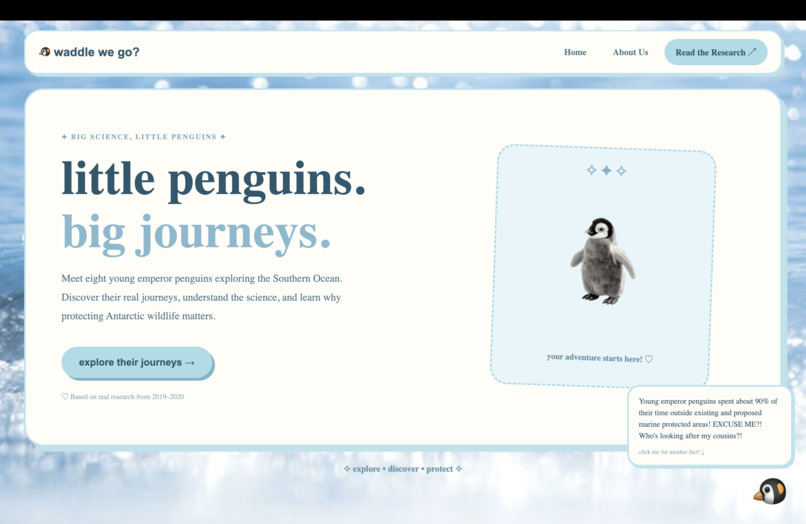
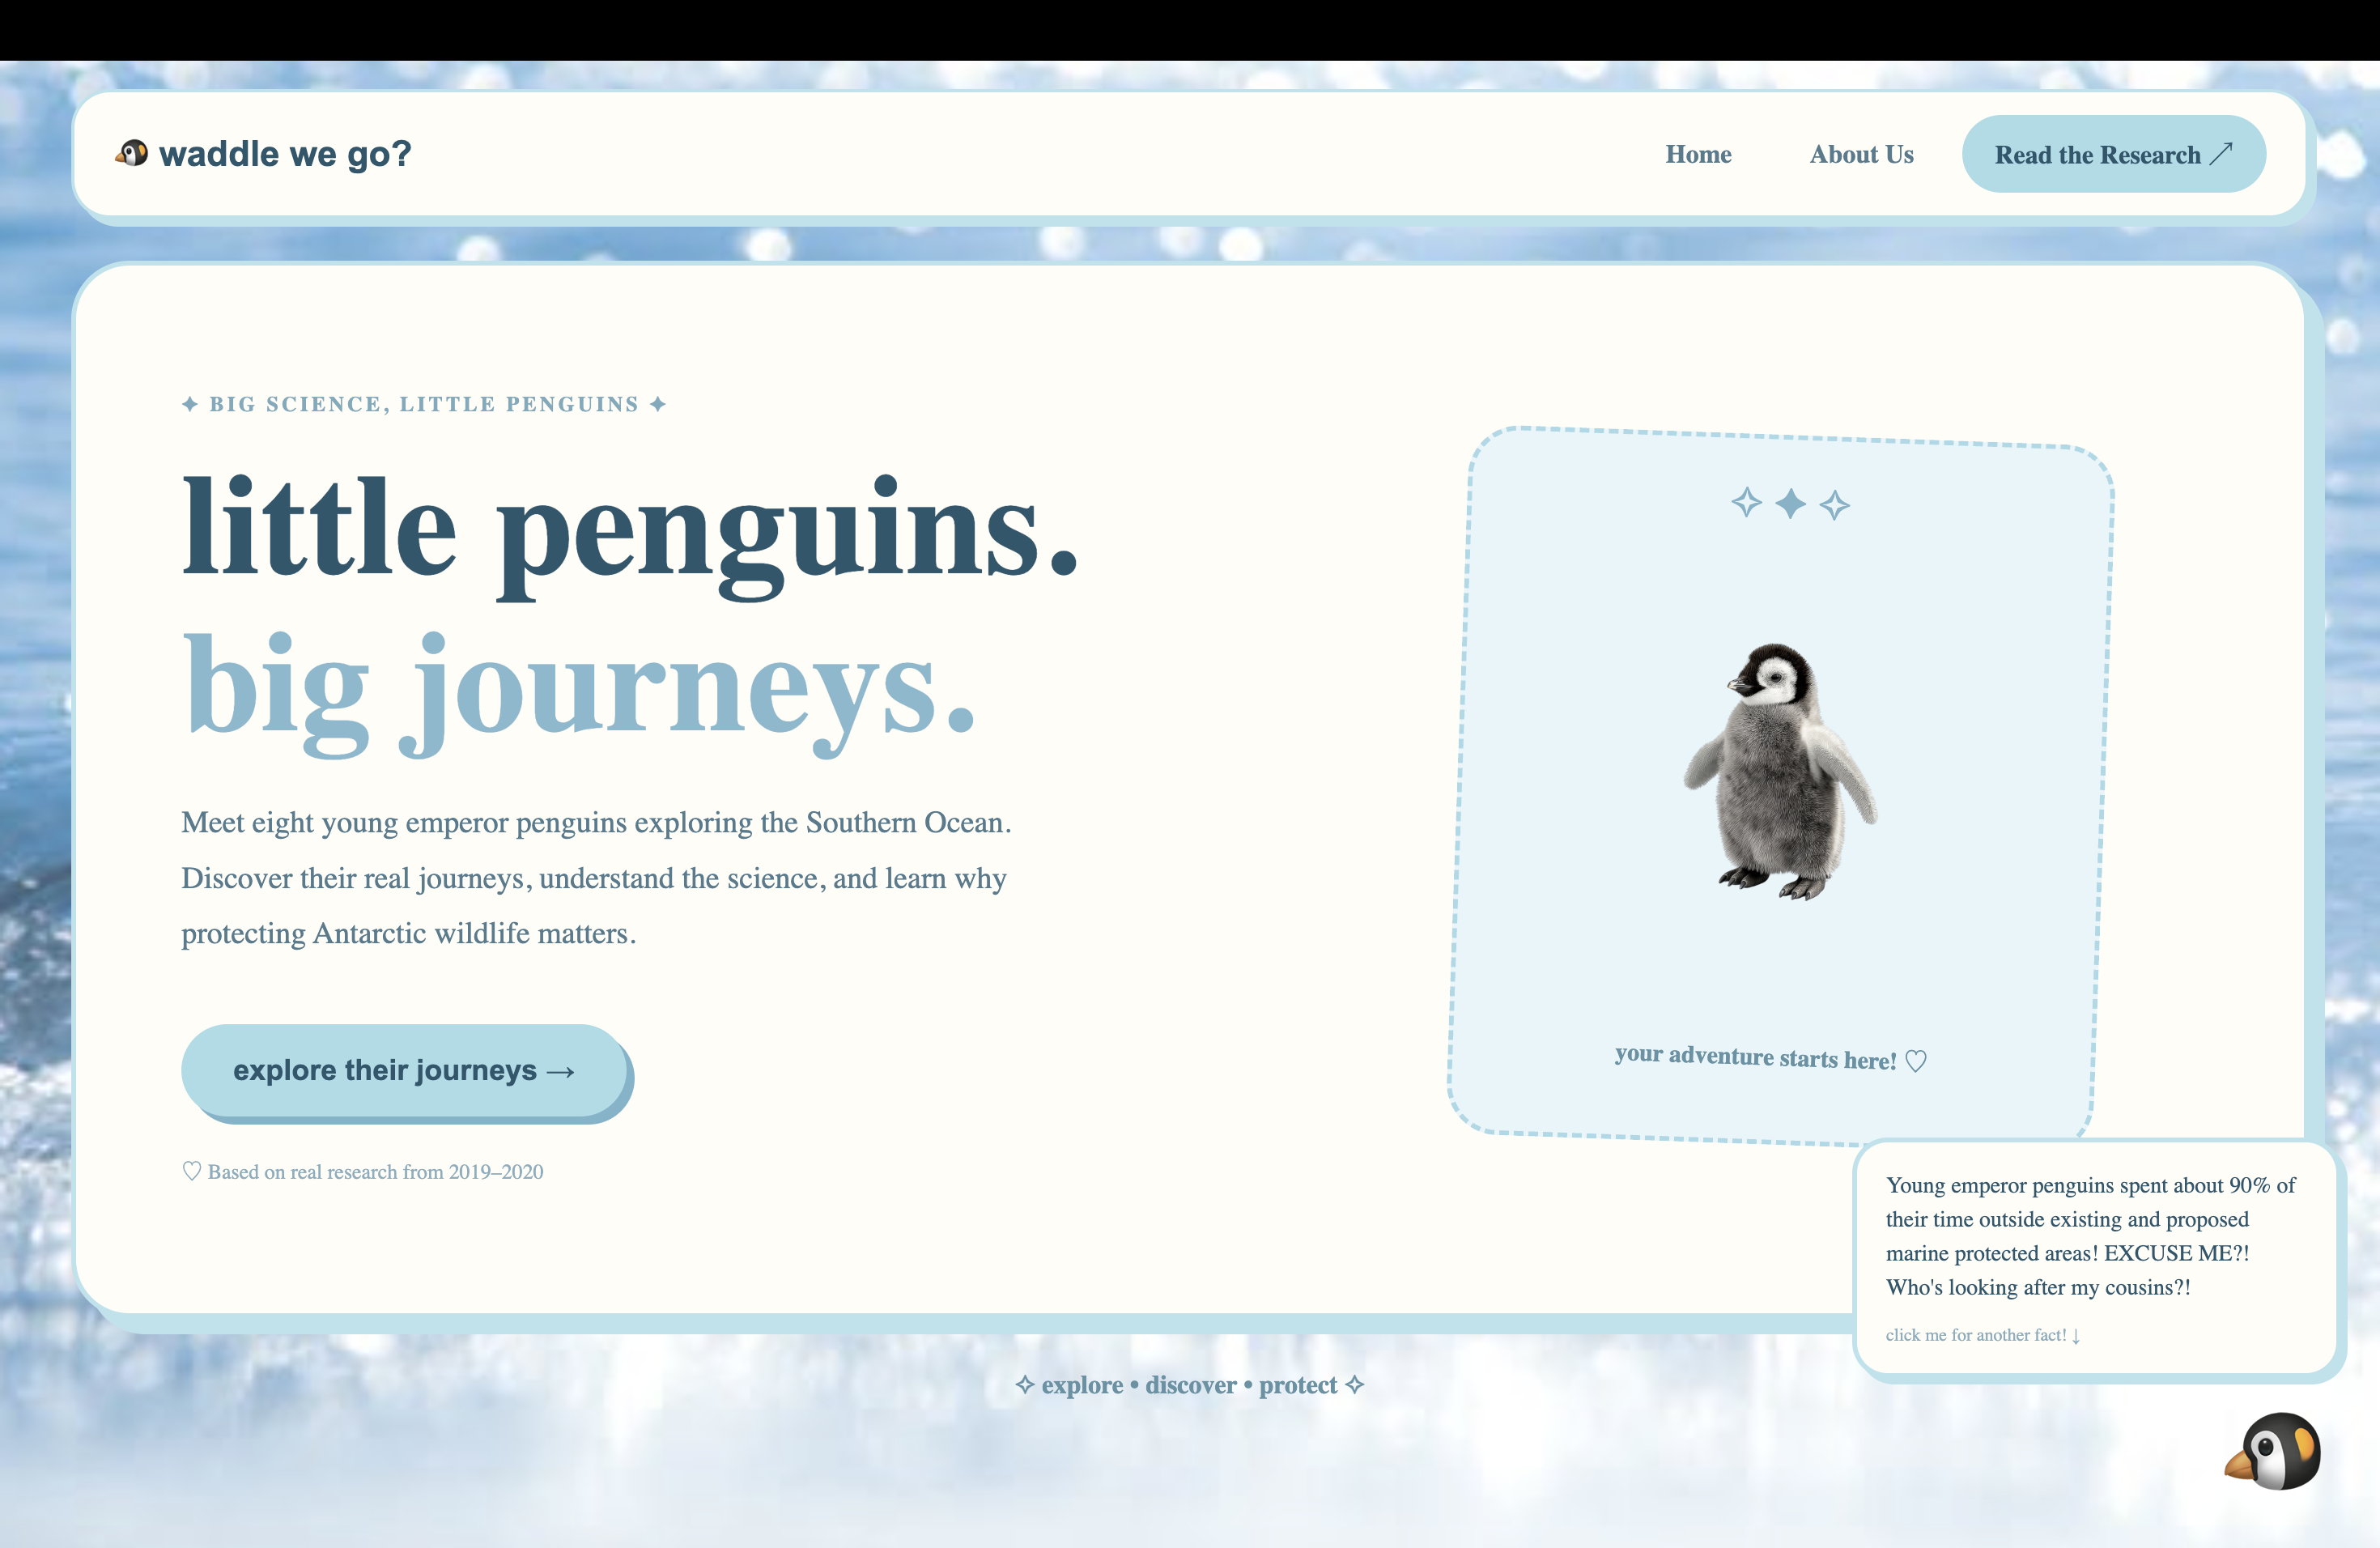
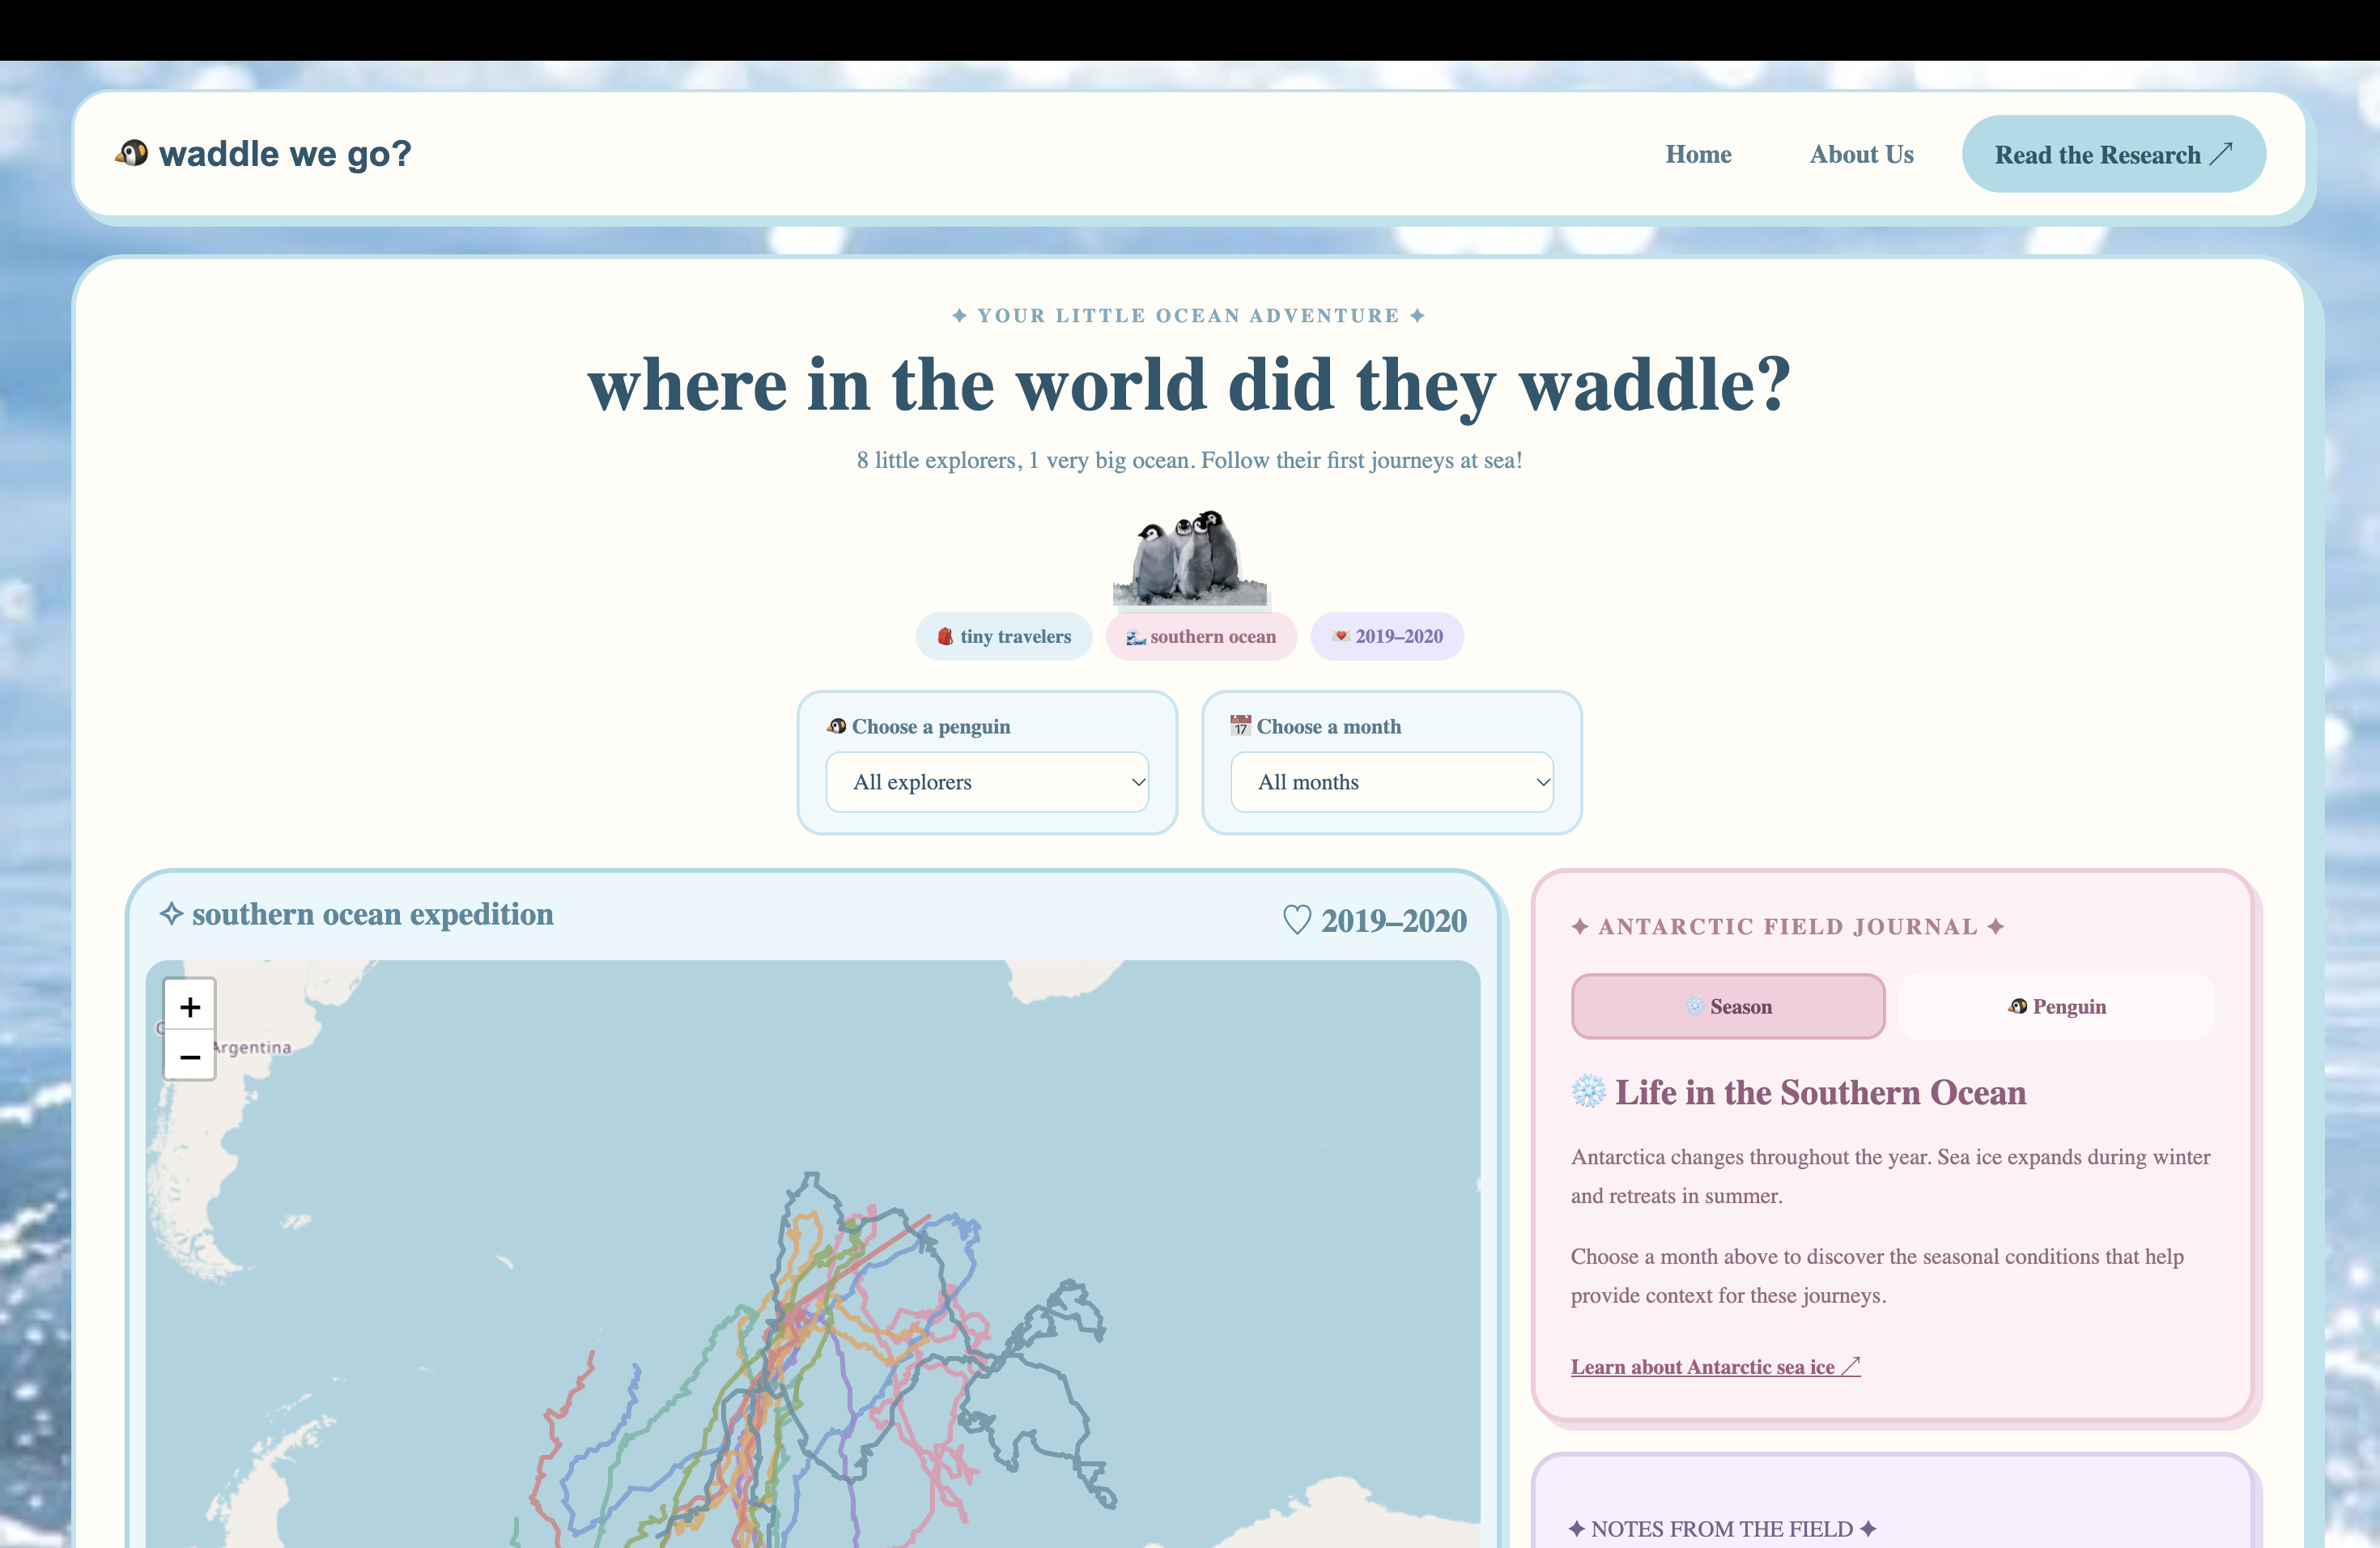
Home Page
-
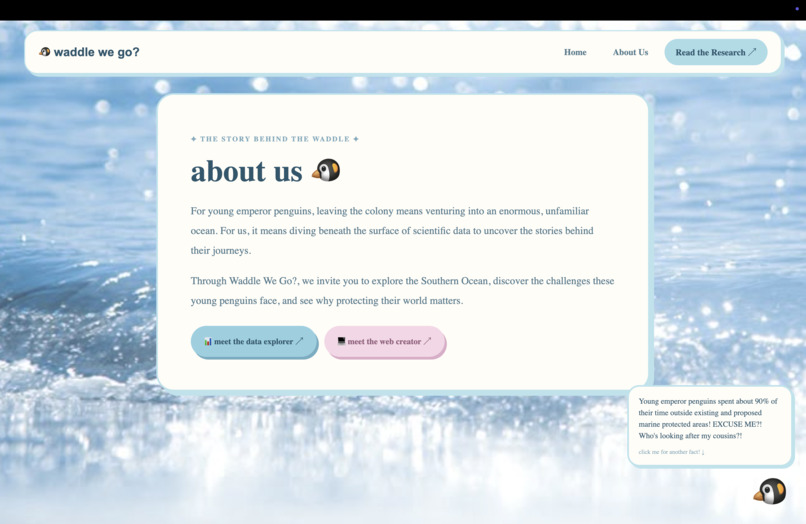
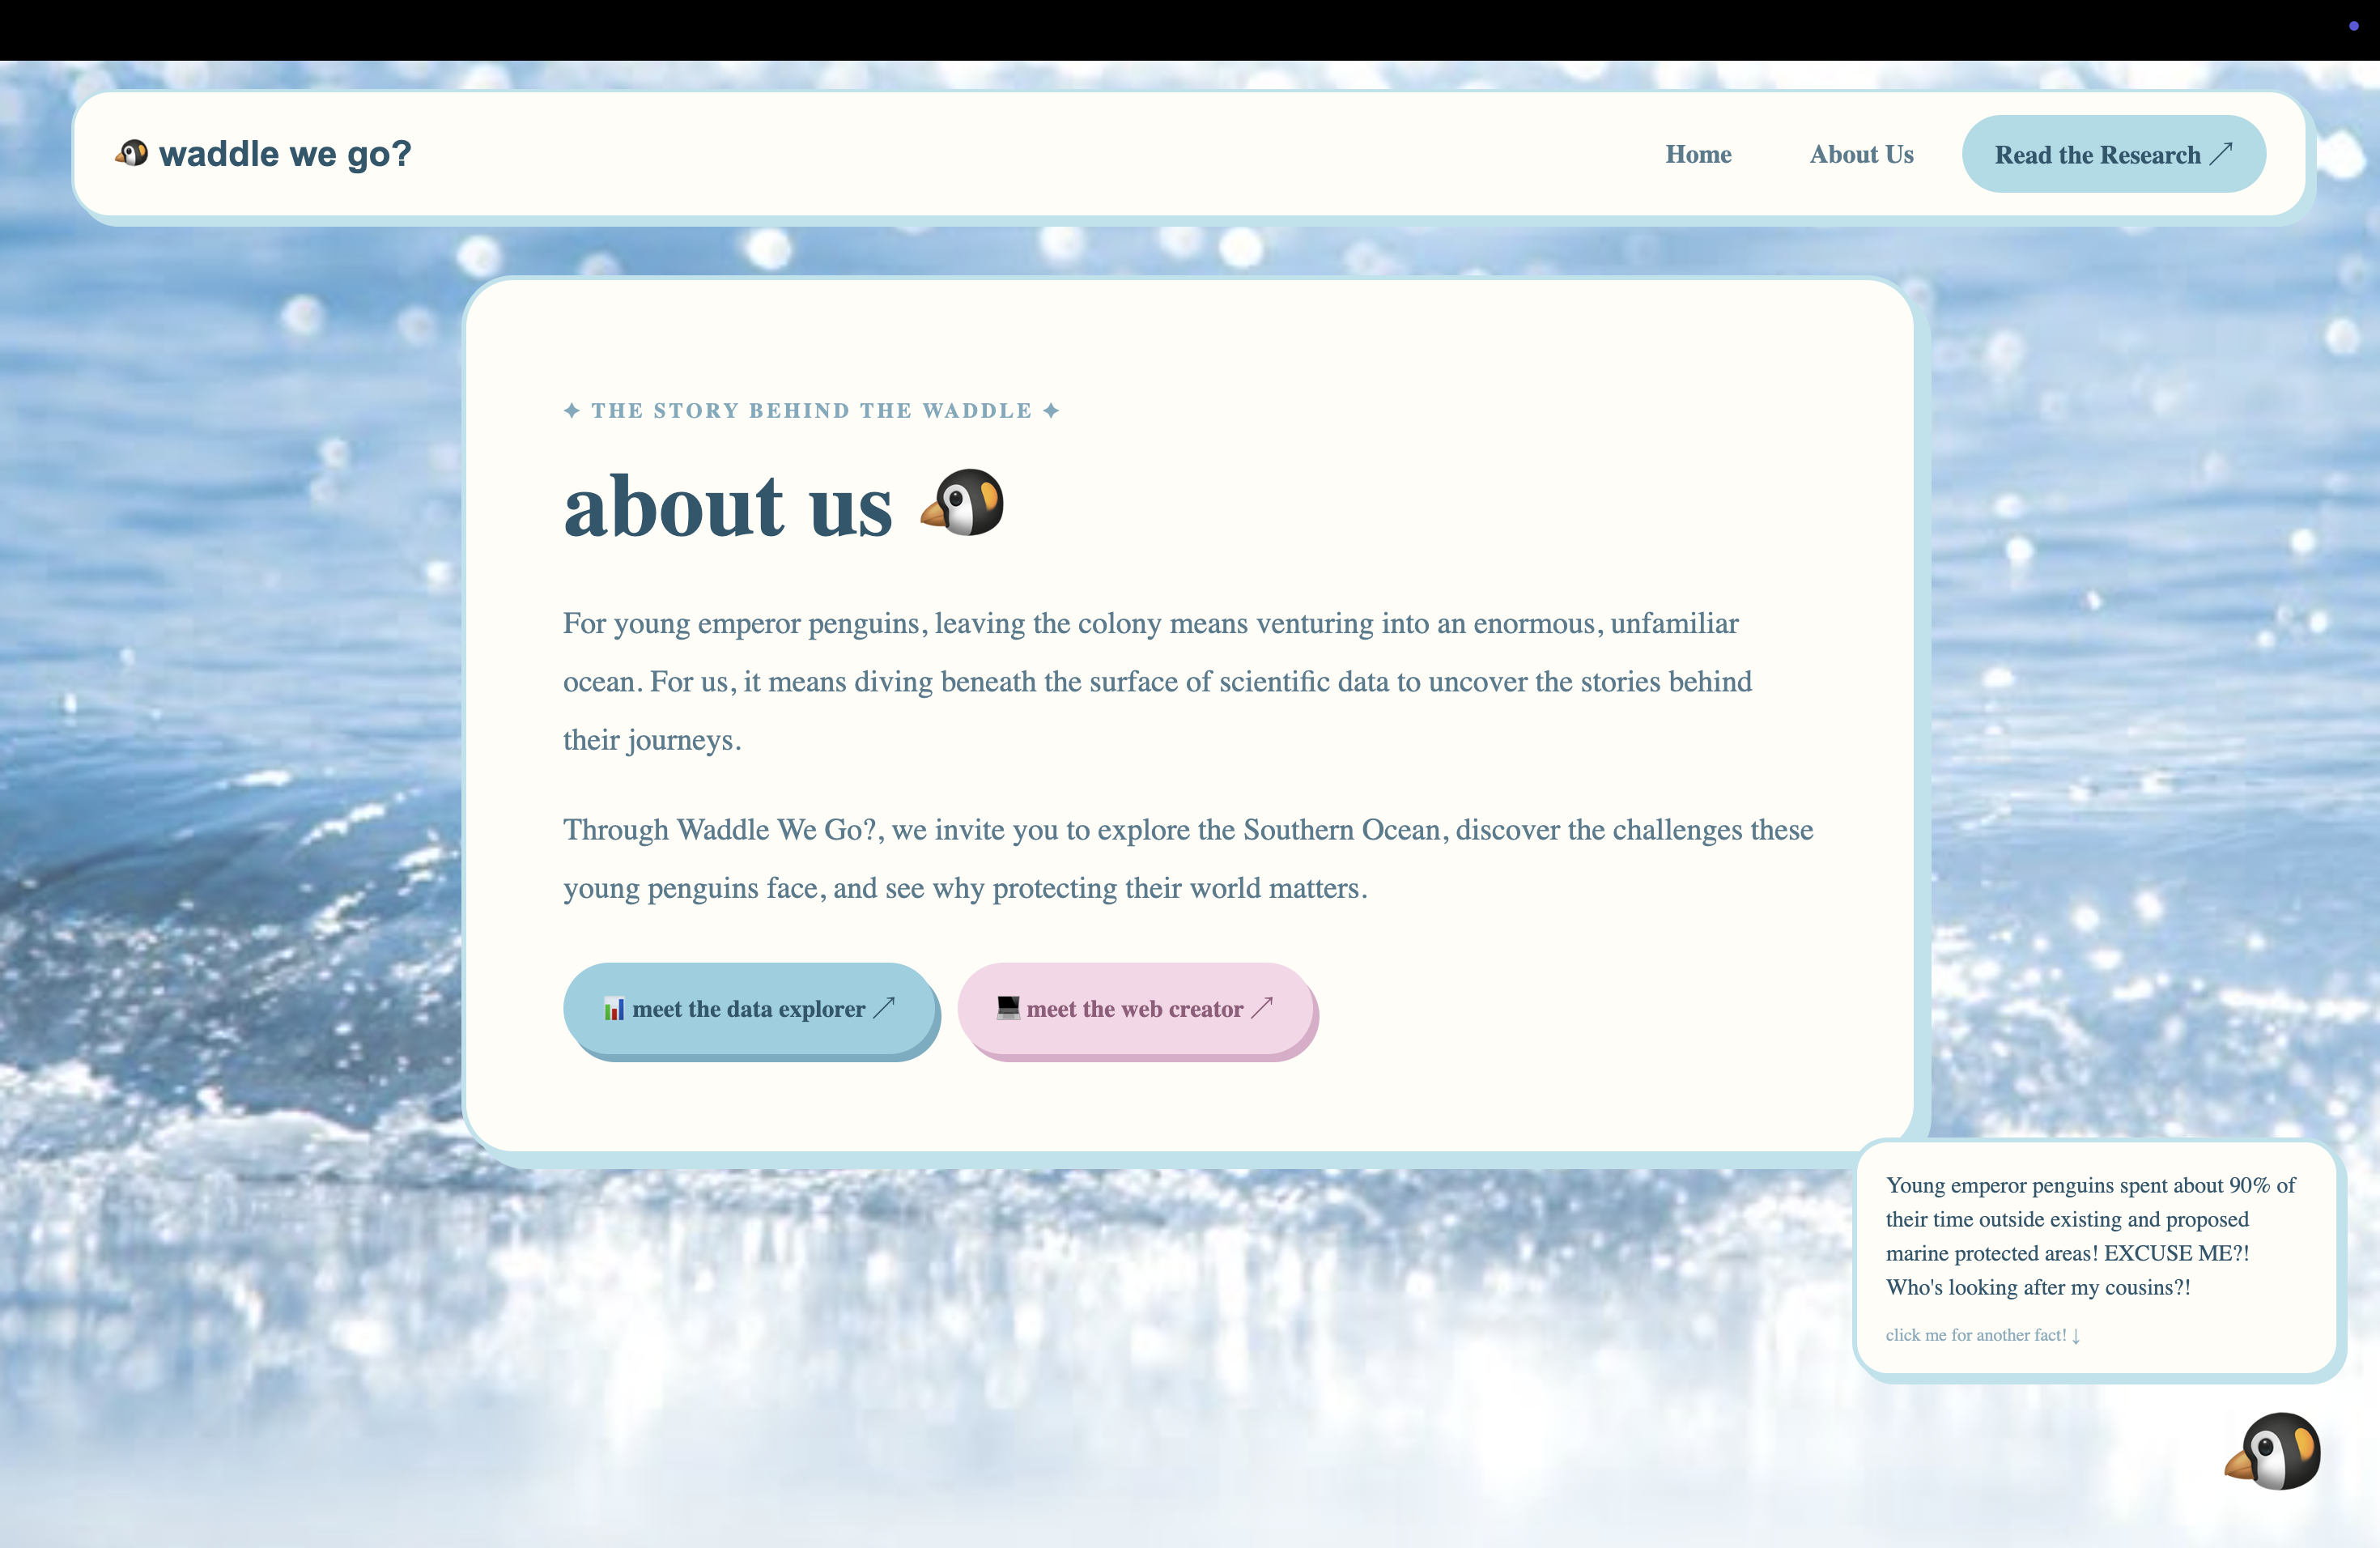
About Us Page
-
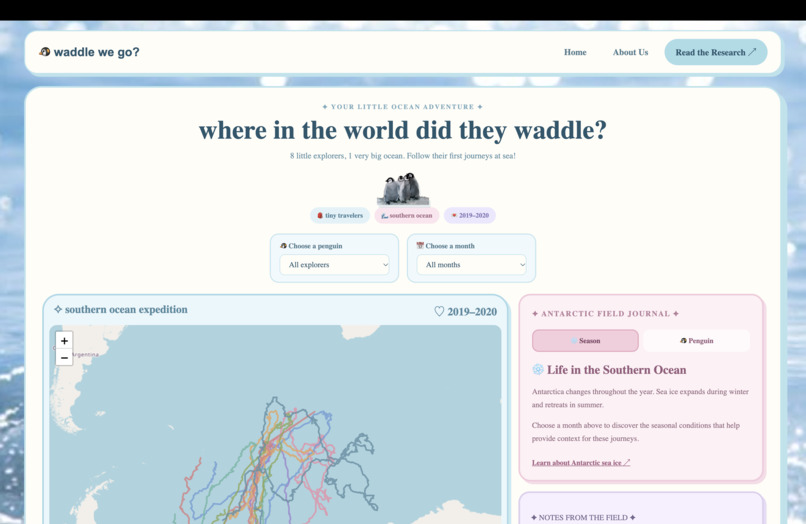
Map Page
-
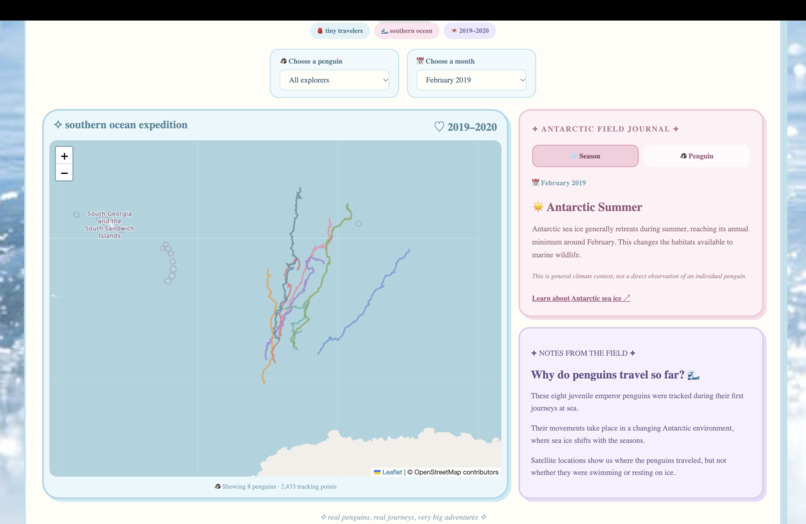
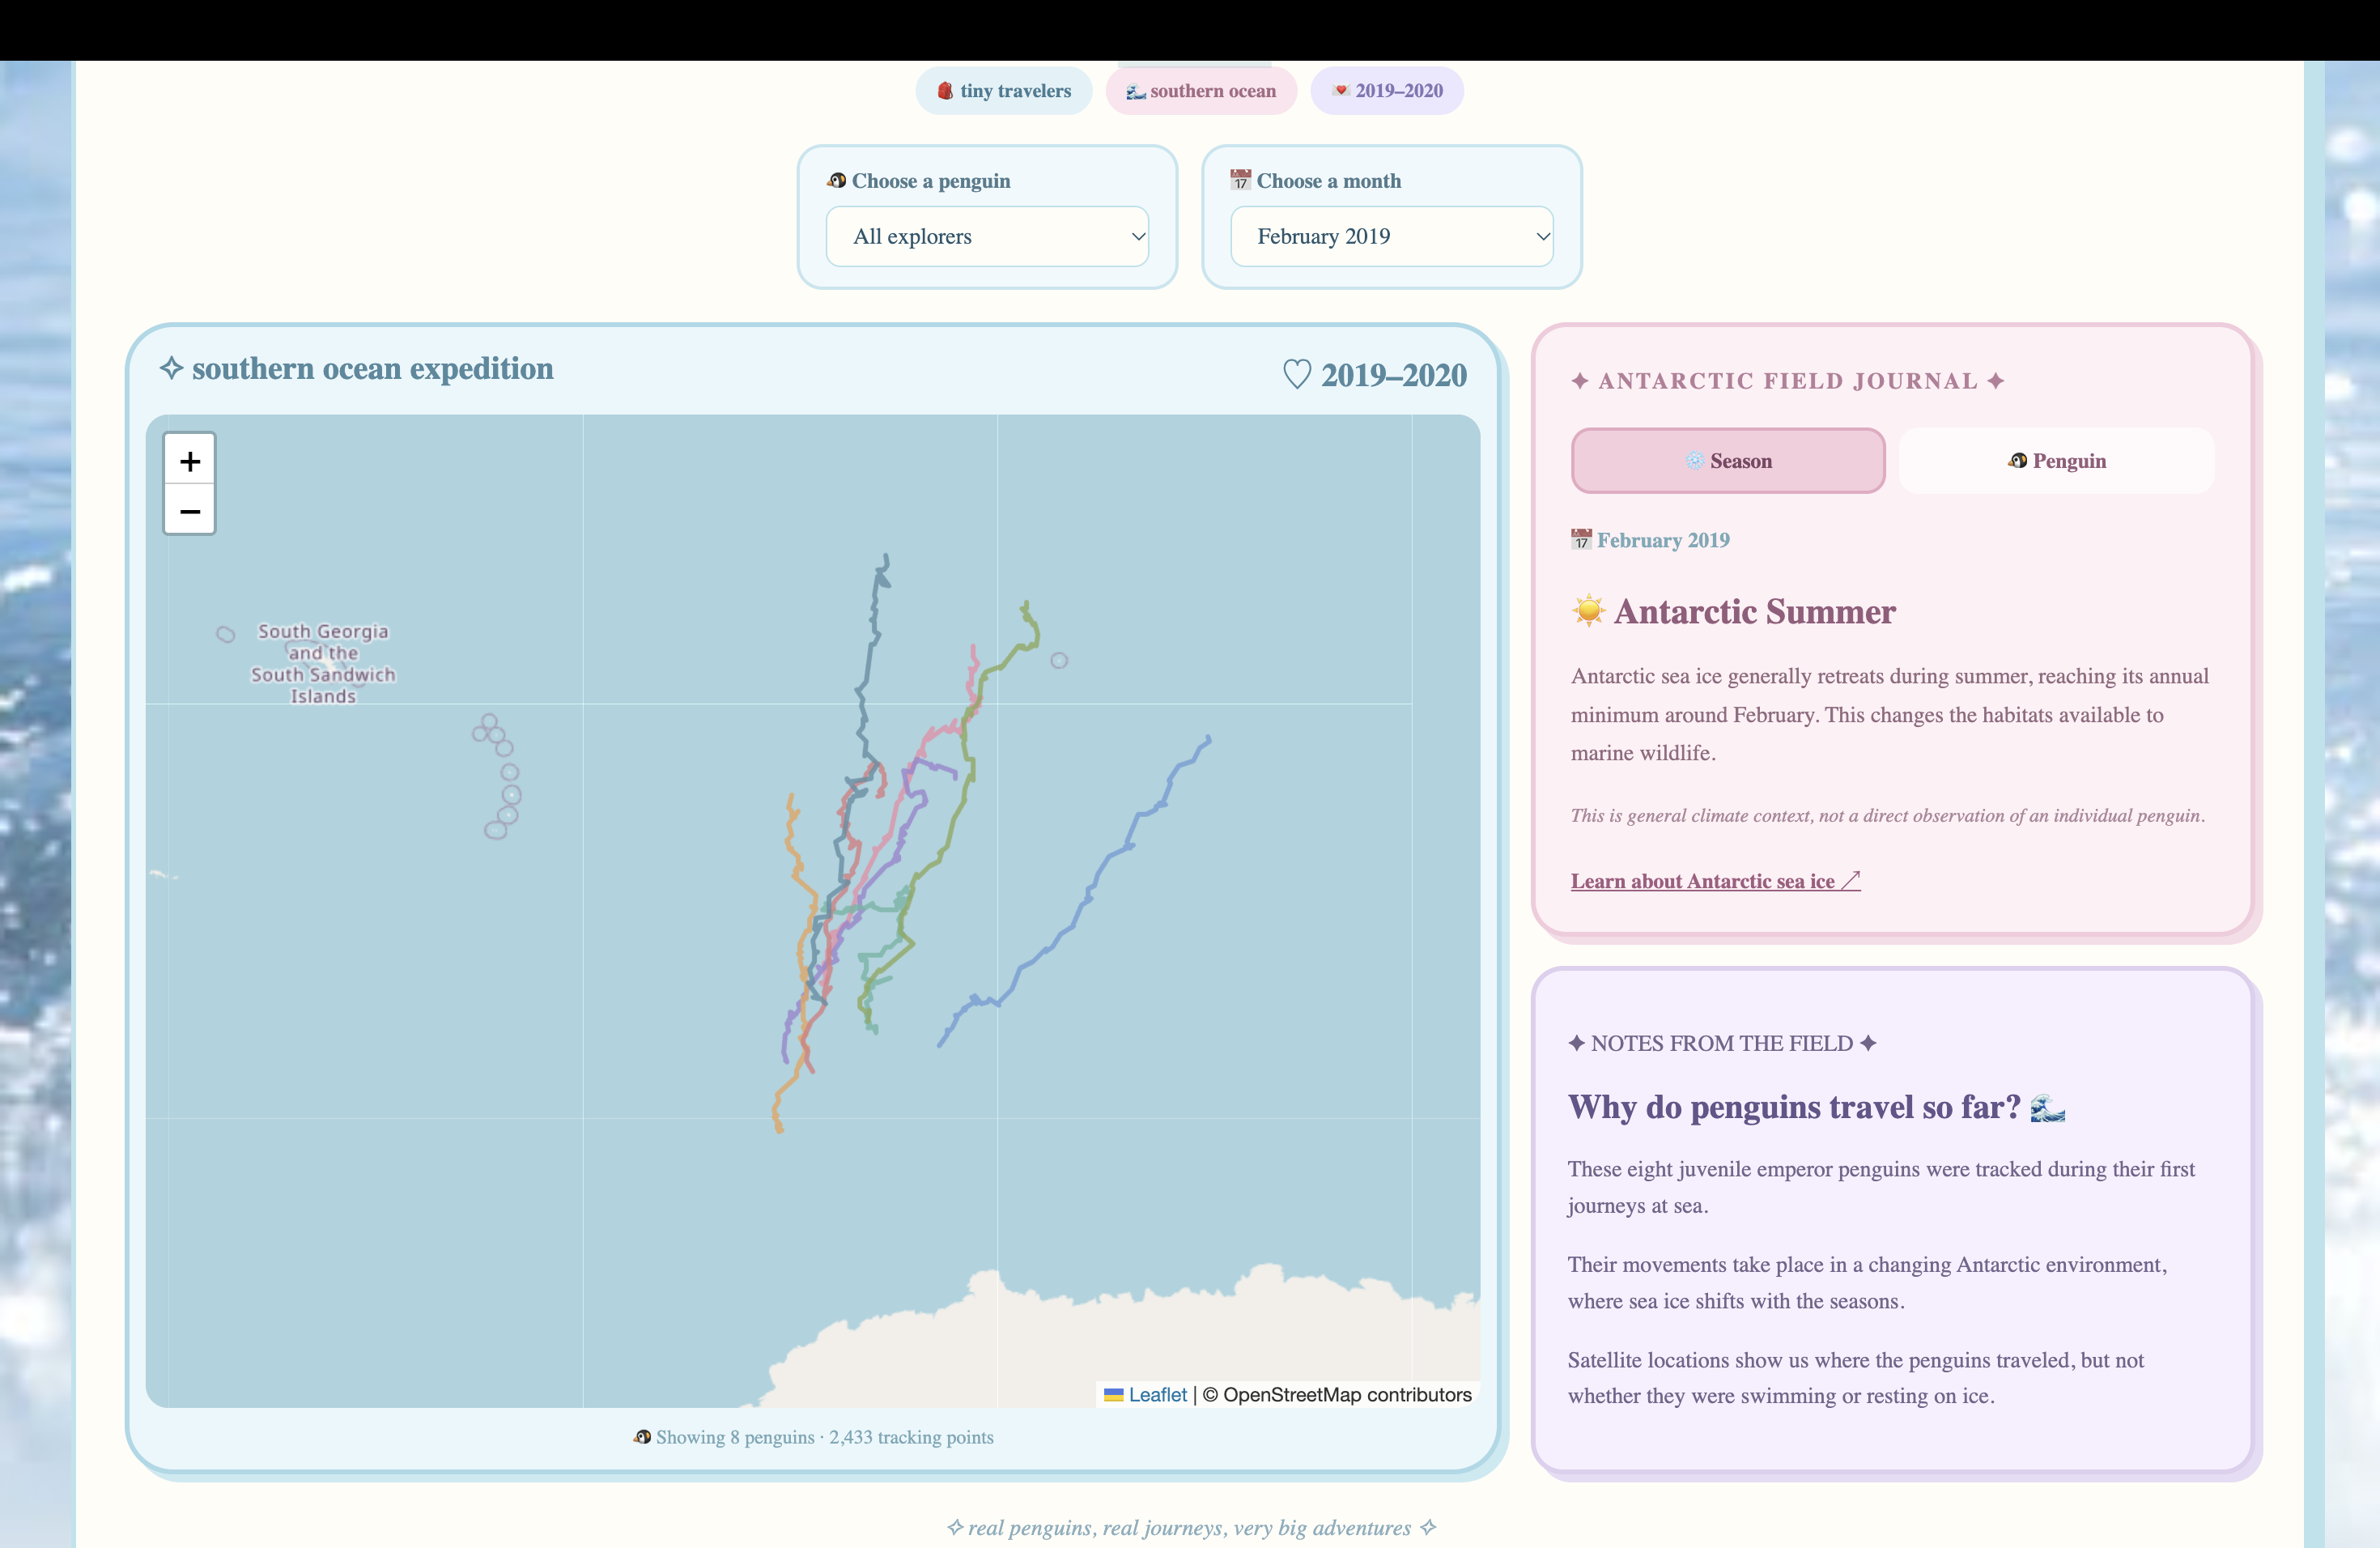
Seasonal Sea Ice Context
-
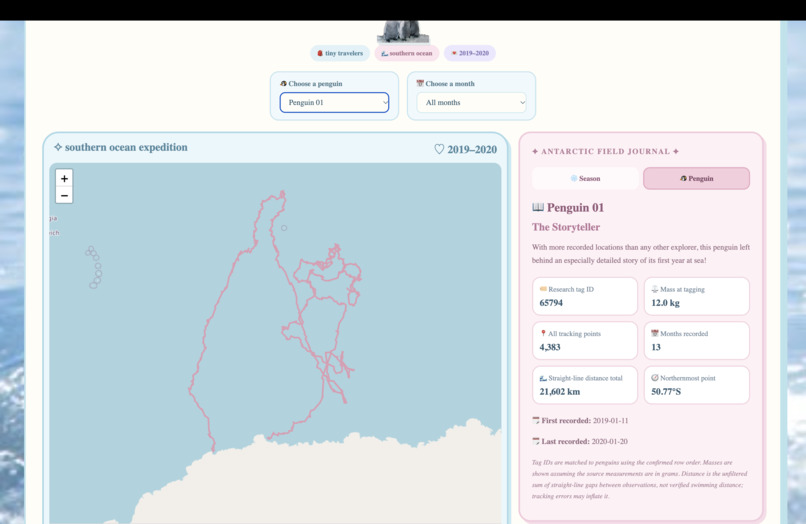
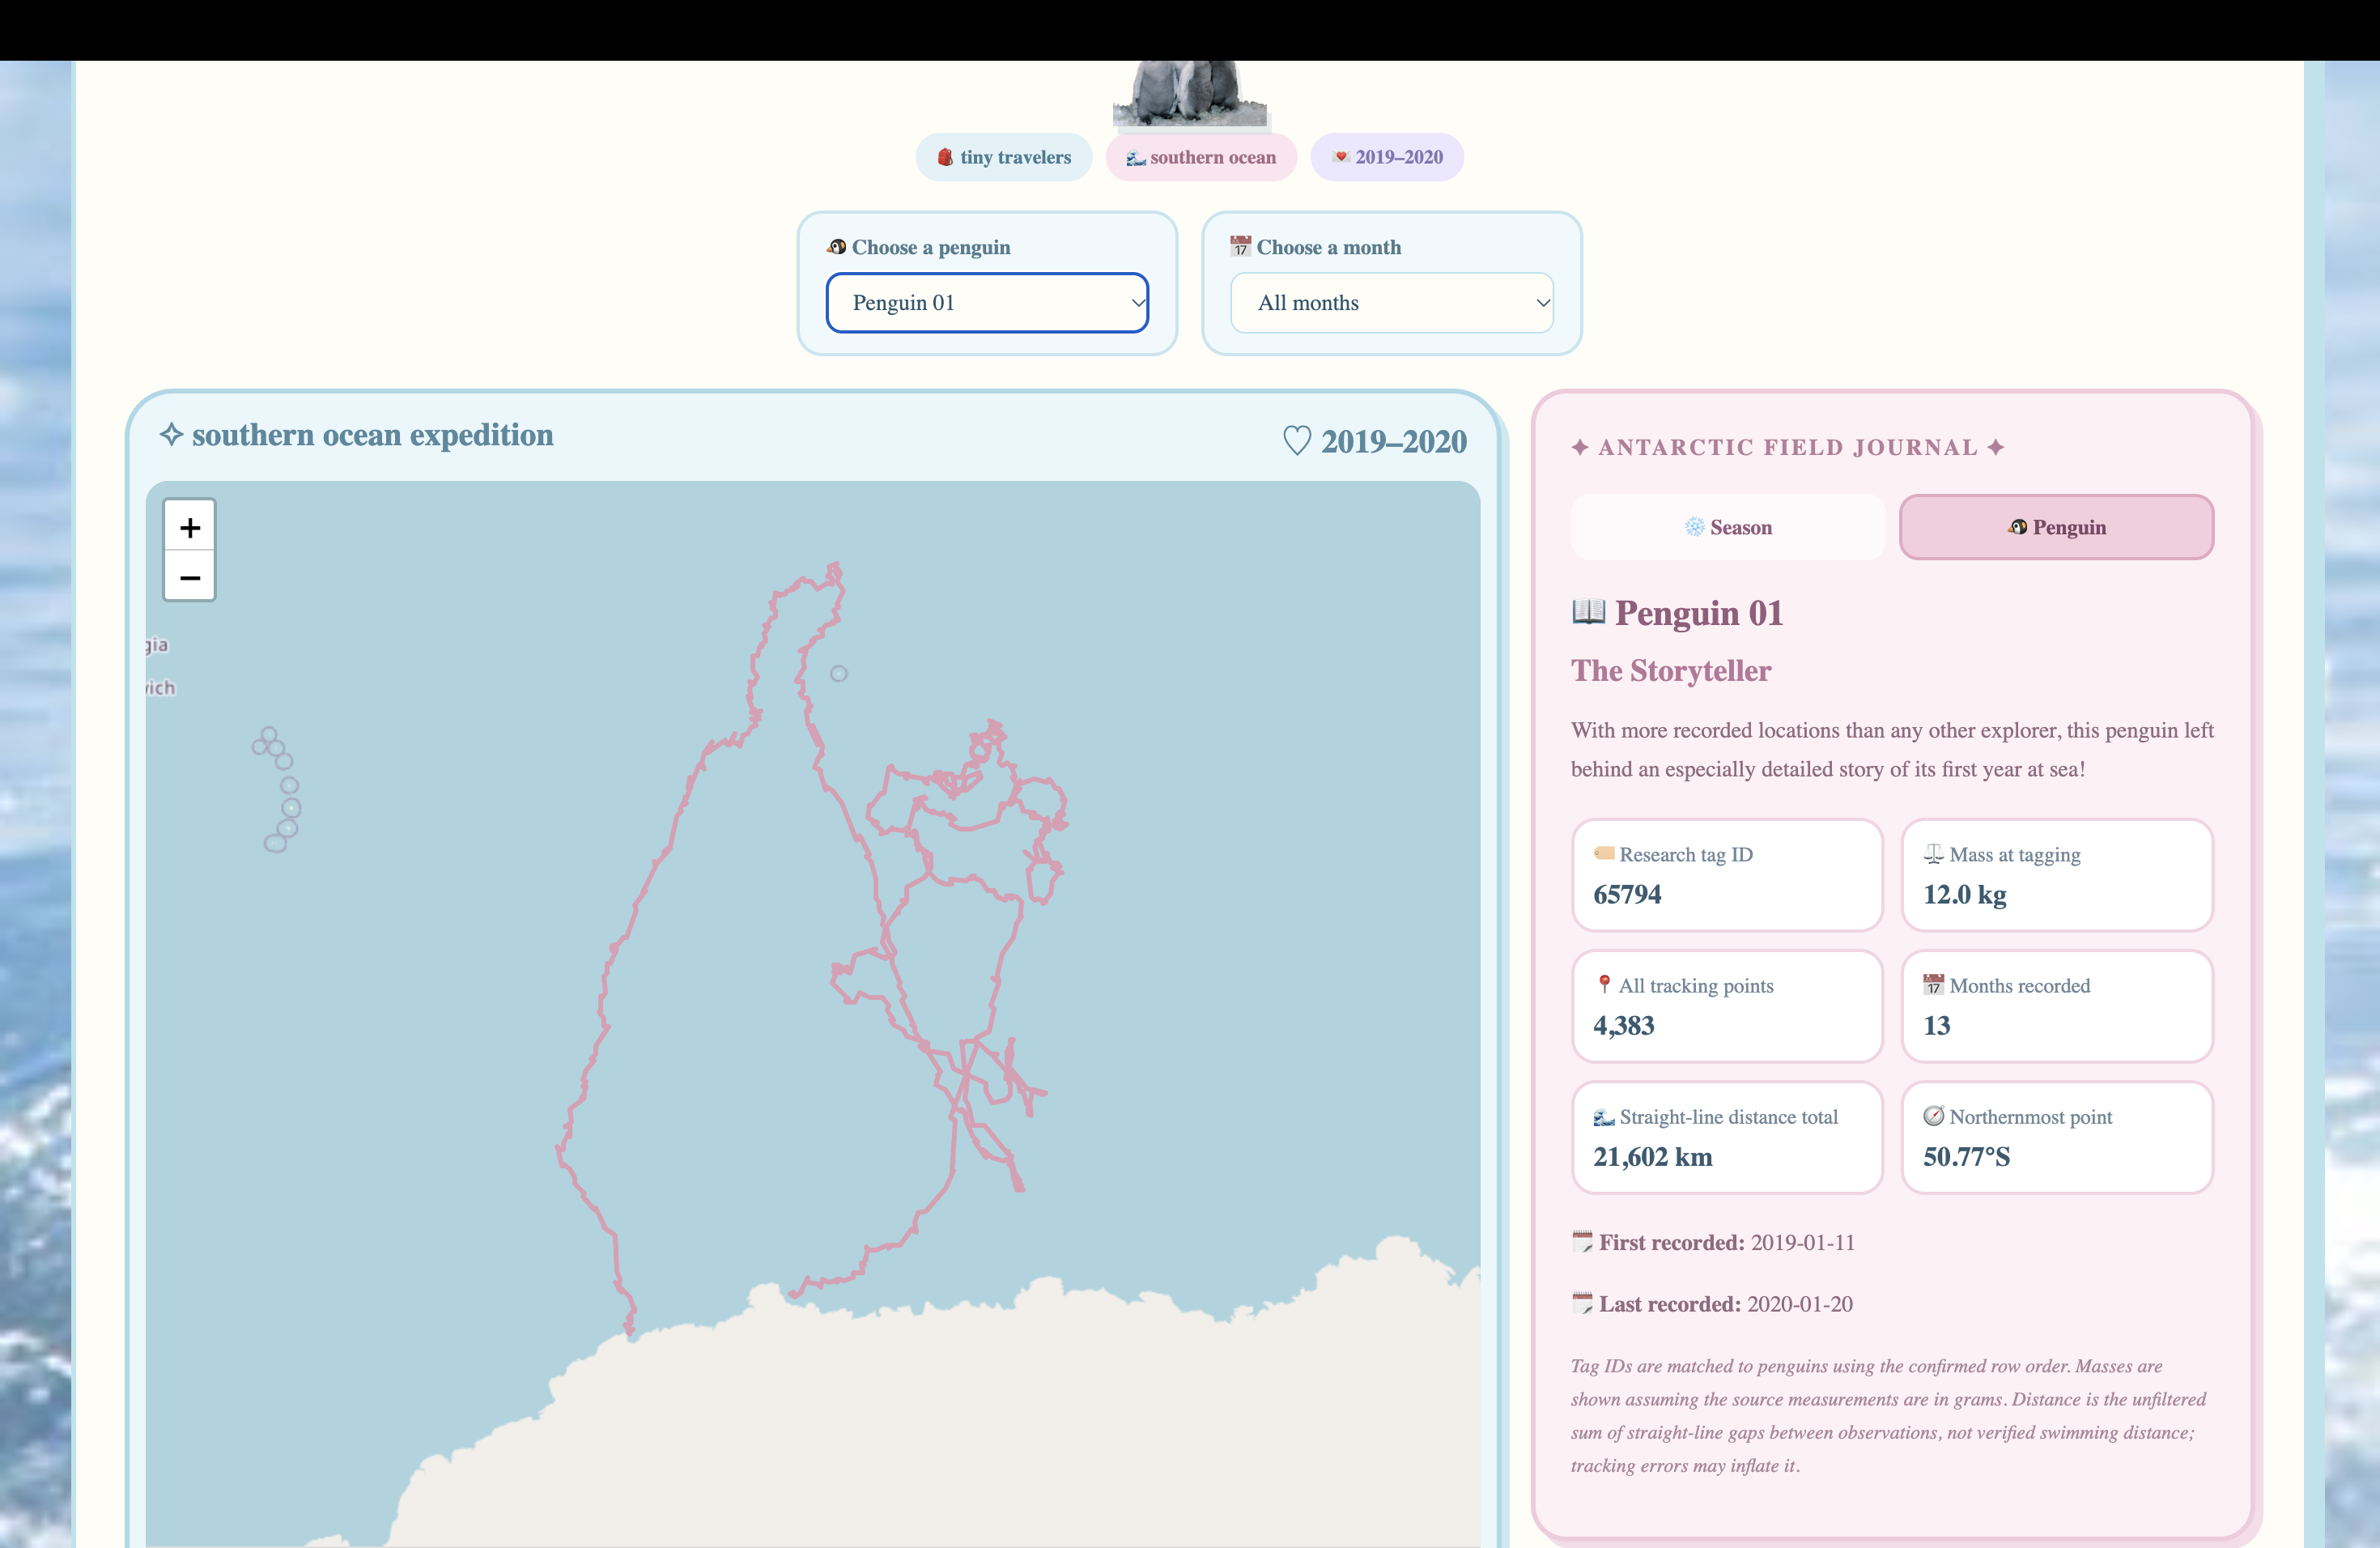
Individual Penguin Information
-
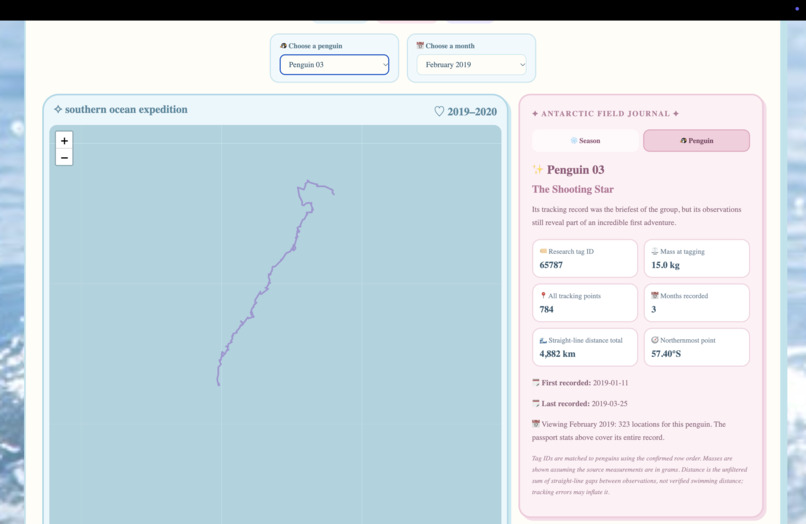
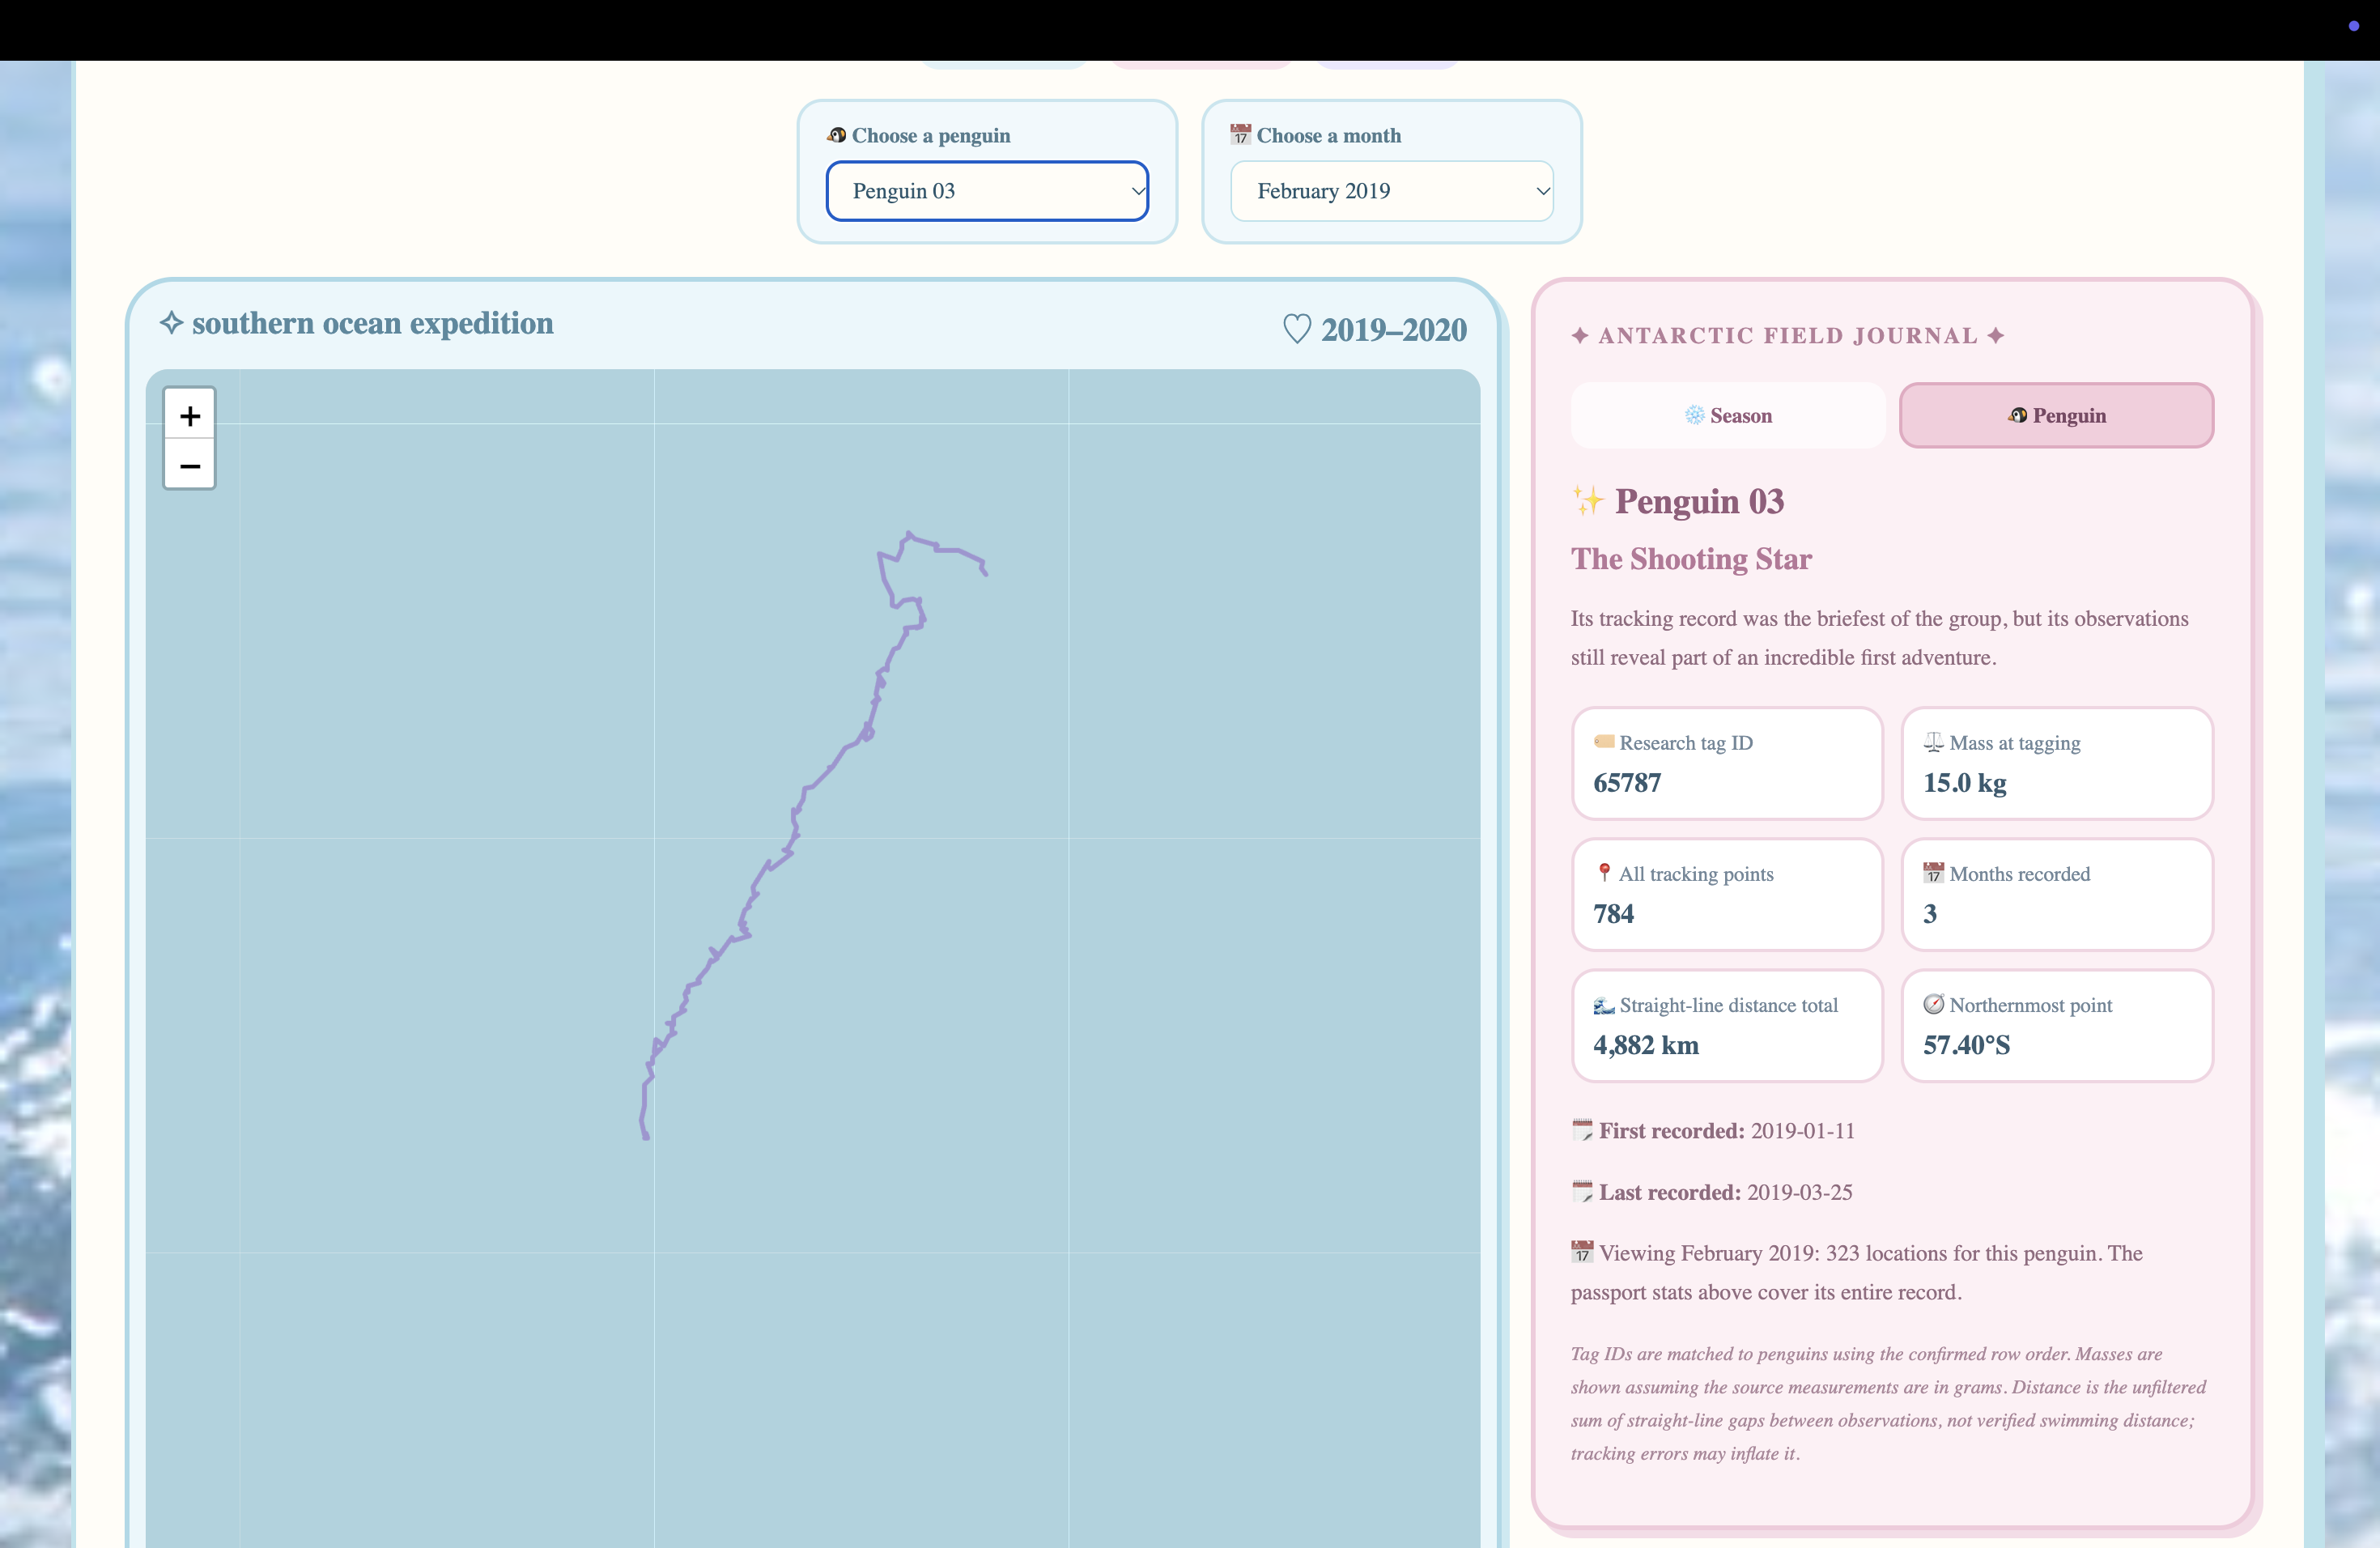
Filter by Month and Penguin
Inspiration
Our project actually started with a little bit of penguin panic!
After hearing concerning news about the future of emperor penguins and the threats they face from climate change, one of our team members, Tammy, became determined to do something to raise awareness.
We knew we wanted to build something involving penguins, but we weren't sure where to start. So we reached out to a graduate student in the University of Maryland's Department of Atmospheric and Oceanic Science (AOSC), who introduced us to real satellite-tracking research on juvenile emperor penguins and helped us better understand the science behind their movements.
That's when our idea began to take shape. Instead of just building a cute penguin-themed website, we realized we could use real scientific data to tell a meaningful conservation story.
Our approach was also inspired by Giorgia Lupi's philosophy of data humanism: the idea that data should represent more than abstract numbers—it should help us recognize the individuals and stories behind them, something that we learned in ENGL143: Visualizing Knowledge: From Data to Images.
We wondered: If humanizing data helps us empathize with people, could personalizing wildlife data help us empathize with animals, too?
That's why we decided to give each penguin its own identity and let visitors explore its individual journey.
Through Waddle We Go?, we hope to turn concern into curiosity, curiosity into connection, and connection into greater awareness of Antarctic conservation.
What it does
Makes penguin science fun and accessible: Waddle We Go? transforms scientific research into an engaging, beginner-friendly experience. Visitors can discover research-based facts through an interactive penguin mascot in the bottom-right corner of the website and navigate between pages to learn more about the project and the research behind it.
Visualizes real penguin tracking data: Using data from the study Juvenile emperor penguin range calls for extended conservation measures in the Southern Ocean, the website displays satellite-tracked locations of eight juvenile emperor penguins from Atka Bay, Antarctica, recorded between January 2019 and January 2020. Their observations are visualized as color-coded paths on an interactive map, allowing visitors to explore their journeys across the Southern Ocean.
Allows users to explore and filter tracking data: Visitors can filter the map by individual penguin, month, or both, making it easier to examine specific journeys and observe how recorded locations change over time. Users can also view all eight penguins together to compare their movements.
Provides context through an interactive Antarctic Field Journal: Alongside the map, visitors can switch between two information panels. The Penguin tab introduces each young explorer through a playful nickname, individual profile, and tracking statistics, while the Season tab explains general Antarctic sea-ice conditions during the selected time of year. Together, these features connect individual penguin journeys to the broader environment they travel through.
How we built it
Lina:
- Used R to process, organize, and analyze the penguin tracking dataset from Juvenile emperor penguin range calls for extended conservation measures in the Southern Ocean.
- Created interactive maps to visualize penguin locations across different months, using consistent colors and numbered IDs to help users distinguish individual penguins and interpret the maps, which the user could filter to display all penguins across the full tracking period, all penguins in a selected month, or an individual penguin in a selected month.
Tammy:
- Developed the frontend of Waddle We Go? using React, JavaScript, CSS, and Vite. Integrated the processed penguin tracking data into an interactive website using React-Leaflet, and implemented features such as the Antarctic Field Journal, individual penguin profiles, seasonal information cards, and an interactive penguin mascot that shares research-based facts.
- Designed and refined the website's user interface, including its ocean-inspired aesthetic, navigation, layouts, and interactive elements. Used ChatGPT for AI-assisted brainstorming, code generation, and debugging, while manually modifying, testing, and improving the website to ensure its functionality and visual consistency.
Challenges we ran into
Lina: Some penguins had missing tracking data during certain months, which made it difficult to understand their movement patterns. We considered possible explanations, including tracking devices stopping transmission. For example, the research paper states that two penguins reached the South Sandwich Islands region around June, and so their tracking devices stopped transmitting in July.
Tammy: One of the biggest challenges we encountered was learning to use Git and GitHub for collaboration, especially when I had to resolve my first merge conflict after encountering unrelated repository histories. Another challenge was translating my design ideas into code. Although ChatGPT was helpful for brainstorming and generating code, it was often difficult to communicate the exact aesthetic I envisioned, requiring extensive manual CSS adjustments, debugging, and experimentation. We also encountered a minor data organization challenge when some penguin identification metadata was removed during dataset simplification, making it temporarily difficult to match individual penguins to their original research records. Fortunately, we had preserved a reference to the original metadata, allowing us to restore the connections. Overall, these challenges taught us the importance of clear communication, preserving original data, and balancing AI-assisted development with hands-on problem-solving and creative decision-making.
Accomplishments that we're proud of
Lina:
- I am proud of successfully processing and analyzing the penguin tracking dataset in R, converting the raw location data into an organized format that could be used to create interactive maps that plot the penguins’ geographic coordinates and visualize their movements over time.
- I also feel accomplished with the development of maps that allow users to explore penguin locations across different months, color-coding and assigning an identifiable number to each penguin, making movement patterns and gaps in tracking data easier to observe.
Tammy:
- One of the things I'm most proud of is being able to apply what I've been learning in my web development course to a real project for the first time. Although I only recently started the course, this hackathon gave me the opportunity to experiment with frontend development, turn my ideas into something interactive, and discover how much I genuinely enjoy building websites. I'm also really proud of how the final website turned out, especially its cohesive design, playful aesthetic, and attention to small details that make the experience more engaging.
- Another personal milestone was becoming much more comfortable using Git and GitHub compared to when I participated in the same hackathon last year. Being able to troubleshoot issues and even resolve my first merge conflict made me realize how much I've learned and how much more confident I've become.
What we learned
Lina:
- I learned how to use the Leaflet library to create interactive maps that display geographic data in R, along with writing reusable functions that allow users to filter penguin tracking data.
Tammy:
- Gained hands-on experience working with React, JavaScript, and CSS. I also learned more about AI-assisted development, or “vibe coding,” including how to communicate ideas effectively to ChatGPT, evaluate generated code, and manually refine it to achieve the results I wanted. Working with real scientific datasets taught me how to integrate and visualize data, while debugging and collaborating through Git and GitHub strengthened my problem-solving skills.
- Unexpectedly, I also learned quite a bit about ocean science and marine biology! Exploring the research behind our dataset introduced me to juvenile emperor penguin movements, seasonal changes in Antarctic sea ice, and the importance of marine conservation.
What's next for Waddle We Go?
Expand the data available: Incorporate additional datasets, such as sea ice levels and krill populations, to help users better understand how changing ocean conditions may affect penguin movements and habitats.
Encourage conservation efforts: List links to conservation organizations, educational websites, and donation opportunities so users can learn more about penguin conservation and find ways to support these efforts.
Refactor and organize the codebase: Reorganize the AI-assisted frontend code into cleaner, more reusable React components to improve readability, maintainability, and overall performance. This would also provide an opportunity to better understand the code and strengthen my web development skills.
Develop more original educational content: Spend more time reading and interpreting the original scientific research to write penguin facts, profiles, and educational explanations in my own words, rather than relying heavily on AI-generated summaries. This would help make the website's content more thoughtful, accurate, and personal.
Built With
- chatgpt
- css
- javascript
- leaflet.js
- r
- react
- vite

Log in or sign up for Devpost to join the conversation.