Understanding pedestrian fatalities are a critical component of making our transportation network safer. Understanding what factors influence pedestrian fatality rates within and across local, regional, and national transportation networks is a subject that needs more attention. To this end, my goal was to create a simple, easy to understand yet powerful graph that displayed the data from about state pedestrian fatality rates, from the National Highway Traffic Safety Administration’s (NHTSA) Fatality Analysis Reporting System (FARS) database. I hope this type of graph can help inform future policy and/or investment of the USDOT.
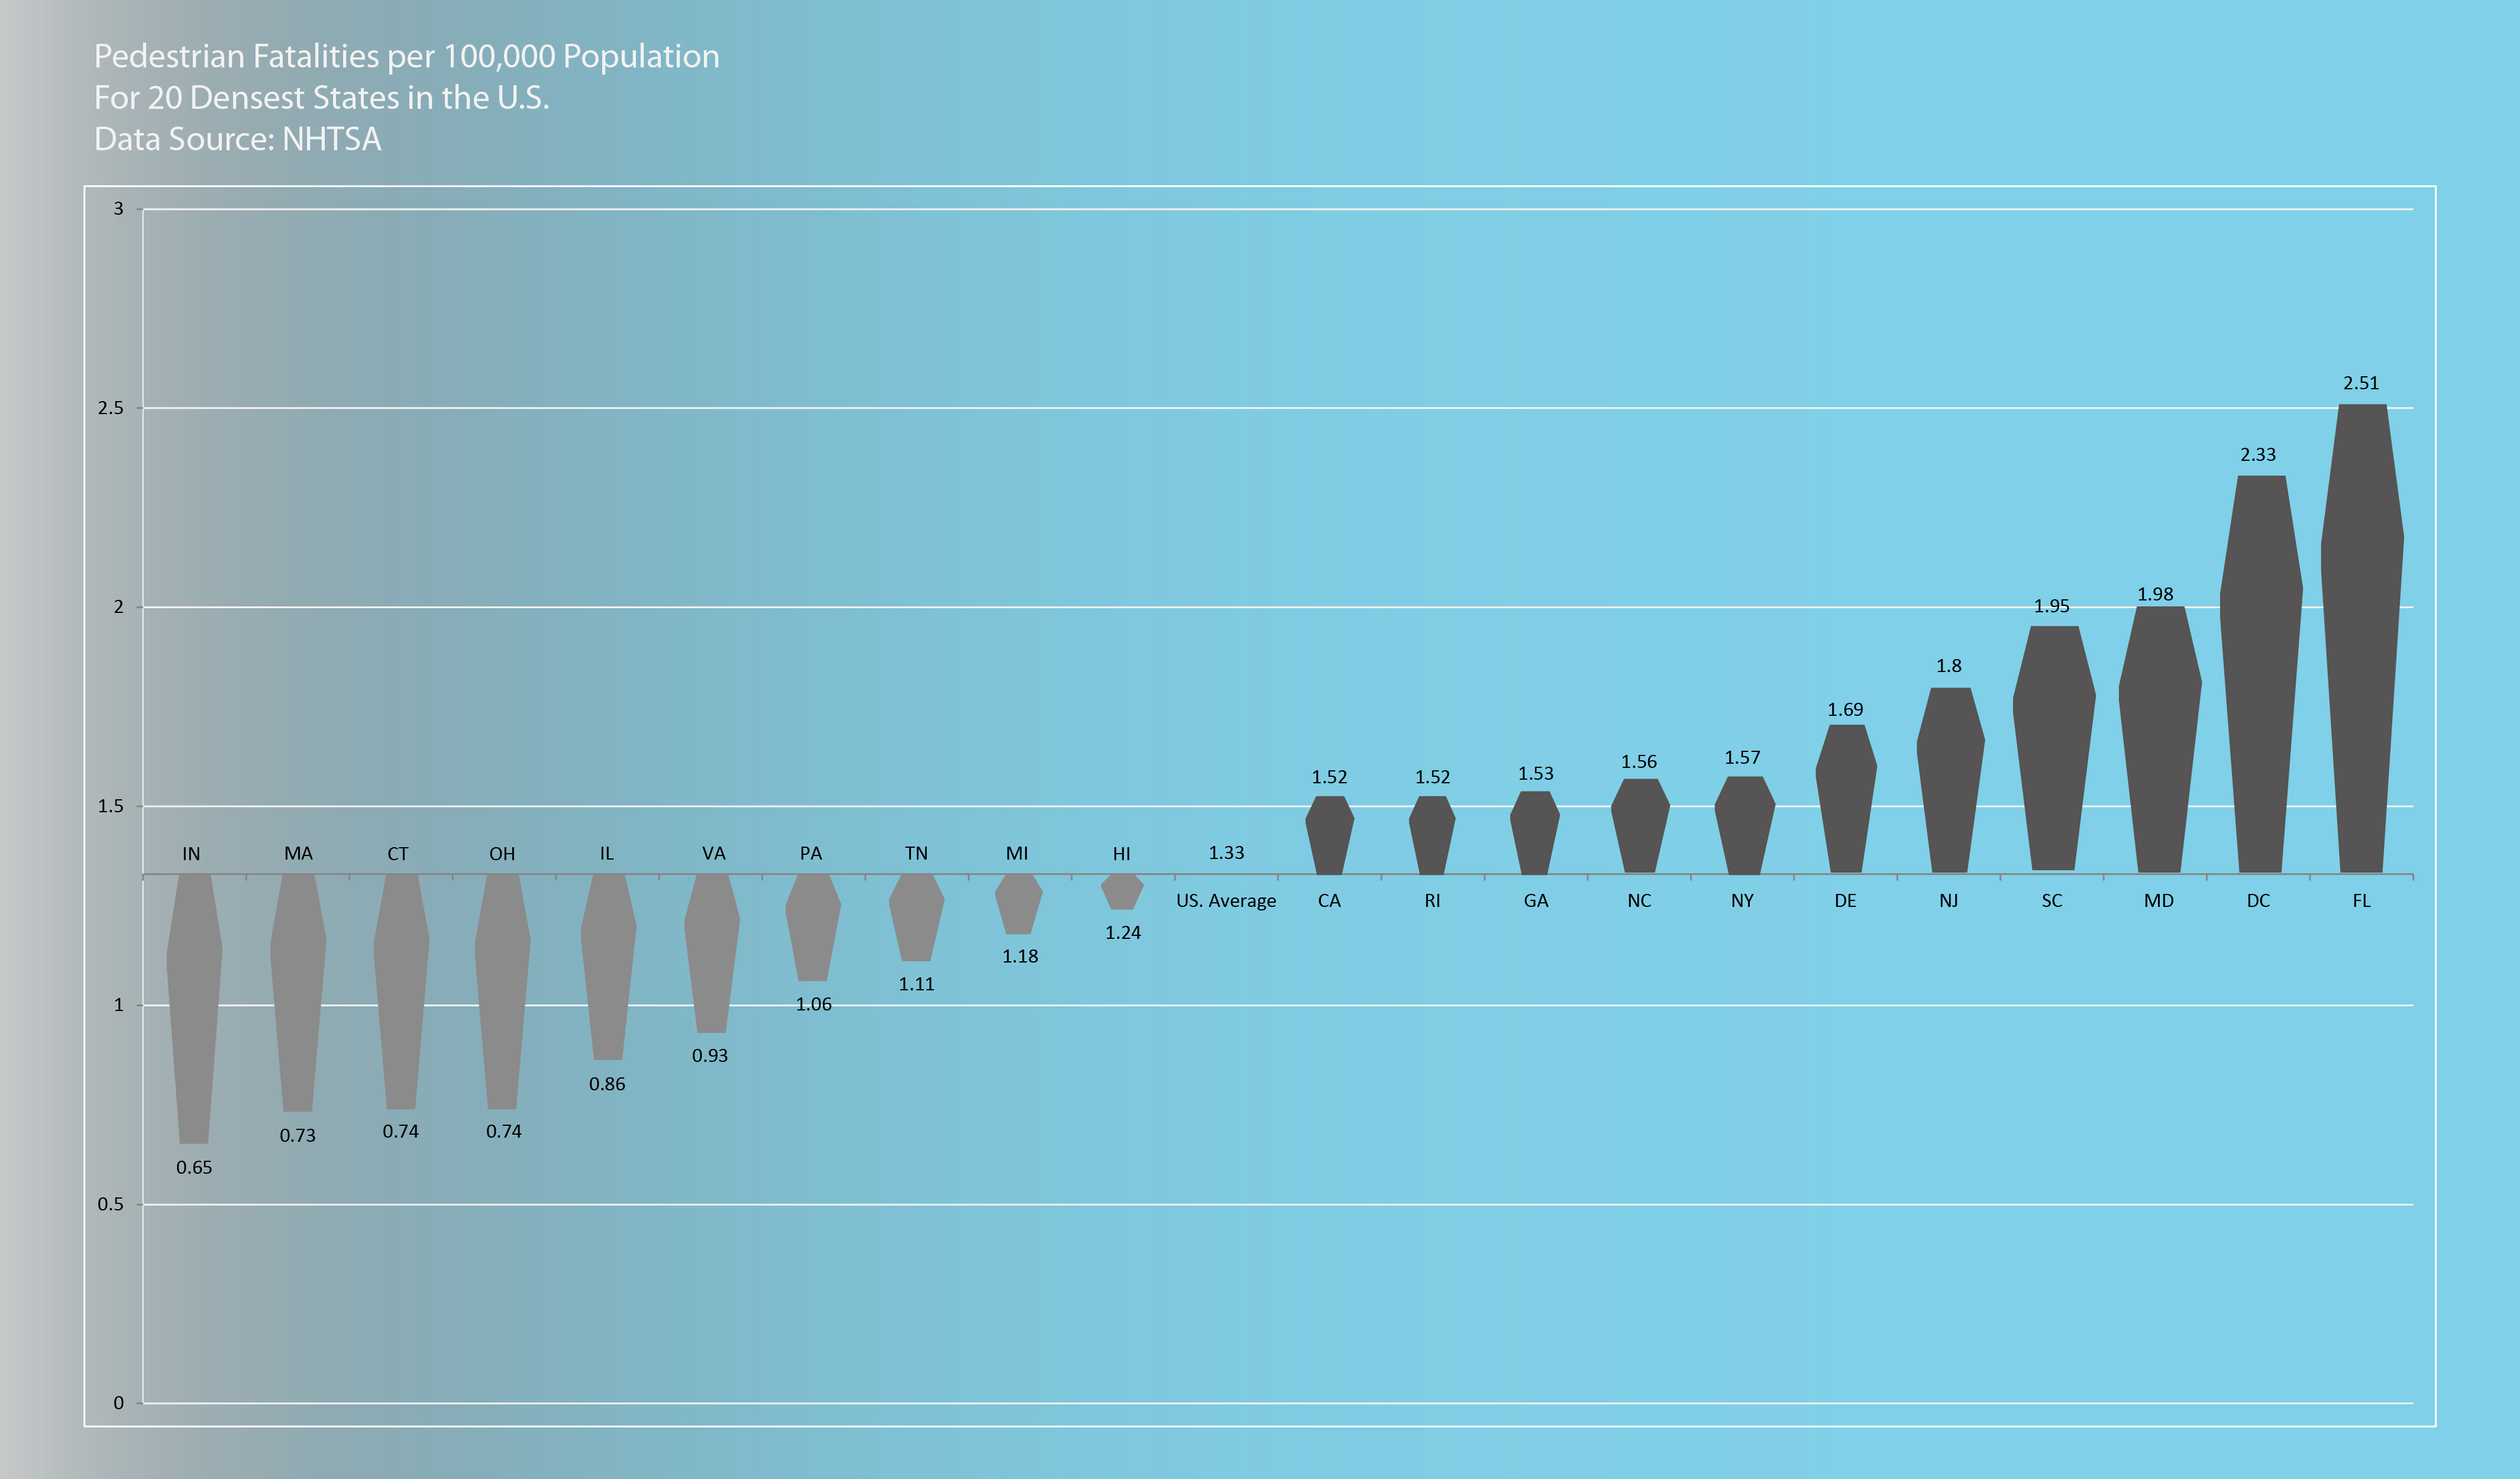
Pedestrian Fatalities per 100,000 people, for 20 Densest States in the US
Updates
Leave feedback in the comments!
Log in or sign up for Devpost to join the conversation.