-
-
Visualizations1
-
Visualizations2
-
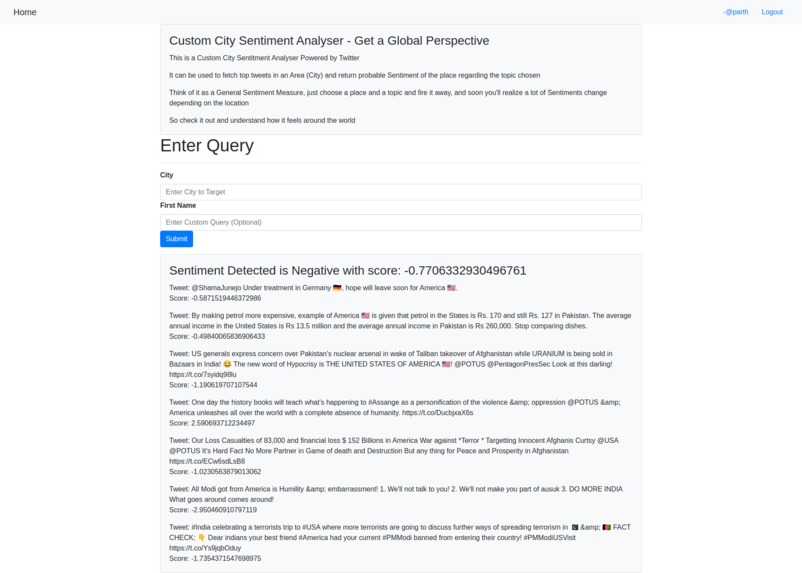
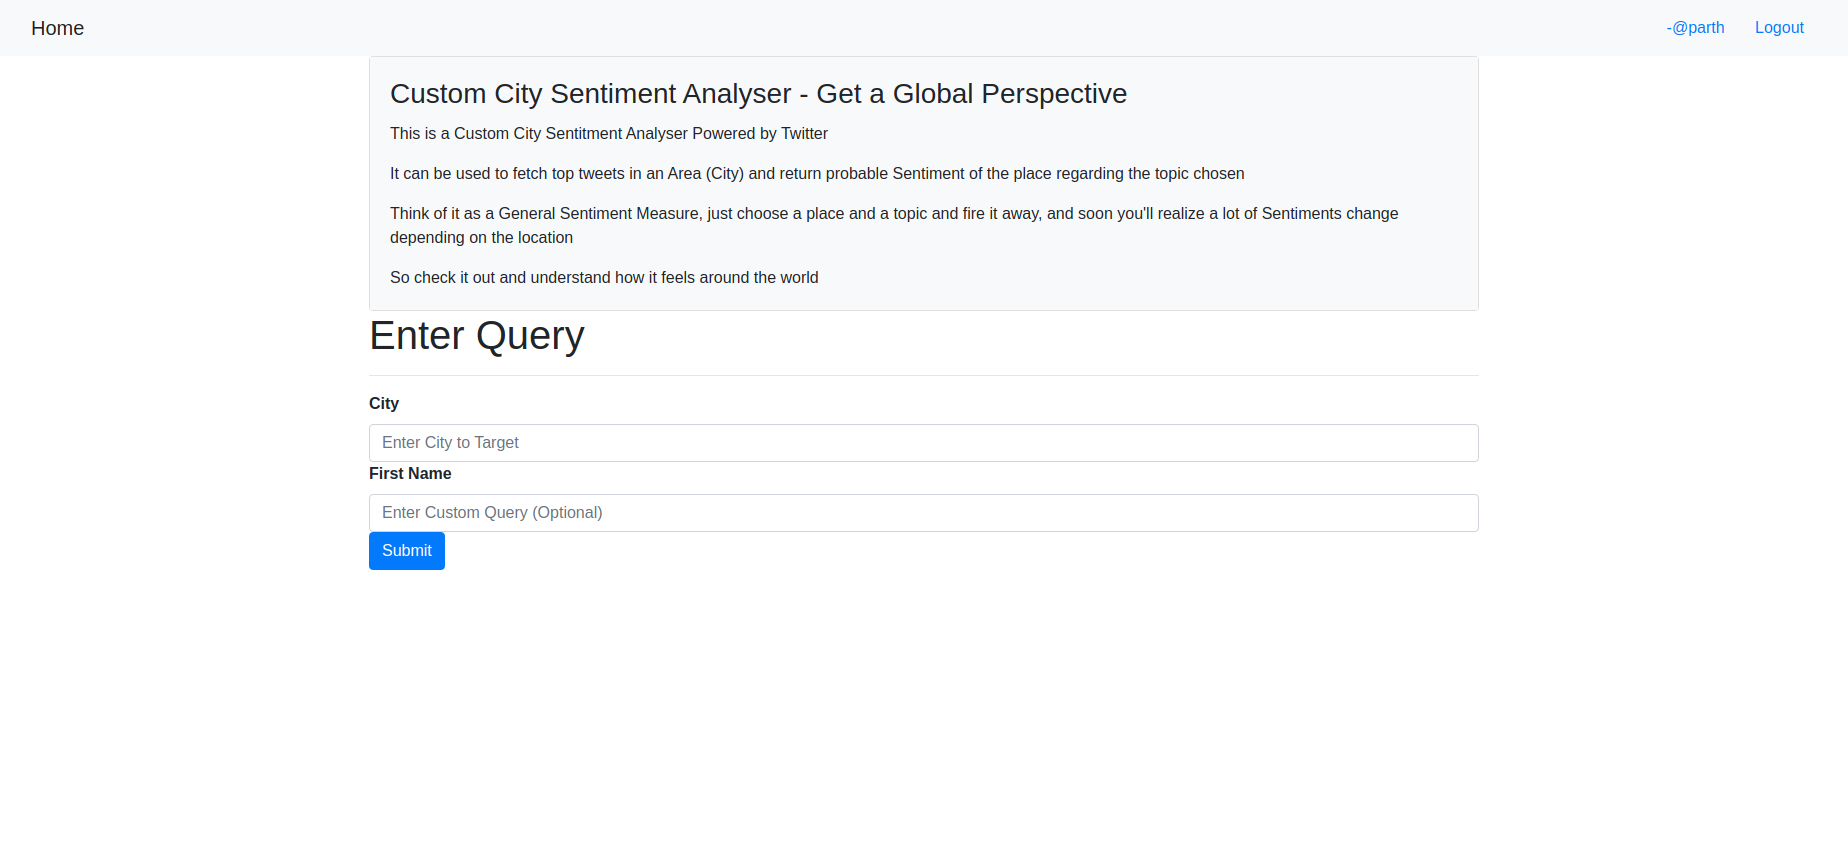
Sentiment Analyser
-
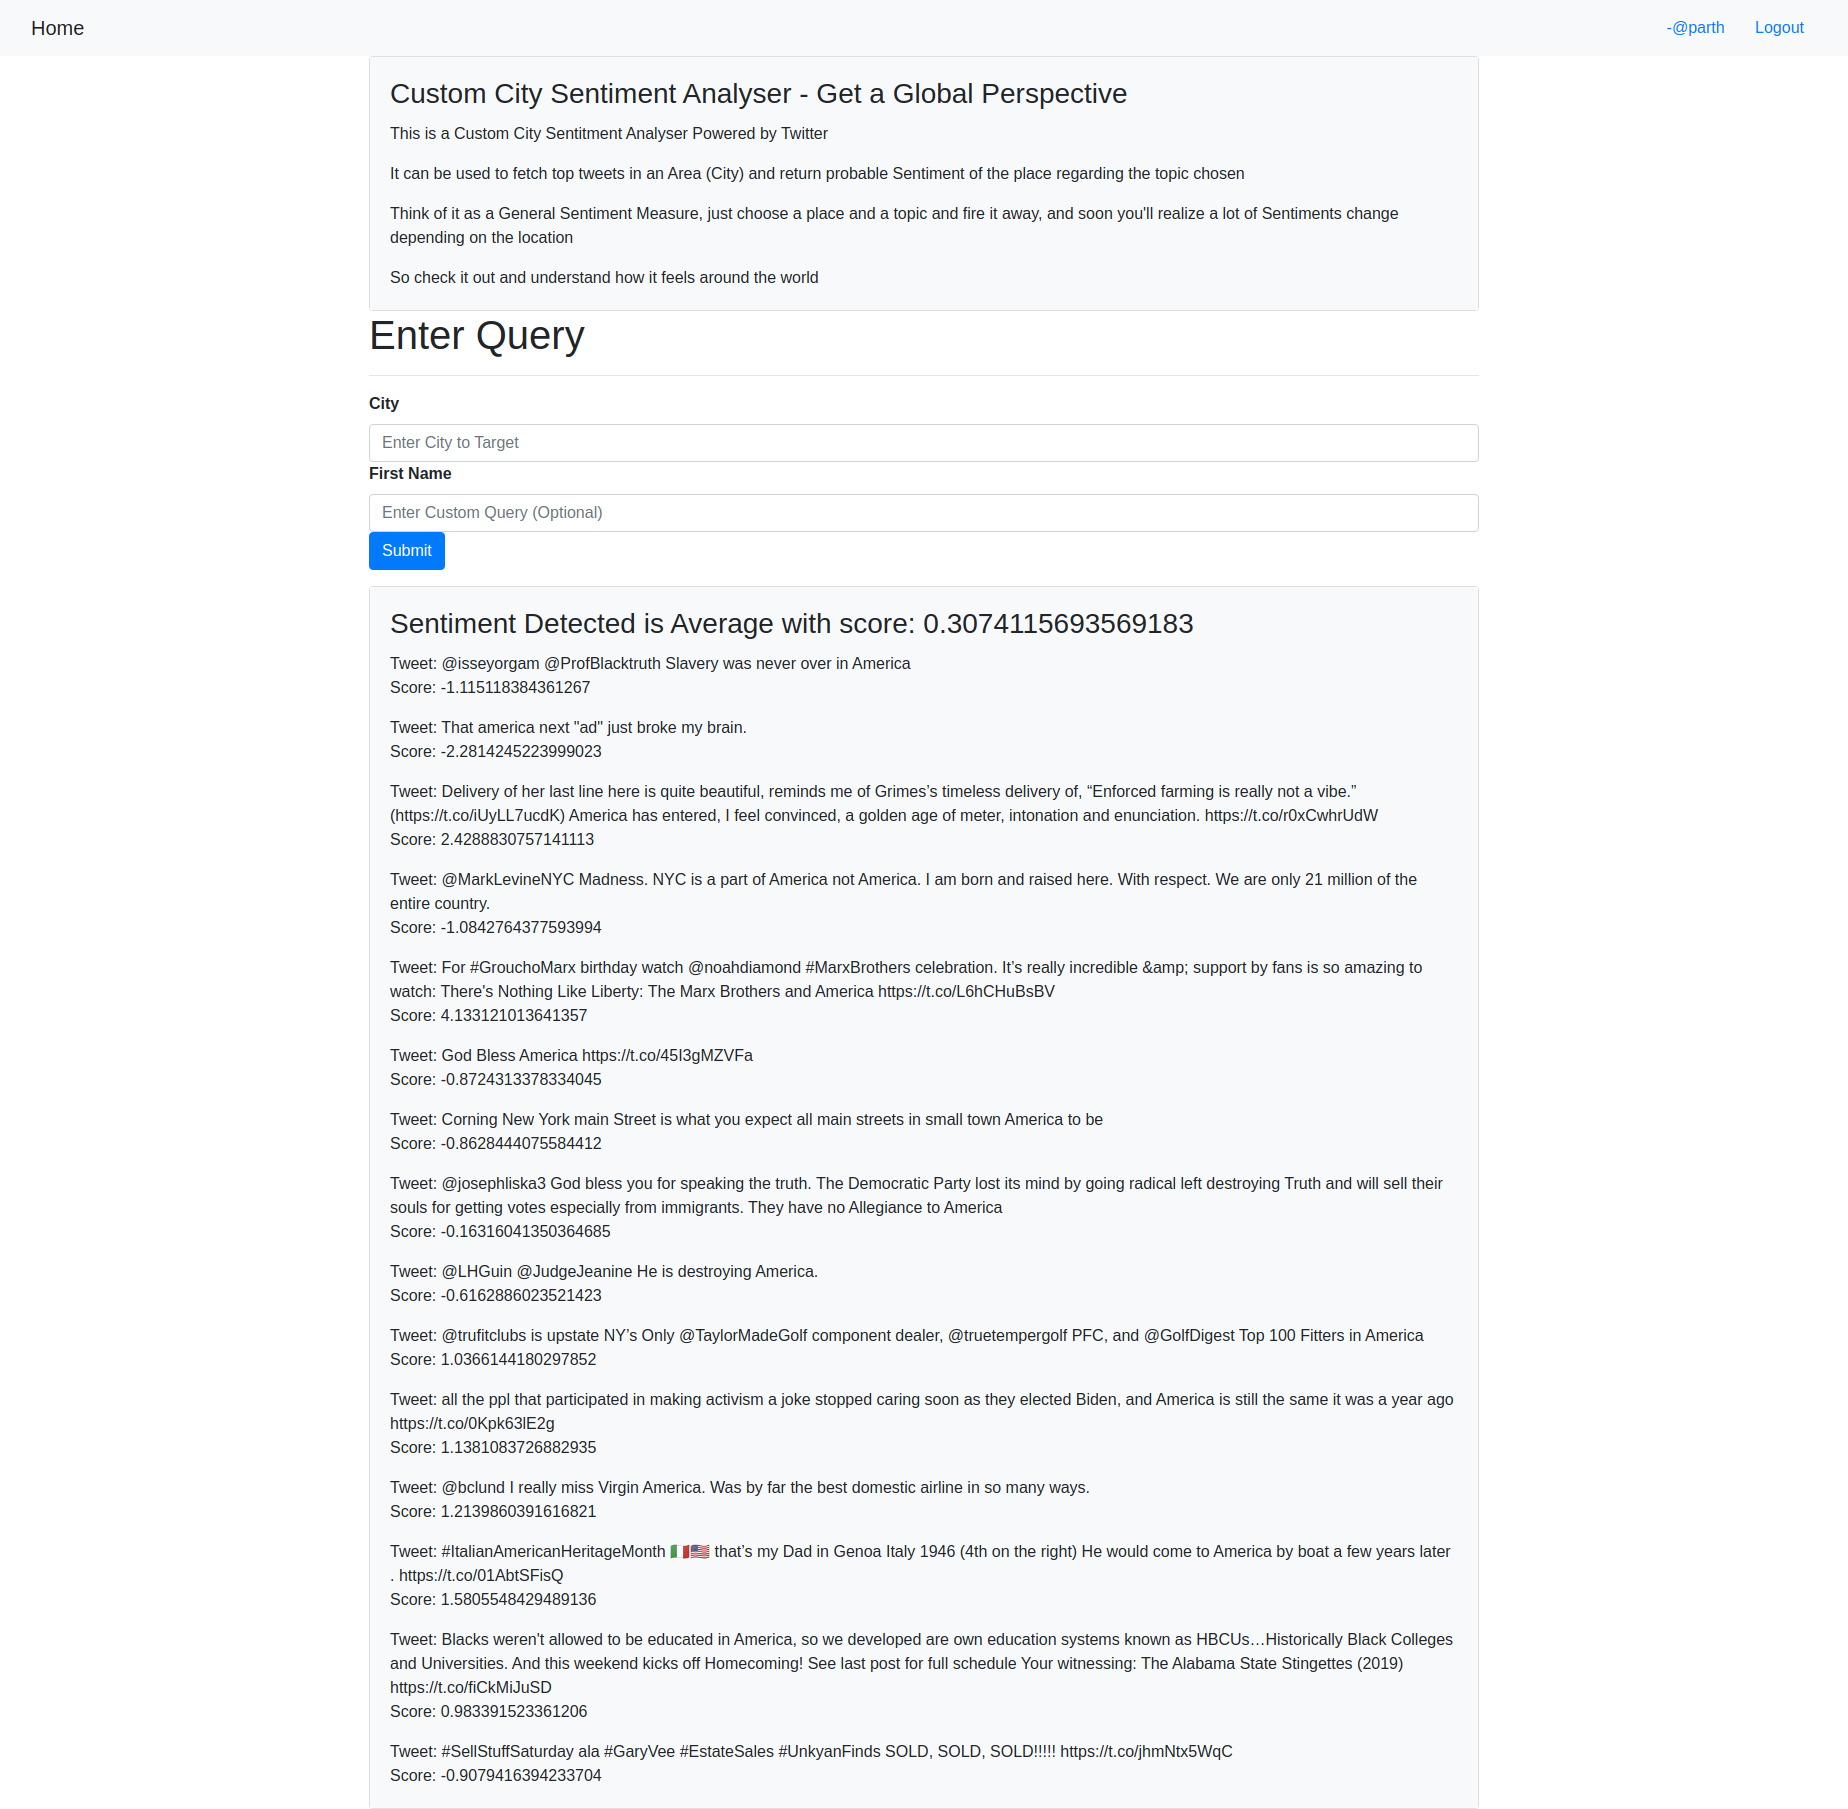
First Perspective
-
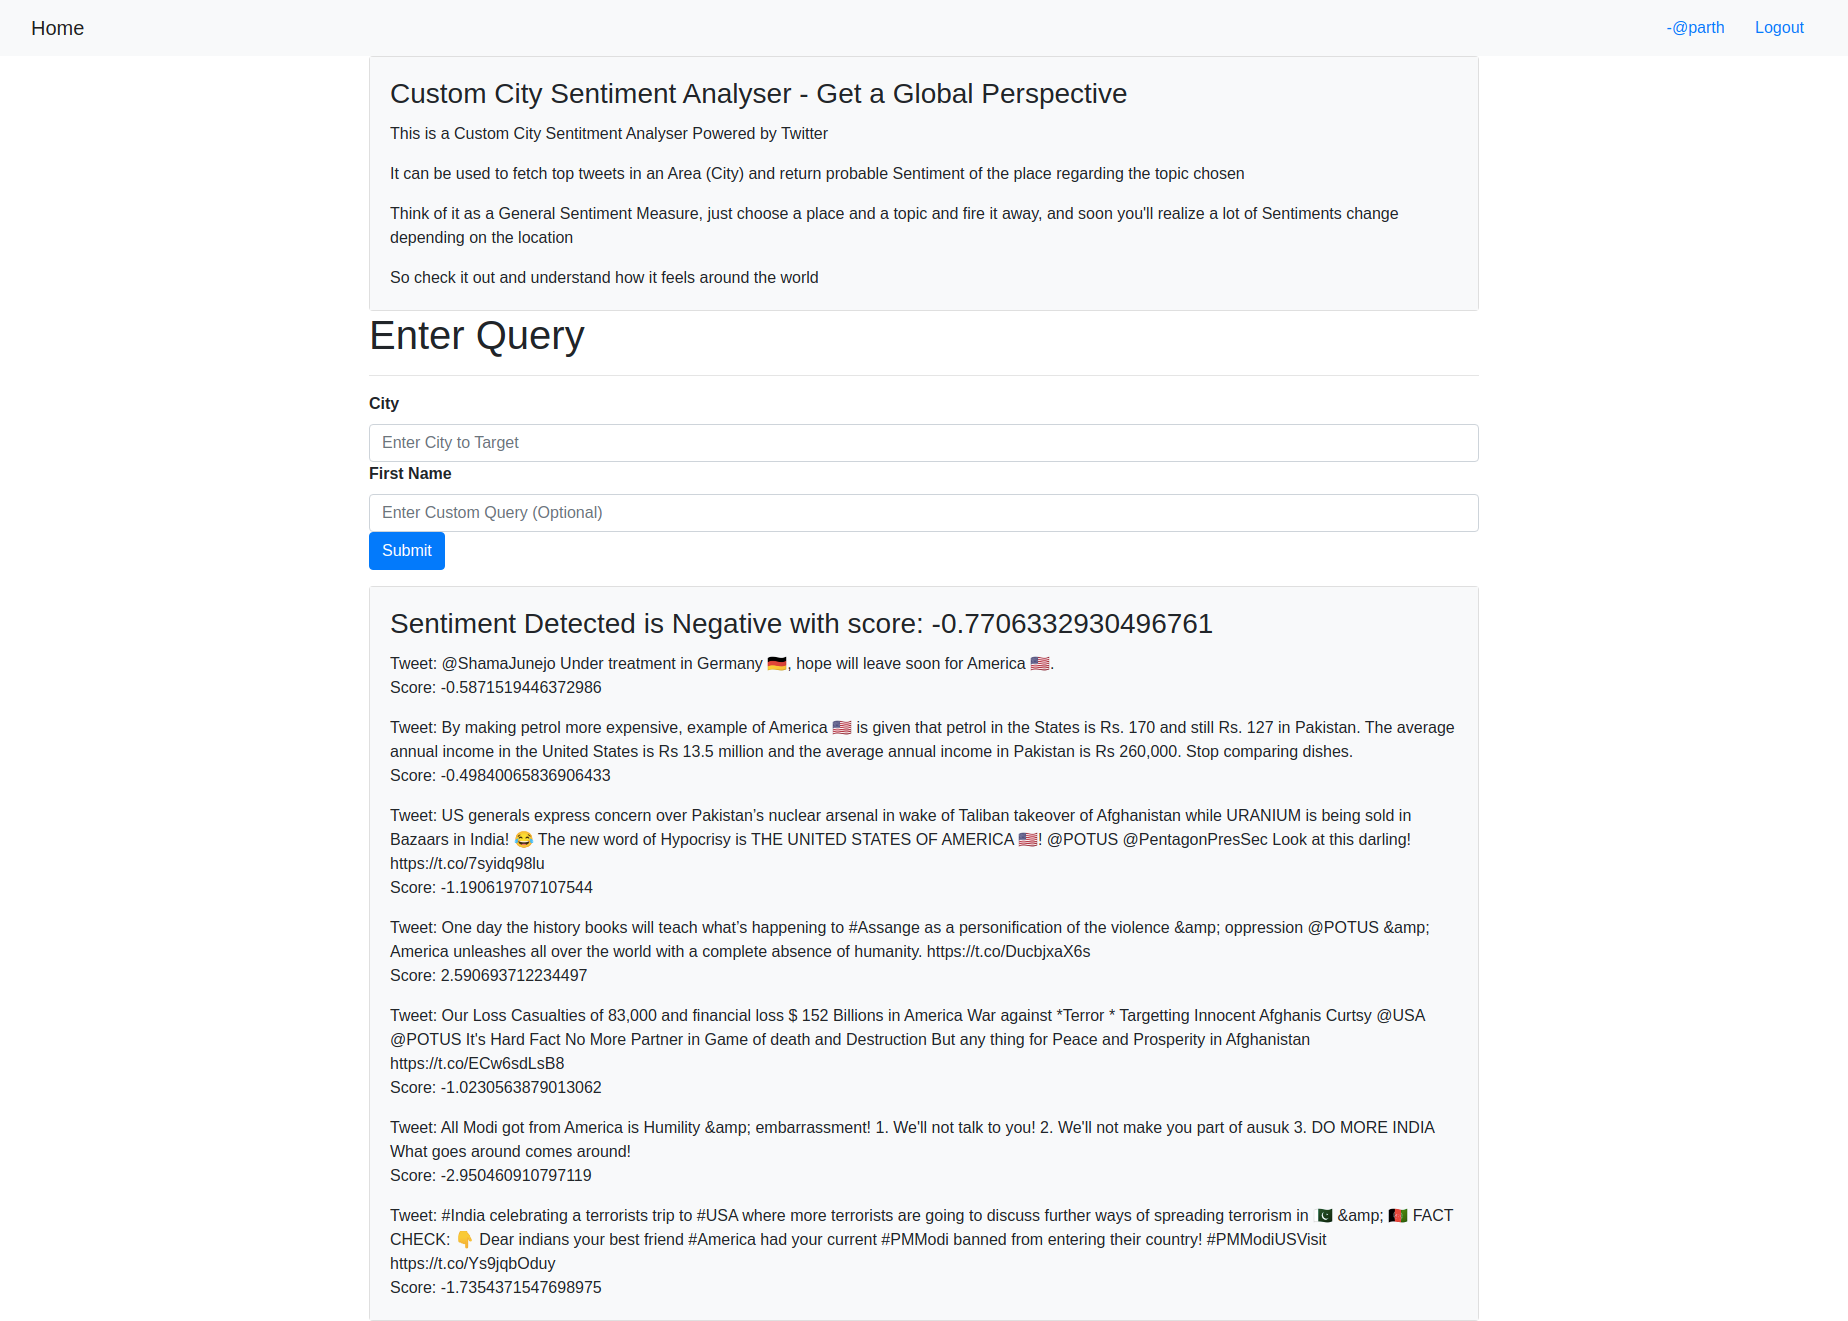
A different Perspective


carolina_data_challenge
Official Submission to Carolina Data Science Challenge
Inspiration
What if can quatify the happiness of a place in just minutes.
The power of Big Data and AI enables us to tap into data feed of a region and topic and use that to do map out the sentiment of area.
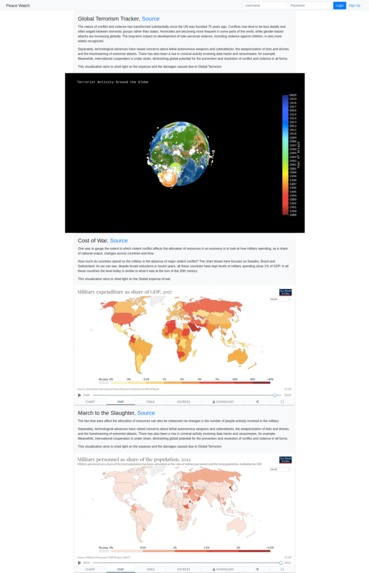
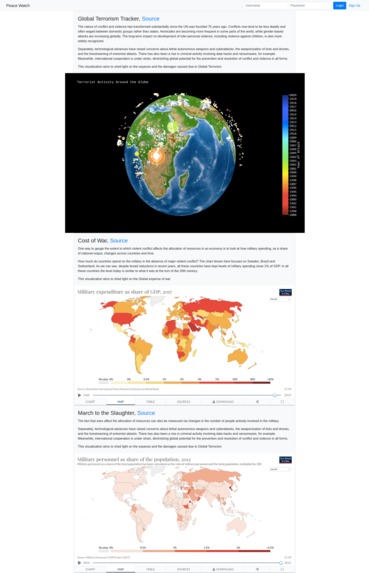
Similarly on opposite end of the spectrum, what if there was a way to easily identify the sheer magnitude of loss and destruction, our 3D visualization enables us to do so.
What it does
There are basically two components to the solution
- War Visualizer: a 3D plot of war data, quantifying the damage and region most affected by violent skirmishes
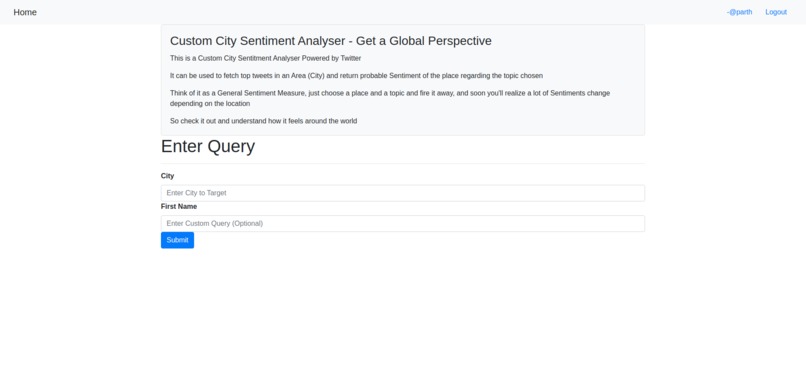
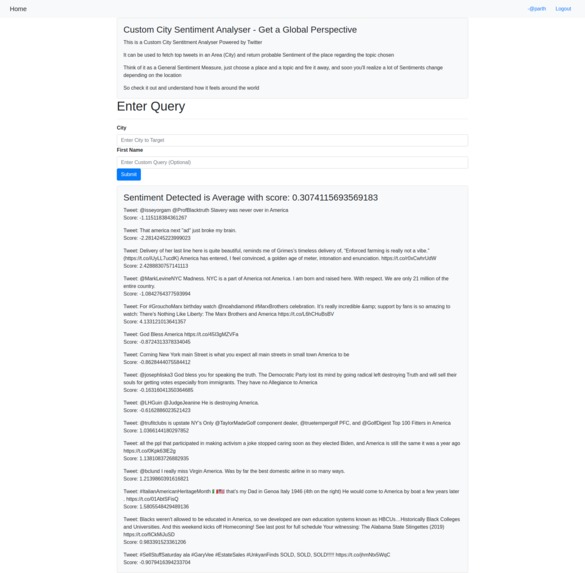
- Sentiment Quantifier: An app that feteches twwet data using twiiter api with specific parameters, then run it through sentiment analyser and assign a score
How we built it
Built using Django platform in Python. The check the repository for the sources used for visualizations.
The sentiment analyser was trained using Tensorflow Twitter Dataset
Challenges we ran into
It was my first time deploying a CRUD application to Heroku
Accomplishments that we're proud of
Driving public attention to the sheer cost and loss caused due terrorsim, and quantifying the high military spendings accross the world
Creating a solution that tracks and display general population sentiment depending on topic and location
The following can be enumerated as key learnings:
1. Django Development
2. Plotly 3-D Visualizations
3. Tweepy Twitter Library
What's next for Peace Watch
The future work on the project is:
1. Finetuning Prediction Methodology
2. Adding further location support

Log in or sign up for Devpost to join the conversation.